U.S. Department of Transportation
Federal Highway Administration
1200 New Jersey Avenue, SE
Washington, DC 20590
202-366-4000
Federal Highway Administration Research and Technology
Coordinating, Developing, and Delivering Highway Transportation Innovations
 |
| This report is an archived publication and may contain dated technical, contact, and link information |
|
Publication Number: FHWA-HRT-04-154 Date: September 2004 |
PDF files can be viewed with the Acrobat® Reader®
As part of the implementation of the Federal Highway Administration (FHWA) smoothness initiative, the Profile Viewer and Analyzer (ProVAL) Software was initially developed to provide a means to view and analyze pavement profiles efficiently and robustly. Version 1.0 of the ProVAL software featured a profile data viewer and several common profile data analyses (e.g., Ride Indexes, Power Spectral Density, Butterworth filtering, Profilograph simulation, Rolling straightedge simulation, etc.). It also imported several popular profile data formats, such as ERD1, TxDOT2, and KJ Law3. A new standard profile format (PPF) was also created as a native ProVAL file specification, which proved to be stable, efficient, portable, and upgradeable. The PPF has since been recommended as the basis for the American Society for Testing and Materials (ASTM) draft profile data standard. Workshop material was also developed along with the ProVAL software to provide training in profiling fundamentals and the application of ProVAL.
Since the release of version 1.0 in late 2001, ProVAL has gained popularity from the road profiling industry, and demands for additional functionalities have increased tremendously. These demands have corresponded with the daily profile data analysis tasks of pavement management and other professionals. In response, the development of ProVAL 2.0 was recently initiated to include prioritized, frequently requested features such as event markers, linear distance adjustment, continuous roughness reports, TxDOT localized roughness identification, additional filter options, and more robust import features.
Sponsored by numerous State Highway Agencies (SHAs), an Association of State Highway Transportation Officials’ pooled fund study is currently underway entitled Improving the Quality of Pavement Profiler Measurement. In May 2003, there was a need to acquire an existing localized roughness algorithm (Bumpfinder) with grinder simulation.
Furthermore, with the availability and growing popularity of the ProVAL software, it was logical to recommend incorporating this algorithm as a means of deployment.

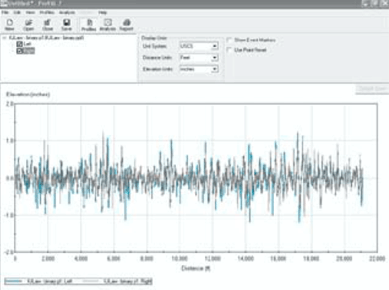
Figure 1. A screen capture from the ProVAL 2.0 software program shows
pavement profile characteristics at different elevations and distances.
The ProVAL 2.0 GUI has been re-designed to improve usability. Extensive profile data utilities (distance adjustment and event markers) are provided in the Edit Data window. Analysis types are now easily accessible via the menu, Analysis, when the Analysis window is active. The most significant GUI improvement is to provide the profile data selector in both the Profiles (viewer) and Analysis windows. The profile data selector in the Analysis window for each analysis type is independent and it can provide users with maximum flexibility for the data analyst.
The user can now read in very large data files (e.g., more than 1 million data points) into ProVAL 2.0. In fact, the size of data file will probably only be limited to the available memory on the user's computer.
There are two main profile data utilities in ProVAL 2.0 as follows:
Linear Distance Adjustment
The user is now empowered to adjust the profile distance by supplying either a new sampling interval or total distance at data inspection stage. An offset value can also be supplied to adjust the original starting point. These Linear Distance Adjustment settings can then be used as an option (Use Linear Adjustment and Use Point Reset) later in the profile data analysis stage for some analyses.
Event Markers
Event markers have been one of the most frequently requested features. The event markers can be set in the Edit Data window by typing any descriptive text at the desired data locations. The users then can view the profile data with the event markers turned on or off.
The user can also define lead-in and lead-out by using the Set Begin Point and Set End Point buttons in the Edit Data window. The user can then decide whether or not to cut off leadin/ lead-out or not use the Use Point Reset button in the viewer and analysis windows.
Dynatest RSP profile data can now be imported into ProVAL 2.0. It should be noted that not all information in the Dynatest RSP profile data file could be imported. Please refer to the ProVAL 2.0 Users Manual for details.
Software can be obtained online at www.roadprofile.com