U.S. Department of Transportation
Federal Highway Administration
1200 New Jersey Avenue, SE
Washington, DC 20590
202-366-4000
Federal Highway Administration Research and Technology
Coordinating, Developing, and Delivering Highway Transportation Innovations
 |
| This report is an archived publication and may contain dated technical, contact, and link information |
|
Date: May 2002 |
PDF files can be viewed with the Acrobat® Reader®
U.S. Department of Transportation
Federal Highway Administration
Research, Development, and Technology
Turner-Fairbank Highway Research Center
6300 Georgetown Pike
McLean, VA 22101-2296
3.1 Trucks
3.2 Static Weights
3.3 Spacing
3.4 Temperatures
3.5 Speeds
3.6 Equipment Readiness
3.6.1 Weight calibration3.7 Pavement Smoothness
3.6.2 Classification
3.7.1 Short wavelength
3.7.2 Long wavelength
4.1 Coordination
4.2 Schedules and Duration
4.3 Trucks and Drivers
4.4 Staffing4.4.1 Data Collection
4.4.2 Smoothness
4.5 Go/ No Go Decisions
5.1 Smoothness
5.2 Weight Criteria
7.1 Arizona
7.2 Florida
7.3 Maryland
7.4 Michigan
7.5 Texas
8.1 Arizona
8.2 Florida
8.3 Maryland
8.4 Michigan
8.5 Texas
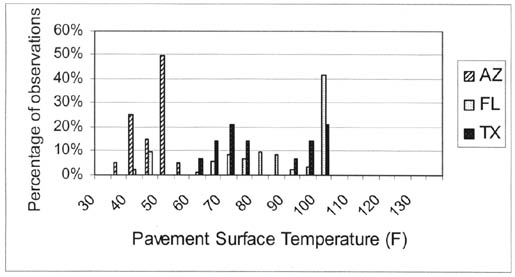
Figure 3-1 Temperature variation AZ, FL, TX
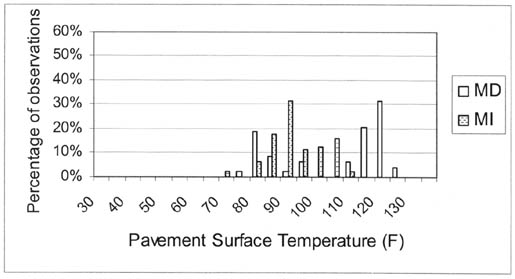
Figure 3-2 Temperature variation -- MD, MI
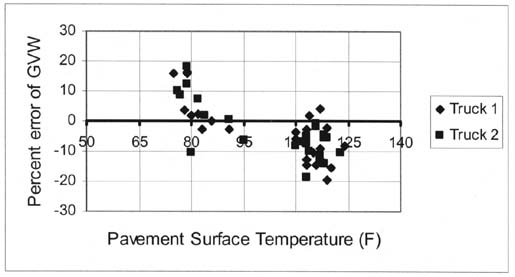
Figure 3-3 GVW sensitivity to temperature
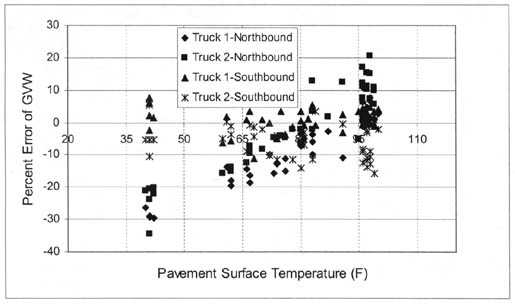
Figure 3-4 Piezos with different temperature sensitivities
Figure 3-5 Speed distributions -- AZ, FL n.b., MD
Figure 3-6 Speed distributions -- FL s.b., MI, TX
Figure 3-7 Tandem axle weight variability with speed
Figure 4-1 Flow diagram of SPS traffic pooled fund activities
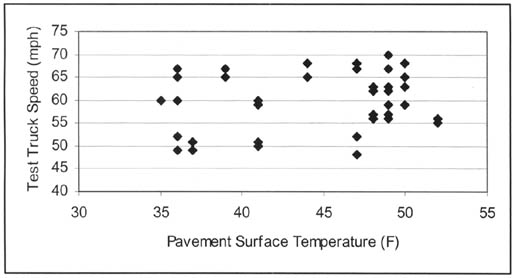
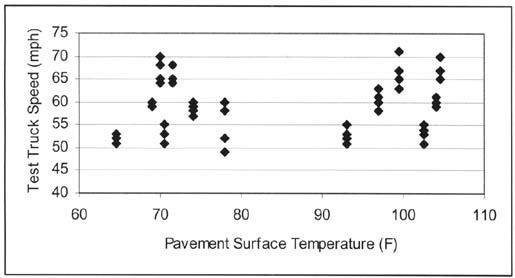
Figure 5-1 AZ speed/temperature combinations
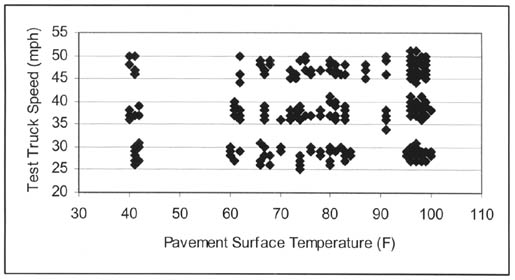
Figure 5-2 FL speed/temperature combinations
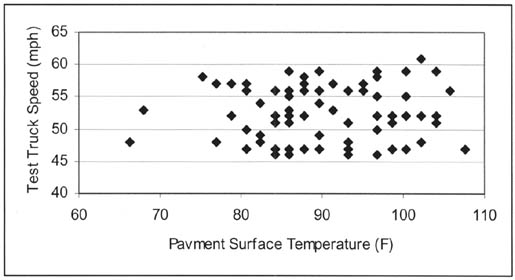
Figure 5-3 MD speed/temperature combinations
Figure 5-4 MI speed/temperature combinations
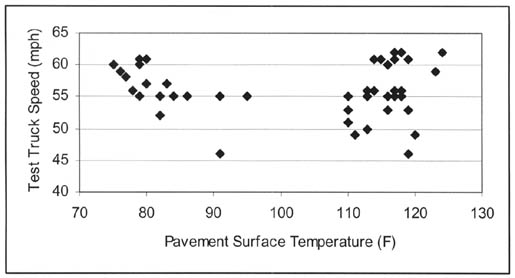
Figure 5-5 TX speed/temperature combinations
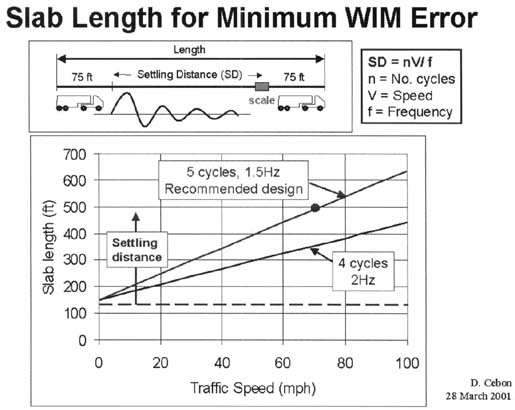
Figure 6-1 Method for slab length determination
Table 3-1 WIM System Calibration Tolerances
Table 3-2 Computed axle spacing means and confidence intervals in feet
Table 3-3 Computed axle spacing means and confidence intervals expresses in percentage error
Table 7-1 Overall AZ site 0600 results
Table 7-2 Overall FL site -- Piezo-electric WIM results
Table 7-3 Overall FL site -- Bending Plate WIM results
Table 7-4 Overall MD 0500 site results
Table 7-5 Overall MI 0100 site results
Table 7-6 MI site results with selected trucks
Table 7-7 Overall TX 0100 results
Table 8-1 AZ Static Test Truck measurements
Table 8-2 AZ raw data for LTPP lane
Table 8-3 FL Static Test Truck Measurements
Table 8-4 FL Piezo Lane 1 -- Raw data for Truck 1
Table 8-5 FL Piezo Lane 1 -- Raw data Truck 2
Table 8-6 FL Piezo Lane 2 -- Raw data Truck 1
Table 8-7 FL Piezo Lane 2 -- Raw data Truck 2
Table 8-8 FL Bending Plate Lane 1 -- Raw data Truck 1
Table 8-9 FL Bending Plate Lane 1 -- Raw data Truck 1
Table 8-10 FL Bending Plate Lane 4 -- Raw data Truck 1
Table 8-11 FL Bending Plate Lane 4 -- Raw data Truck 2
Table 8-12 MD Static Test Truck Measurements
Table 8-13 MD Raw data for LTPP lane
Table 8-14 MI Static Test Truck Measurements
Table 8-15 MI Raw data for LTPP lane
Table 8-16 TX Static Test Truck Measurements
Table 8-17 TX Raw data for LTPP lane
The Long-Term Pavement Performance program has embarked on a nationwide effort to improve the quality and quantity of traffic data available. The effort is focused on the Specific Pavement Studies experiments involving new construction and pavements with asphalt overlays, SPS-1, -2, -5 and -6. Due to concerns about the availability of research quality loading data for analysis purposes, the LTPP program has proposed to assume the responsibility for traffic collection using the FHWA pooled fund mechanism. States may pay to have as much or as little of their SPS traffic collection done by LTPP rather than using internal agency resources.
As is customary for LTPP data collection activities, a series of protocols and guidelines has been developed in order to acquire uniformly collected, research quality data. The guidelines include a suggested performance based equipment specification for equipment replacement, a performance specification for validating equipment operation in the field and a pavement smoothness criteria. In addition, a field protocol addressing the calibration and validation procedures has been prepared.
Over the summer and fall of 2001, LTPP staff oversaw a series of pilots to verify that the performance specifications and field procedures were feasible. The pilots looked at both piezo and bending plate sensor systems installed in asphalt and PCC pavements. Included in the pilots was one site to test the reinstallation process and a site to do a side by side comparison of the principal sensor systems, piezo and bending plate.
As a result of the pilots the following occurred:
The Specific Pavement Studies (SPS) projects in experiments 1, 2, 5, 6 and 8 are the subject of a concentrated effort to obtain research quality traffic loading data. For the SPS-1, -2, -5, and -6 projects this effort focuses on acquiring weight data which meets the performance standards for gross vehicle weight and axle information in ASTM E 1318 Type I WIM systems (Highway Weigh-In-Motion (WIM) Systems with User Requirements and Test Methods, 1994.). In contrast, the SPS-8 experimental sections are expected to have minimal truck traffic. The inclusion of this experiment is intended to provide a resource for verifying light loads or for obtaining information on sites which have a greater number of trucks than originally expected when the site was built.
The effort to upgrade traffic data collection for selected SPS experiments began in 1999 with input from the TRB LTPP Committee Traffic Expert Task Group (Traffic ETG). They noted that scarcity of traffic data as well as lack of knowledge about the limited data available constituted a deficiency in the ability of the LTPP program to get the maximum value out of the investment in the SPS-1, -2, -5 and 6 experiments. As a result, FHWA directed that a change in the traffic data collection process for these experiments be considered. The recommendation adopted was for a centrally run program for equipment installation, maintenance and data collection with a recommended equipment standard. States have the opportunity to participate in a pooled fund study that implements the recommended program. The fund is structured so that a state may select which, if any, of the services it wishes to use.
As with any other LTPP data collection effort managed by FHWA, the pooled fund study required the development of equipment and pavement guidelines and data collection protocols. Inputs to the guidelines and protocols included the professional experience of the practitioners who constitute the Traffic ETG, FHWA staff and contractors and ASTM E-1318. It was the consensus of the Traffic ETG that the most likely installation to meet the specified accuracy requirements for research needs over a range of operating conditions was bending plate in portland cement concrete. The guidelines reflect that consensus. The suggested equipment guidelines are, however, performance based rather than equipment specific. The pavement guidelines include a sample grinding specification and smoothness specifications that address both short wavelength and long wavelength conditions. All of the guidelines were made available to the traffic data collection community prior to writing the data collection protocols. The data collection protocols developed include practices for initial site evaluation, on-going site validation, and installation and construction acceptance conditions.
To test the various protocols and guidelines, five pilot studies were conducted in the summer and fall of 2001. The pilots concentrated on site validation. It was shown that the documents developed were essentially correct as written. The accuracy requirement for weights for Type I equipment in ASTM E-1318 can be met with equipment currently in operation. Pavement smoothness makes a difference. The sensitivity of piezo ceramic sensors to temperature variation was observed. Greater variability of piezo sensors when compared to bending plate sensors under side by side testing was observed. The need to have a consistent means for measuring and documenting the quality of WIM data being collected was a significant finding as the pilots progressed. It was not possible to evaluate a new installation beginning with the contracting process so some uncertainty remains in the recommendations for those phases of data collection.
The requirements for a site to be accepted for research data collection are shown in Table 3-1. Since the weight data is the only information that is required for use in pavement analysis work, those conditions are the only ones that a site must meet. It was the recommendation of the Traffic ETG that failures with respect to vehicle speed or axle spacing were of more importance to classification issues than weight issues. Since the thrust was weight data collection, assuming accurate classification, the speed and spacing information was identified as a diagnostic measure rather than a performance criterion to define research quality weight data.
| SPS-1, -2, -5, -6 and -8 Sites | 95 Percent Confidence Limit of Error |
|---|---|
| Loaded single axles | ±20 percent |
| Loaded tandem axles | ±15 percent |
| Gross vehicle weights | ±10 percent |
| Vehicle speed | ±1 mph [2 km/hr] |
| Axle spacing length | ±0.5 ft |
Site validation can be done using test trucks of the traffic stream. The traffic stream provides a better representation of site conditions. However, the logistics of providing reliable static comparison weights at the vast majority of the target sites precluded adoption of this as the recommended method. Adoption of the test truck method resulted in a two truck minimum fleet. Two trucks were considered the minimum to insure that a truck with unusual characteristics did not result in flawed data after the validation was completed.
For purposes of site to site comparisons, a 3S2 (5-axle tractor, semi-trailer combination) was selected as the standard vehicle. It needs to have an air suspension system on all tandem axles. The air suspension should be in good condition. This is qualitative, as no quantitative measure for this aspect has been defined to date. This vehicle should be loaded to approximately 80,000 pounds with a load that will not shift. This truck was selected as being the most critical to pavement evaluations with the suspension giving it the best chance of passing. The second vehicle should represent the predominant truck contributing to pavement loading at the site. It may be a 3S2 with the same weight and a different suspension, a heavier vehicle in states with higher or seasonal load limits, another 3S2 with an air suspension and a much lighter load, or a different axle configuration or another vehicle entirely. The ASTM E-1318 recommendation of a 2-axle vehicle as the second truck was not adopted. The one light 2-axle vehicle used behaved entirely differently from the other two vehicles, a fact attributed primarily to site roughness. The merit of excluding dump trucks was partially vindicated by one site. However, the dump used at another site did not produce results that much different from the 3S2 used at the site.
Locating certified scales within a reasonable distance of the sites has not been a problem.
To counter the impact of shifting loads (even though they are not supposed to) and the effect of fuel usage on weight, iterative vehicle weighing is done before and after the validation process. To overcome the inability to determine where a weight change occurred in the absence of axle scales a multi-pass weighing procedure was adopted. It involves moving the truck across a platform scale so that individual axle weights can be either measured or calculated. Three separate measurements of gross vehicle weight (GVW) are also required. This helps to account for variability in the static weights. It also helps to determine any problems with trucks prior to commencing a validation session. A standard for a successful pre-validation static weighing session was set as the standard deviation of the GVW being one-third or less of the tolerance required for the equipment to pass the weight criterion (three and a third percent). For the post-validation static weighing only a single GVW measurement is required if the change from the pre-validation weight is less than 1,000 pounds.
The spacing criterion was taken directly from ASTM E-1318. As shown in Table 3-2 the criterion appears reasonable as a test of within group (i.e. tandem) spacing. However, between group spacings, with two exceptions all exceed the 0.5 foot criterion, five of them by nearly a factor of two. Changing the spacing computations to include all spacings does not increase the number of sites meeting the criterion, as shown by the number of shaded cells.
| State | Within Group | Between Group | All spacings |
|---|---|---|---|
| AZ | 0.16 ± 0.45 | 0.74 ± 1.18 | 0.45 ± 1.05 |
| FL n.b. piezo | -0.12 ± 0.10 | 0.16 ± 0.36 | 0.02 ± 0.38 |
| FL s.b. piezo | -0.12 ± 0.10 | 0.16 ± 0.34 | 0.00 ± 0.38 |
| FL n.b. bending plate | -0.15 ± 0.30 | 0.01 ± 0.98 | -0.07 ± 0.74 |
| FL s.b. bending plate | - 0.03 ± 0.31 | 0.71 ± 1.33 | 0.34 ± 1.20 |
| MD | -0.04 ± 0.11 | -0.25 ± 0.37 | -0.14 ± 0.34 |
| MI | 0.10 ± 0.60 | 0.30 ± 1.60 | 0.32 ± 1.61 |
| TX | 0.02 ± 0.32 | 0.14 ± 0.86 | 0.08 ± 0.65 |
Consideration should be given to the continued inclusion or revision of the spacing criterion. Either greater emphasis should be put on spacing calibration to obtain good classification results or a wider confidence interval identified. Failure to meet the spacing criterion is currently a non-fatal flaw. The impact of changes and the relationship to a larger tolerance needs to be addressed in terms of implications for classification failures, their diagnosis and multiple state classification algorithms. Alternatively, the criterion could be applied only to axle groups. It is interesting to note that two of the sites that failed due to variability of weight with speed also failed to meet the criterion for within group axle spacing. The allowable variability, 0.5 feet, is the distance traveled in slightly under one-hundredth of a second at 35 mph or a fraction over five thousandths of a second at 65 mph.
One alternative that has been proposed is expressing the spacing failures as a percentage. If 0.5 feet is take as a percentage of the expected spacing for a tandem axle group, then the equivalent percentage is approximately 12 percent. Table 3-3 illustrates the application of this criterion. As compared to Table 3-2 the number of failures has been significantly reduced. This raises the question as to what the percentage is that should be used if a percentage error option is adopted.
| State | Within Group | Between Group | All spacings |
|---|---|---|---|
| AZ | 2.9 ± 8.1 | 2.9 ± 4.2 | 2.9 ± 6.5 |
| FL n.b. piezo | -2.7 ± 2.3 | 0.5 ± 1.6 | -1.1 ± 3.7 |
| FL s.b. piezo | -2.9 ± 2.4 | 0.6 ± 1.5 | -1.1 ± 3.9 |
| FL n.b. bending plate | -3.4 ± 6.8 | -0.1 ± 3.8 | -1.8 ± 6.4 |
| FL s.b. bending plate | -0.8 ± 7.2 | 2.6 ± 4.5 | 0.9 ± 6.9 |
| MD | -1.0 ± 2.5 | -1.15 ± 1.4 | -1.0 ± 2.0 |
| MI | 2.0 ± 13.2 | 2.0 ± 10.1 | 2.0 ± 10.9 |
| TX | 0.2 ± 0.4 | 1.1 ± 2.2 | 0.6 ± 1.2 |
One set of analyses examines the sensitivity of the scale system to changes in pavement temperature. The range of temperatures on site for any given day is effectively random. Overcast conditions, rain, start and end times and rush hour operations all affect the observed frequency and range. However, the goal of at least a 30 degree Fahrenheit range of pavement temperatures during a site visit is not unreasonable. Figure 3-3 and Figure 3-4 show support for both continuous temperatures and the minimum 30 degree range. With in each vertical line is a 15 degree range. Two consecutive ranges where data exists highlight temperature sensitivity problems.
Because the field test can not control actual pavement temperatures, the grouping process is dependent on the actual temperature observations obtained. The recommended grouping process splits the day's test runs into three groups. The difference between the high and low temperatures produces the range that is then divided into 3 evenly spaced bins. The number of points in each group is not necessarily equal. There are some instances in the pilots where only two bins could be justified due to the sample sizes resulting from a three bin split.
It was noted in measuring temperatures at several sites that a five to seven degree differential was possible between the shoulder where the temperature was measured and the center of the lane in the middle of the sensor. However no temperature variation was observed along the wheel path. Since temperature is a qualitative rather than a quantitative variable this is not a major issue. It does however emphasize the need to take all temperature measurements for a weighing session at the same location.
Temperature sensitivity is an issue with piezo sensors as shown in Figure 3-3. Continuing to get the widest possible range of temperatures remains important. For sites undergoing semi-annual validation both hot and cold conditions can be captured. For the initial evaluation, the best indicator of a potential continuing temperature sensitivity problem is to validate on a day where a reasonably wide range of temperatures including an extreme are possible.
As the graph in Figure 3-4 shows this sensitivity does not automatically come with a piezo system. The sensors on either side of the road in Florida behaved very differently, possibly due to the mix of piezo sensor types in the northbound lane and the method by which temperature corrections were applied.
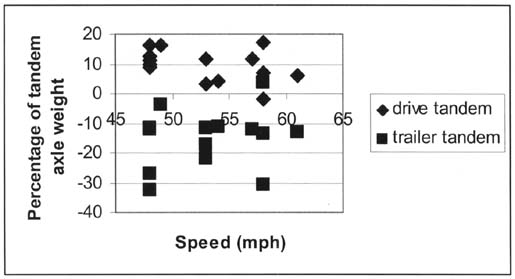
Another set of analyses examines the sensitivity of the scale system to changes in vehicle speed. The collection requirement is that the range covers eighty percent of the commonly observed truck speeds. The interval between test run values must be 5 to 10 mph and have at least a 10 mph range from low to high. If the interval between each pair of values is more than 10 mph, it is expected that 4 speed groups rather than 3 will be used.
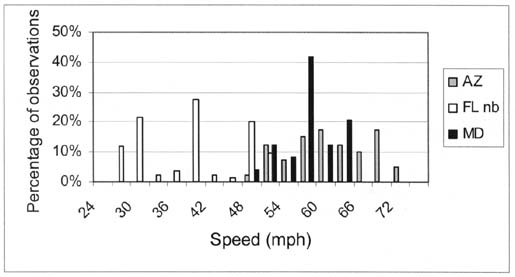
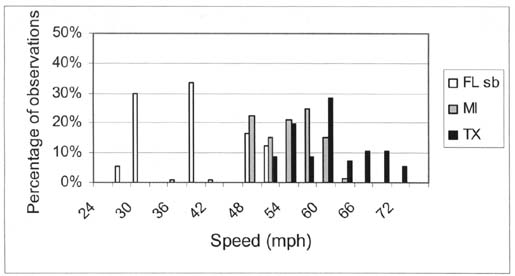
Obtaining a range of speed remains important as observed in Figure 3-7 where variability in error increases with speed.
Confirmation of equipment readiness comes from the state. Prior to the site visit, information on typical speed distributions and classification information is needed from the state. For the pilots this information was not formally obtained. For future visits getting this data in advance is necessary. Additionally information on the exact location of working sensors where more than one set of sensors is in the roadway and the location of items like pull boxes would reduce the time spent on site.
It is expected that the equipment to be tested is operational. In the case of site evaluations following acceptance testing on replacement or new construction, the interval between acceptance and evaluations should be short enough that equipment could be presumed working. There is an acceptance test under the pooled fund study guidelines that newly installed equipment run for 15 consecutive days with less than 3 hours of down time.
Semi-annual preventive maintenance at the sites such as flushing drains, checking pull boxes and connections and wear in sensors or pavement deformation would contribute significantly to operational readiness and knowledge about working conditions.
Data validation, equipment diagnostics and calibration checks performed in the office at least monthly will provide an early indicator of problems.
Each WIM system tested should be calibrated prior to the verification tests. Here should is the operative word. The assumption is that a calibration occurred in conjunction with the installation or system upgrade. For systems that require temperature adjustments to their calibration factors, a complete set of (calibrated) temperature adjustments should be in-place prior to the start of verification testing and/or the start of data collection for LTPP purposes. As a point of fact for all site evaluation cases a quick calibration check was done and calibration was performed before conducting the evaluation. Many sites had either never been calibrated or no record of the last calibration was available.
When doing a site evaluation, the first and possibly only LTPP visit to the site, provision must be made for calibrating the site. The preferred calibration practice for existing sites is to do a complete set of runs as for a validation, calibrate and then run the formal validation series. The initial validation series is necessary to provide a measure of the quality of the already collected WIM data. If the manufacturer has an alternative method, that can be used. In the case of continuing validations, running the full series before adjustment is required because there will be no other record (Sheet 16) as to exactly how the data drifted since the last validation visit. Whether or not a calibration is required at a site, a few runs at varying speeds with both trucks should be done to check the need for calibration before starting validation. Such a practice will identify immediately schedule and resource changes needed.
When sites must be calibrated a quick check after the calibration occurs should be done to verify the corrections.
The current field manual states that validation checks should be done with auto-calibration on or off according to actual data collection practice. It has been suggested that evaluation of piezo sensors should be done with auto-cal off. This does not replicate operating conditions and does not allow all systems to employ temperature correction surrogates they may use. While doing validations with auto-cal off provides a better representation of the equipment's function, it will not necessarily reflect the characteristics of the data provided over the monitoring period.
The vehicle classification algorithm to be used at each LTPP test site should be supplied by the SHA responsible for the operation of the roadway at that site. The expectation is that highway agencies have done all of the work in their equipment acceptance testing and site installation to verify the algorithms embedded in the equipment and their suitability to the site. Typically, the state of the practice is to have performed a complete multi-hour test and evaluation of that classification algorithm to ensure that it accurately classifies trucks at that site. However, the results of these pilots raise questions about the level of accuracy of the classification at the sites visited. It appears to indicate that on-site verification of the classification algorithm should have a higher level of emphasis than currently in the guidelines.
The current on-site test is not designed to fully test the algorithm. Instead, it is designed to ensure that the installed equipment is functioning correctly and that no mistakes have been made in the installation of a previously approved algorithm on that particular set of data collection electronics. The field test involves manually classifying vehicles crossing the WIM scale and comparing those classifications with the scale output.
The classifier is considered to be working acceptably when:
At those sites where a crude classification test was done, error rates were seven and a half percent or higher. This highlights a problem the data collection staff did not expect to encounter, potentially poor quality in the classification data currently provided to the LTPP program. In an ESAL based design methodology this may have less of an impact than in a method that depends on axle groups by vehicle class.
It was determined when doing the first site that it was not sufficient to merely check classification of random trucks. At that site a number of pickups hauling trailers were classified as tractor-trailers. At another site the data collection crew was surprised by the fact that a 6-bin rather than a 13-bin scheme was used. No on-site staff had a copy of the correspondence or the 6-bin scheme thus no classification verification could be done.
As a result of the experience with classification checks, the existing procedures do not appear sufficient to verify that accurate classification is occurring. A measure and a method to check each site on the initial visit should be developed.
Two types of failure possibilities were considered for smoothness: short wavelength and long wavelength. The ASTM E-1318 smoothness standard was considered and rejected as the LTPP criterion for short wavelength evaluation. The use of the sweep approach, the 20 foot straight edge and the need for lane closure all led to developing a less intrusive and time consuming standard. The FHWA LTPP team minimizes the number of lane closures due to their impact on the travelling public and the constraints on state resources. As a result a high speed profiler alternative was developed for site evaluation and validation use. The proposed alternative collected 25mm profile and then used software to simulate a straightedge and a disk. For site construction acceptance a variant of the ASTM straightedge and disk method was proposed using a 12 foot straight edge and fixed wheel path and transverse locations was proposed.
For long wavelength analysis a vehicle simulation process is being used to generate data sets. The outcome of that process is to be an index that qualitatively describes the likelihood that a 3S2 vehicle passing over a calibrated system will meet the weight criteria.
In developing the two methods (profiler and straightedge) it was assumed that they would produce the same or correlated answers. In fact they do not and one of the questions to be resolved is how to reconcile the results of two different methods designed to qualitatively evaluate the same thing.
All sites evaluated to date fail the all or nothing criterion, even those which meet the weight criteria. The question then arises, how rough is too rough or at what point is a failure reflected in variability with speed.
The Class I profiler alternative requires operators and equipment that comply with LTPP profiling protocols. The equipment is expected to record data at 25 mm intervals while travelling 80 kmph. Software was developed to simulate a 3.65 m (12 foot) straightedge and a 150 mm in diameter, 3 mm thick disk (6 inches in diameter and one-eighth inch thick) being moved along the wheel paths. Locations where the "disk" could be slipped under the straightedge were considered failures.
The construction acceptance method involves an actual 3.65 m straightedge placed at overlapping offsets along both wheel paths and at selected transverse locations and a 150 mm in diameter, 3 mm thick disk to slide under it. The same failure criterion was used; being able to freely pass the disk under the straightedge constitutes a failure point.
Side by side tests of the profiler software and the actual straightedge were conducted in Arizona, Texas and at a pair of LTPP locations in Illinois where traffic control was already available. Initial attempts to match profiler and straightedge evaluations at 90 percent or better have failed. In the best case the percentage of matches is only 60 percent. It has been shown that the straightedge and the high-speed profiler cannot be considered interchangeable (Short Wavelength Pavement Smoothness Testing at Pilot Project Locations, Draft, December 2001.) and the two tests may not be considered interchangeable for future evaluations. One factor in the difference is more placement locations in the software than in the field. Modifying the software for that circumstance does not however improve the comparisons. A second is the properties of the actual straightedge. The straightedge must be between 19 and 75 mm wide in the measurement plane with a maximum out-of-trueness of less than ±0.40 mm/m at the bottom surface in both dimensions. Along the entire length of the straightedge the potential difference can be as much as a third of the thickness of the disk. It is possible to construct such a straightedge and to get a disk that isn't warped in the cutting process. Varying the size of the virtual disk has not provided a means to improve the correlation between the methods.
The all or nothing criterion using an actual straight edge for construction is likely to be retained despite its lower sensitivity to roughness. At the AZ site it only identified a tenth of the locations the profiler did. However for new pavements, with traffic control in place for possible grinding, running a profiler is likely to be a complicated process. For profiler results, the far more commonly used measure, some boundary conditions will have to be established for desirable, acceptable, and unacceptable. It may be possible to establish them without collecting significant amounts of additional field data by using the methods of the long wavelength study.
Table 3-4 shows two possible measures of failure using the current divotometer software. The first is the average number of failures or divots per profiler pass. The other is the number of failures that are found in all profiler passes along a given path. The break point for expected failure due to speed, the smoothness surrogate, falls somewhere between the Maryland and Michigan conditions.
| State/ Sensor Type | AZ/ bending plate | FL/ n.b. piezo | FL/ s.b. piezo | FL/ n.b. bending plate | FL/ s.b. bending plate | MD/ piezo | MI/ bending plate | TX/ bending plate |
|---|---|---|---|---|---|---|---|---|
| Average divots | 220.8 | 8.3 | 9.3 | 8.3 | 9.3 | 31.4 | 119 | 24.4 |
| Replicate divots | 152 | 5 | 4 | 5 | 4 | 22 | 90 | 11 |
| Weight result | FAIL | FAIL | FAIL | PASS | PASS | FAIL | FAIL | PASS |
| Failure reason | Speed | Temp. | Too variable | -- | -- | Temp. | Speed | -- |
| Pavement | mixed | AC | AC | AC | AC | AC | PCC | AC |
The recommendation of a criterion and its comparison against actual field results is due after completion of this summary in early Spring 2002.
The field procedures as initially designed assumed a single day activity with a 4-person crew on site including the drivers. Actual site evaluations including travel time, and provision for delays have become 5-day activities including travel, training of new crew at each site, loading and weighing trucks, calibration and the actual data collection. Staffing as currently organized is a minimum of two drivers, a WIM equipment operator, a data collector for weights, a collector of speeds and temperatures and an odd jobs person. Neither the duration nor the staff sizes are likely to be significantly reduced for future site evaluations without the changes suggested in this section. It is clear that for the semi-annual evaluations that are part of the routine monitoring requirement a major effort must be made to reduce the resource requirements.
One of the most time consuming parts of each visit is the coordination between the parties involved. Identifying the interested parties and principal points of contact is crucial to efficiently conducting evaluations. A combination of detailed communication, advance planning, training and identification of Go/No Go conditions is needed for every successful visit. Coordination must occur in advance as well as on-site and be responsive to unexpected conditions.
It is suggested that a new activity, a site visit prior to the initial evaluation, be added to reduce the amount of time spent on site and to gather information that could indicate that scheduling a visit is inappropriate. Among the useful information would be classification algorithms and speed distributions for the site. This would also provide the opportunity to brief agency personnel on field activities and expectations early on for familiarity with LTPP practices.
It is important that someone knowledgeable as to the WIM system controller type and its operation be on-site during pre-validation calibration.
There are currently two elements to schedule, the visit itself and on-site activities with a third recommended, the pre-site visit. Given the lead times on trucks and travel site evaluations and validations should be scheduled no less than thirty days prior to their occurrence. The suggested initial pre-validation visit and associated coordination should occur at least six and preferably eight weeks prior to a proposed evaluation so that any minor deficiencies can be corrected.
The schedule of on-site activities for a site evaluation needs to allow for at least a day and a half to include loading and weighing trucks, briefing all on-site staff, training time particularly for drivers, collect the data and make provision for a range of temperatures. If a straightedge evaluation is done, another half day needs to be included. This time can be reduced by using the same trucks and drivers at multiple sites, briefing state personnel at the pre-site visit and checking speeds and classification for gross errors at the pre-site visit. In the current air travel environment it is unlikely that the two days per site of travel time will be significantly reduced with out doing back to back evaluations. Working back to back evaluations to include weekends is not a satisfactory solution unless travel is shifted to weekends. The difficulty in getting state personnel for weekend work and the hours of service rules for drivers will act as constraints.
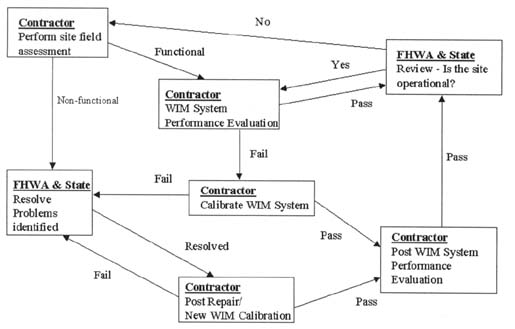
As shown in Figure 4-1 the process of site evaluation and validation is iterative.
For the sites done to date, two trucks were generally sufficient to do all data collection in a single day. Longer turn around routes will need more trucks if the cost estimating assumption of a day on site is to remain valid.
The site by site process of acquiring trucks, finding loads and hiring drivers was very time consuming. The strong support of all the states involved in the pilots in either providing all vehicles, loads and drivers or facilitating the process with local contacts and knowledge simplified the validation process. However, to put the evaluation and validation process into cost efficient production will require longer term contracts for drivers, trucks and loads. The two to three man-days of effort required for site specific truck acquisition exceed the estimated level of administrative effort per site.
Training of drivers is an essential part of collecting quality data. There are two aspects where this is essential, static weighing and speed differentiation during data collection. Problems have been observed when drivers fail to release their brakes on the scales. This leads to more repetitions of the weighing process to get consistent values. The second aspect is driving a constant target speed so bins are clear and not intermingled. Driving safely will always take priority over the research objectives. As shown in Figure 5-1 through Figure 5-5 not all drivers were able to consistently differentiate speeds. In part, a wider range of speeds needed and less traffic interference facilitated these efforts. These results support the recommendations for the target ranges and bin sizes. Additionally, the practice of running at the highest target speed first then the middle and finally the low should be continued. The failure to do so for one site led to the analysis using two temperature bins instead of three. Pavement temperature changed faster than speeds could be changed given the length of the turnarounds at most sites.
As originally envisioned the data collection staff was composed solely of LTPP contractors. Experience has shown that this is not prudent. Furthermore the staff size on which the cost estimates were based could be achieved with some modest changes in data collection activities.
Data collection includes successfully using on-site equipment. In five site visits, six separate installations have been encountered (Florida had two). Bringing outside staff up to date on every system is a poor use of limited contract resources. None of the equipment is owned by LTPP and to date all of it has required some level of calibration. The calibration of state equipment, the actual turning of the dials, by LTPP contractors will require making non-LTPP users aware that they are responsible for how the resulting data is interpreted and used. The preferred scenario is having state resources on site to access the equipment, down load data for the session and perform any necessary calibration adjustments. Having agency representation on site has the added benefit of eliminating the need for LTPP contractors to keep track of, own and learn multiple versions of software.
Part of the data collection process involves static weighing of trucks. With experienced personnel this only requires one individual other than the drivers.
The weight data collection process can be done by recording everything or simply the applicable record number. Recording everything is possible when supported by the software and when the trucks are spaced far enough a part to allow for the time to collect all the information. In some instances it is easier to platoon the trucks and just get record numbers. In either case vehicle record numbers are mandatory, as is a download of the day's records for the collection period to check for transcription errors.
The classification verification process needs to be done as a blind test. If all vehicles are done in an hour, then only one trained individual is needed. If a vehicle by vehicle comparison is desired to diagnose possible problems then two individuals are needed, one to read out record numbers and the other to manually classify the stream while recording those numbers. The two person approach is also needed where classification checking is going to be an intermittent activity. In addition a procedure is needed that more fully describes the verification of quality classification data.
The need to collect both temperature and speed data independent of the installed equipment adds another person to the data crew size. This individual is not really busy all the time but without extensive experience and a second person to support, intermittent classification activities cannot be used for much. It is suggested that once the speed reported by the equipment has been verified as reasonably accurate no speed data be collected on the test trucks themselves. Since speed is a qualitative rather than quantitative analysis variable this should not affect the results. The second recommendation to eliminate the need for this person is to install thermocouples in the pavement to record temperatures. For some equipment they are already in place. For others this is a simple activity to provide instrumentation that can be used on routine site visits. This serves two purposes and possibly three. Firstly, it removes a labor requirement. Secondly, it makes for a safer work site since personnel can be moved completely off the shoulders to the equipment box and potential behind a barrier. Thirdly, depending on the location of the installation it can provide a resolution of the observed temperature differential issue. Temperature is a qualitative analysis variable. However, in cases where temperature sensitivity is observed, knowing when it happens as a function of conditions of sensor conditions is more desirable than as a function of shoulder conditions.
Running the profiler for smoothness checking can be done with a standard LTPP crew of one including any temporary or permanent marking and all of the necessary runs. When a straightedge is used at least two people are required. They must mark the paths to be checked in addition to actually using the straightedge and disk. Since one person is needed to place the disk and straight edge, a second individual to track placements and record the data is extremely useful as well as being able to provide relief. A three person crew is optimal since it halves the time needed by a two person crew. This is important to shorten road closure time and increase the time available for test runs.
To date all profiling has been done in conjunction with a site visit. In the case of one site where trucks visibly bounced and the WIM section had obvious distresses a pre-visit profiling could have eliminated this site as a possible pilot. To eliminate further site visits where smoothness is clearly going affect results, profiling should be done before the first evaluation. It is not necessary to profile during an evaluation unless the results are expected to change significantly due to temperature or interim maintenance activities.
Due to the resource requirements a more formal system of Go/ No Go decision making should be employed. For pilots this has been willingness by the states to provide a site. For production work the decision must be based on equipment and site conditions, and staff availability. Go/ No Go decisions are made at two points, initial scheduling and on-site. For initial scheduling to occur the following is recommended:
On-site Go/No go decisions should be limited to ones based on unexpected equipment failure, weather or safety which cannot be addressed during any slack in the schedule.
As more pilot studies were done the reporting evolved. Even though pilots are expected to be in some sense unique, the time involved in analyses was substantial and could not be performed in the field. The ability to both facilitate the process and account for the vagaries encountered at each site would significantly improve response and taking corrective action. Where the current field manual suggests that a site meeting the criteria needs only a memo to that effect, indications are that a complete document of the analysis is preferred for all sites. It is suggested that such a report contain the following information:
If the site fails to meet the criterion the recommendation should be bending plate in smooth PCC unless viable corrective actions exist or the site is going out of study within 18 months. If the site fails due to smoothness grinding may be an option but whether that or new PCC is the selected solution, reinstallation of sensors can be expected.
The current divotometer software for short wave smoothness evaluation can be applied in the field. What is needed is better summary reporting for the actual criterion that is adopted as a result of the smoothness investigation. Currently the only thing reported is the number of divots in each pass by pass. A summary across multiple passes would be useful.
While the standard spreadsheet template format that evolved works well, a more automated process would be desirable. At a minimum the spreadsheet format should be standardized to encompass all the reasonable variations in input and have templates for all basic graphs in place. At the upper end a piece of software capable of taking text output from the equipment and producing a general report on site would be the goal. In either case, for future evaluations reporting at the conclusion of the visit should be the goal.
In spite of the difficulties in getting the desired 3x3 relatively even distribution of speed and temperature combinations the requirement should not be dropped. As the FL evaluation showed, it is possible to achieve the necessary points. For the initial or a single site evaluation the widest possible range and relatively even distribution between groups should continue to be the goal, principally for use in diagnostics of failing sites. For sites on a twice yearly verification schedule three speeds and 2 temperatures may be more rational as an outcome of time constraints. For sites on a biannual verification schedule picking the hottest and coldest months for the year will give at least 3 groups in the course of the year and under optimal conditions might yield 5 or even 6.
Figure 5-1 through Figure 5-5 show the various speed and pavement temperature distributions actually experienced. As can be seen in the figures, getting tight groups for speeds is not a given. The skill and training of the drivers as well as the traffic and roadway conditions contribute to the precision of the speeds.
The pilot studies were successful in demonstrating the availability of a practical truck weight data validation procedure and the reasonableness of the standard defined for research quality data. The following conclusions have been drawn from those activities:
An additional issue centers around a element which is difficult to test empirically, the desired length of slab. At the PCC sites tested the 500 foot length which was based on Figure 6-1 was found to be reasonable minimum. Consideration should be given to making the 500 foot slab a minimum rather than the fixed length specification.
The section provides the overall summaries for each of the pilot studies done.
This initial analysis is based on test runs conducted during the evening of October 31 and the morning of November 1, 2001 at test site 040600 on I 40 west of Flagstaff, AZ. This SPS-6 site is at milepost 202 on the eastbound, right hand lane of a divided four-lane facility. The traffic monitoring equipment at this location includes inductance loops and bending plates on all lanes. These sensors are installed within a PCC pavement about 500ft in length. The roadway outside this short section is asphalt. Immediately prior to the test runs, the bending plate and inductance loops on the LTPP lane were replaced and calibrated. No auto-calibration was used during test runs. The two trucks used for initial calibration and for the subsequent testing included:
Both five-axle units were equipped with air suspensions on tractor and trailer. The low-bed trailer on truck #1 had a standard tandem axle group with an additional lift axle that was in the raised position.
There are two attributes of this site that make it less than ideally suited for WIM. First, the location is near the top of a grade of about one mile that made it difficult for the test trucks to achieve the speeds at which the majority of the truck traffic was operating (70 mph). The site itself is on a positive grade of approximately 2%. Secondly, the AC/PCC interface located about 400 feet prior to the bending plate is not smooth and produced very pronounced suspension movements in both test trucks. Although the suspension movement was largely damped by the time the trucks reached the bending plates, there were cyclical movements of the trailer platforms themselves that occurred independent of the suspension and these continued beyond the scale location. Unfortunately both trailers were loaded such that the mass was concentrated midway between the two axle groups. This caused the steel trailer deck to act as a spring whenever the road surface was less than smooth and undoubtedly had an effect on the forces recorded by the bending plates.
Each truck made a total of 20 passes over the WIM scale at speeds ranging from approximately 50 to 70 miles per hour. Pavement surface temperatures were recorded during the test runs ranging from about 35 to 52 degrees Fahrenheit. The narrow range of temperatures was the result of testing only during the evening and early morning hours necessitated by a delay in the installation and calibration of a new bending plate within the LTPP lane. The computed values of 95% confidence limits of each statistic for the total population are within Table 7-1.
| Characteristic | Tolerance | Computed 95% Confidence Interval | Pass/Fail |
|---|---|---|---|
| Axle Weights: Steering | ±20 % | -0.32% ±11.02% | PASS |
| Axle Weights: Tandem | ±15 % | 5.21% ±14.24% | FAIL |
| Gross Vehicle Weights | ±10 % | 4.49% ±7.41% | FAIL |
| Axle Spacing: Between Groups | ±0.5 ft | 0.74 ft ±1.18 ft | FAIL |
| Axle Spacing: Within Groups | ±0.5 ft | 0.16 ft ±0.45 ft | FAIL |
This analysis is based on test runs conducted during the afternoon of November 7 and the morning of November 8, 2001 at a WIM site on US 319 south of Tallahassee, FL. This location, which is not part of any LTPP experiment, is on an undivided two-lane facility. It is near a major intersection and is subject to congestion as well as stop-and-go traffic during morning and afternoon rush hours. The posted limit is 55 mph and normal traffic speeds range from 30 to 55 miles per hour. The traffic monitoring equipment includes inductance loops/piezo sensors as well as inductance loops/bending plate installations on both the northbound and southbound lanes. These sensors are installed within an AC pavement. The two trucks used for this calibration and for the subsequent testing included:
Both five-axle units were equipped with air suspensions on tractor and trailer. The lighter box van trailer on truck #1 was evenly loaded across both tandem axle groups while the heavier truck #2 was loaded with a bias toward the rear tandem group.
For this comparison test, each truck made a total of 40 plus passes over each of the four WIM scales (piezo & bending plate -- both directions) at speeds ranging from approximately 30 to 50 miles per hour. Pavement surface temperatures were recorded during the test runs ranging from about 40 to 100 degrees Fahrenheit. This range of temperatures was achieved by testing during the afternoon of Nov. 7 and again in the early morning hours of the following day. Heavy traffic necessitated that testing be stopped at 7:00am on Nov. 8 and resumed again at 9:00am. The computed values of 95% confidence limits of each statistic for the total population on the four scales are recorded in Table 7-2 and Table 7-3.
A WIM site evaluation study was conducted at the SPS-5 site on US 15 near Frederick, Maryland on June 12 and 13, 2001. This location is on a two-lane roadway between two unsignalized intersections on a slight, but long continuous upgrade. Neither intersection affected site operations. The posted speed for this site is 55 mph. Actual running speeds range from 45 to slightly over 60 mph. This site has a system with a pair of piezo sensors without direct temperature compensation and a pair of inductance loops installed in asphalt. The sensors were installed in late 2000 and had never been calibrated. . The previous sensors were also piezo and still visible in the pavement. Only one piezo sensor was used to capture weight data. The original sensors at the site were bending plate that had never produced satisfactory results. The two trucks used for site calibration and validation included:
One truck had air suspension tandems on the tractor and trailer. The other had an air suspension tandem on the tractor and a steel spring suspension spread tandem on the trailer. The spread tandem was moved to its minimum spacing.
The WIM system was calibrated on June 12th as part of this site visit with three runs in each direction of a Class 9 (3S2) truck loaded to 78,100 pounds. The first run was used to adjust the calibration and the next two runs were used to confirm the correction was appropriate. Since the piezo sensors are temperature sensitive, this site's WIM equipment uses the front axle of Class 2 vehicles for automatic calibration. Class 2 vehicles are used since the site does not have enough Class 9 vehicles to recalibrate often enough to handle the temperature variations. Still the number of Class 2 vehicles was reduced from 100 to 30, then 20 and finally 10 during data collection to force the auto-calibration to take effect more often. This was an attempt to keep the WIM system calibrated to known truck weights during the hot part of the day. The results of the pilot are shown in Table 7-4.
The site evaluation for the SPS-1 north of Lansing, Michigan was conducted July 25 and 26, 2001. This site was visibly rough as vehicles were observed to bounce approaching the scale. The initial analysis was based on 80 runs split between three trucks:
There were several truck breakdowns in the course of the testing and as a result the preferred vehicle completed a minority of the runs. The impact of site roughness and vehicle dynamics resulted in two analyses, one with all three trucks and one where the bucket truck was omitted. Of all the runs, nineteen percent of the runs were made by the Class 9 (5-axle tractor-trailer), half were made by the bucket truck and the remainder by the dump truck. The total population statistics in comparison with the LTPP WIM tolerances are shown in Table 7-5. Table 7-6 shows the results after omitting the bucket truck.
This analysis is based on a full day of test runs conducted on October 17, 2001 at test site 480100 on US 281 north of Edinburg, TX. This SPS-1 site is on the southbound, right hand lane of a divided four-lane facility. The equipment is a bending plate installed in asphalt. The trucks used included:
Both five-axle units were equipped with air suspension on tractor and trailer while the dump truck and 6-axle semi had steel leaf springs only. This evaluation was unique in that a triple axle group was available for testing. Since no tolerance level for statistics based on such groups has been specified by LTPP, this report uses the premise of ASTM 1318 that all axle groups should meet the same qualifications. Each truck made a total of 14 passes over the WIM scale at speeds ranging from approximately 50 to 70 miles per hour. Pavement surface temperatures were recorded during the test runs ranging from about 65 to 105 degrees Fahrenheit. The computed values of 95% confidence limits of each statistic for the total population are in Table 7-7.
This section contains all of the basic information that went into the analyses discussed in this document and the pilot reports.
Test Trucks Static Measurements (lbs): Steer Static Measurements (lbs): Tandem1 Static Measurements (lbs): Tandem2 Static Measurements (lbs): Triple Static Measurements (lbs): Gross Static Spacings (ft): A-B Static Spacings (ft): B-C Static Spacings (ft): C-D Static Spacings (ft): D-E Static Spacings (ft): E-F 1 10,100 29,000 39,500 78,500 10.25 4.33 29.58 10.00
2 12,300 29,700 45,100 87,100 13.71 4.42 28.25 4.13 4.00
3 8,300 23,000 24,200 55,600 11.2 4.2 31.6 4.0
4 12,500 38,300 50,700 14.7 4.4
| Truck # | Time | Temp #1 | Temp #2 | Mean Temp | Speed | WIM Weights (lbs): Steer | WIM Weights (lbs): Tandem1 | WIM Weights (lbs): Tandem2 | WIM Weights (lbs): Triple | WIM Weights (lbs): Gross | WIM Spacings (ft): A-B | WIM Spacings (ft): B-C | WIM Spacings (ft): C-D | WIM Spacings (ft): D-E | WIM Spacings (ft): E-F |
|---|---|---|---|---|---|---|---|---|---|---|---|---|---|---|---|
| 1 | 9:57 | 68 | 61 | 64.5 | 52 | 10,200 | 29,200 | 40,700 | 80,100 | 11.2 | 4.4 | 30.0 | 10.1 | ||
| 1 | 10:07 | 72 | 66 | 69.0 | 59 | 10,100 | 29,500 | 40,000 | 79,500 | 11.1 | 4.3 | 29.7 | 10.2 | ||
| 1 | 10:20 | 71 | 69 | 70.0 | 65 | 10,900 | 29,100 | 39,700 | 79,700 | 10.9 | 4.4 | 29.4 | 10.2 | ||
| 1 | 10:30 | 73 | 68 | 70.5 | 51 | 10,600 | 29,400 | 39,600 | 79,700 | 10.8 | 4.6 | 29.3 | 10.2 | ||
| 1 | 10:43 | 75 | 73 | 74.0 | 57 | 9,900 | 29,400 | 40,100 | 79,400 | 11.0 | 4.2 | 29.5 | 9.8 | ||
| 1 | 10:58 | 73 | 70 | 71.5 | 65 | 10,700 | 29,900 | 38,800 | 79,400 | 10.9 | 4.4 | 29.4 | 9.9 | ||
| 1 | 11:08 | 80 | 76 | 78.0 | 52 | 10,300 | 29,700 | 40,600 | 80,600 | 11.2 | 4.4 | 30.0 | 10.1 | ||
| 1 | 11:17 | 80 | 76 | 78.0 | 58 | 9,900 | 29,300 | 40,200 | 79,400 | 10.9 | 4.6 | 29.4 | 10.3 | ||
| 1 | 13:53 | 97 | 89 | 93.0 | 52 | 10,000 | 29,100 | 39,300 | 78,400 | 10.9 | 4.4 | 29.8 | 9.8 | ||
| 1 | 14:03 | 99 | 95 | 97.0 | 60 | 9,600 | 28,200 | 39,000 | 76,700 | 11.0 | 4.4 | 30.0 | 10.4 | ||
| 1 | 14:16 | 99 | 100 | 99.5 | 65 | 10,000 | 29,200 | 39,900 | 79,100 | 10.9 | 4.1 | 29.7 | 9.9 | ||
| 1 | 14:26 | 104 | 101 | 102.5 | 51 | 10,500 | 29,400 | 39,400 | 79,200 | 11.0 | 4.3 | 29.6 | 10.2 | ||
| 1 | 14:35 | 105 | 103 | 104.0 | 59 | 9,600 | 28,800 | 39,600 | 78,000 | 10.8 | 4.3 | 29.7 | 9.9 | ||
| 1 | 14:48 | 105 | 104 | 104.5 | 67 | 10,100 | 29,000 | 39,500 | 78,500 | 11.2 | 4.5 | 30.0 | 10.5 | ||
| 2 | 9:57 | 68 | 61 | 64.5 | 53 | 12,300 | 29,700 | 45,100 | 87,100 | 13.6 | 4.4 | 28.3 | 3.9 | 4.2 | |
| 2 | 10:06 | 72 | 66 | 69.0 | 60 | 12,100 | 27,800 | 45,400 | 85,400 | 13.5 | 4.4 | 28.4 | 4.1 | 3.8 | |
| 2 | 10:19 | 71 | 69 | 70.0 | 70 | 12,100 | 26,500 | 48,400 | 87,000 | 13.8 | 4.7 | 29.1 | 4.0 | 4.4 | |
| 2 | 10:29 | 73 | 68 | 70.5 | 55 | 12,500 | 29,500 | 44,300 | 86,200 | 14.1 | 4.3 | 29.0 | 4.0 | 4.0 | |
| 2 | 10:43 | 75 | 73 | 74.0 | 60 | 11,900 | 27,500 | 44,000 | 83,600 | 13.5 | 4.4 | 28.1 | 4.1 | 4.1 | |
| 2 | 10:58 | 73 | 70 | 71.5 | 68 | 12,200 | 26,300 | 48,000 | 86,600 | 13.9 | 4.3 | 28.5 | 3.9 | 4.3 | |
| 2 | 11:07 | 80 | 76 | 78.0 | 52 | 12,000 | 30,100 | 47,000 | 89,200 | 13.9 | 4.4 | 28.4 | 3.8 | 4.1 | |
| 2 | 11:17 | 80 | 76 | 78.0 | 60 | 12,000 | 27,700 | 45,700 | 85,300 | 13.5 | 4.4 | 28.1 | 3.8 | 4.1 | |
| 2 | 13:52 | 97 | 89 | 93.0 | 51 | 12,200 | 29,700 | 46,100 | 87,900 | 13.4 | 4.3 | 27.7 | 3.8 | 4.0 | |
| 2 | 14:02 | 99 | 95 | 97.0 | 61 | 11,700 | 26,400 | 45,300 | 82,500 | 14.1 | 4.5 | 28.6 | 4.2 | 4.2 | |
| 2 | 14:15 | 99 | 100 | 99.5 | 67 | 12,100 | 26,600 | 47,300 | 85,900 | 13.3 | 4.2 | 27.5 | 4.2 | 3.8 | |
| 2 | 14:25 | 104 | 101 | 102.5 | 55 | 12,300 | 29,000 | 43,900 | 85,100 | 14.1 | 4.3 | 28.8 | 4.3 | 4.0 | |
| 2 | 14:35 | 105 | 103 | 104.0 | 60 | 12,200 | 26,600 | 45,100 | 83,800 | 13.5 | 4.4 | 27.7 | 4.1 | 4.1 | |
| 2 | 14:48 | 105 | 104 | 104.5 | 70 | 11,700 | 26,100 | 45,600 | 83,400 | 13.8 | 4.4 | 28.4 | 4.0 | 4.0 | |
| 3 | 9:57 | 68 | 61 | 64.5 | 51 | 9,600 | 24,800 | 23,200 | 57,600 | 11.1 | 4.2 | 31.5 | 4.0 | ||
| 3 | 10:06 | 72 | 66 | 69.0 | 59 | 8,900 | 24,900 | 23,500 | 57,200 | 11.3 | 4.3 | 32.3 | 4.0 | ||
| 3 | 10:19 | 71 | 69 | 70.0 | 68 | 9,600 | 23,400 | 23,800 | 56,800 | 11.4 | 4.3 | 32.4 | 3.9 | ||
| 3 | 10:29 | 73 | 68 | 70.5 | 55 | 9,500 | 25,400 | 25,100 | 60,000 | 11.5 | 4.3 | 32.6 | 4.2 | ||
| 3 | 10:43 | 75 | 73 | 74.0 | 59 | 9,200 | 24,400 | 23,800 | 57,500 | 11.2 | 4.5 | 32.3 | 4.0 | ||
| 3 | 10:58 | 73 | 70 | 71.5 | 68 | 9,100 | 23,600 | 24,500 | 57,200 | 11.2 | 4.3 | 32.4 | 3.9 | ||
| 3 | 11:07 | 80 | 76 | 78.0 | 49 | 9,300 | 24,800 | 22,800 | 56,800 | 10.8 | 4.2 | 30.7 | 4.0 | ||
| 3 | 11:17 | 80 | 76 | 78.0 | 60 | 9,300 | 24,500 | 24,600 | 58,500 | 11.2 | 4.4 | 32.3 | 4.1 | ||
| 3 | 13:52 | 97 | 89 | 93.0 | 53 | 9,100 | 24,200 | 22,400 | 55,900 | 11.5 | 4.4 | 33.1 | 4.2 | ||
| 3 | 14:02 | 99 | 95 | 97.0 | 58 | 8,600 | 23,300 | 23,100 | 55,000 | 11.1 | 4.2 | 31.9 | 4.0 | ||
| 3 | 14:15 | 99 | 100 | 99.5 | 71 | 9,000 | 23,500 | 22,600 | 55,100 | 11.6 | 4.5 | 33.5 | 4.1 | ||
| 3 | 14:25 | 104 | 101 | 102.5 | 53 | 9,000 | 24,400 | 23,900 | 57,400 | 11.4 | 4.4 | 32.5 | 4.2 | ||
| 3 | 14:35 | 105 | 103 | 104.0 | 59 | 8,800 | 22,800 | 23,000 | 54,600 | 11.4 | 4.3 | 32.2 | 4.0 | ||
| 3 | 14:48 | 105 | 104 | 104.5 | 67 | 8,300 | 23,000 | 24,200 | 55,600 | 11.2 | 4.2 | 31.6 | 4.0 | ||
| 4 | 9:57 | 68 | 61 | 64.5 | 53 | 12,500 | 38,300 | 50,700 | 14.7 | 4.4 | |||||
| 4 | 10:06 | 72 | 66 | 69.0 | 60 | 12,100 | 33,100 | 45,200 | 14.8 | 4.4 | |||||
| 4 | 10:19 | 71 | 69 | 70.0 | 64 | 11,700 | 33,200 | 44,900 | 15.1 | 4.3 | |||||
| 4 | 10:29 | 73 | 68 | 70.5 | 53 | 12,300 | 38,100 | 50,400 | 14.4 | 4.2 | |||||
| 4 | 10:43 | 75 | 73 | 74.0 | 58 | 12,200 | 35,500 | 47,700 | 15.5 | 4.6 | |||||
| 4 | 10:58 | 73 | 70 | 71.5 | 64 | 12,300 | 33,200 | 45,500 | 15.4 | 4.7 | |||||
| 4 | 11:08 | 80 | 76 | 78.0 | 52 | 12,300 | 38,500 | 50,900 | 14.8 | 4.4 | |||||
| 4 | 11:17 | 80 | 76 | 78.0 | 58 | 12,300 | 35,100 | 47,300 | 14.6 | 4.3 | |||||
| 4 | 13:53 | 97 | 89 | 93.0 | 55 | 11,900 | 36,400 | 48,300 | 14.9 | 4.3 | |||||
| 4 | 14:02 | 99 | 95 | 97.0 | 63 | 12,000 | 32,200 | 44,200 | 15.1 | 4.6 | |||||
| 4 | 14:16 | 99 | 100 | 99.5 | 63 | 11,800 | 35,300 | 47,100 | 15.1 | 4.3 | |||||
| 4 | 14:26 | 104 | 101 | 102.5 | 54 | 11,800 | 36,400 | 48,200 | 15.0 | 4.5 | |||||
| 4 | 14:35 | 105 | 103 | 104.0 | 61 | 12,200 | 32,000 | 44,200 | 14.8 | 4.5 | |||||
| 4 | 14:48 | 105 | 104 | 104.5 | 65 | 11,900 | 32,900 | 44,800 | 15.0 | 4.4 |

