U.S. Department of Transportation
Federal Highway Administration
1200 New Jersey Avenue, SE
Washington, DC 20590
202-366-4000
Federal Highway Administration Research and Technology
Coordinating, Developing, and Delivering Highway Transportation Innovations
 |
| This report is an archived publication and may contain dated technical, contact, and link information |
|
Publication Number: FHWA-RD-02-083 Date: August 2006 |
Previous | Table of Contents | Next
A summary of climatic exposure conditions for the Ohio sections is given in table 7. These sections were subjected to severe winter freezing and thawing temperatures. The number of air freeze-thaw cycles is about 110 per year (less than Minnesota, with about 160 per year).
The purpose of this experiment was to investigate the effect of the entrained air-void system on resistance to freezing and thawing. The Ohio sections consist of 10 lane-width 1.8-m full-depth repairs placed on State Route 2 in an old D-cracked jointed concrete pavement. Six different early-strength mixtures (designated PC, RSC, HES, VES, FT, and ODOT) were placed to determine whether these mixtures had different resistance to freezing and thawing than conventional mixtures. One of the mixtures was placed in six replicates (standard mixture, with replicates I1 through I5 having different air contents than the standard ODOT mixture) with varying air contents to examine the effects of air-void parameters on frost resistance.
These sections were placed during the summer of 1992 and were first monitored for evidence of deterioration from freezing and thawing in November of 1994. The sections were part of the trafficked pavement, and de-icing salt was applied when necessary. Snow was removed from the sections as a part of normal highway maintenance. However, the test section in Ohio was diamond-ground between construction in 1992 and the first monitoring visit in 1994. This removed the original surface texture, making the quantification of scaling almost impossible. Laboratory data from these sections are given in tables 8 and 9.
The experiment at the Ohio site also included the evaluation of the effectiveness of various types of sealers in mitigating D-cracking in the old adjacent concrete slabs. The saw-cut face of the original pavement exposed by the removal of the concrete in the repair area was cleaned and treated with four different types of sealers prior to the placement of the repair concrete for this experiment. The sealers and control joints included the following:
Twenty joint repairs were made at the Ohio site, providing 40 joint faces in the original concrete and as indicated, control joints were left with no sealer treatment.
| Month/Year | Monthly Low Temperature, °C | Days Below 0 °C | Days Below –18 °C |
|---|---|---|---|
| October 1992 | -3 | 6 | – |
| November 1992 | -7 | 10 | – |
| December 1992 | -9 | 22 | – |
| January 1993 | -13 | 26 | – |
| February 1993 | -21 | 28 | 4 |
| March 1993 | -16 | 18 | – |
| October 1993 | -1 | 2 | – |
| November 1993 | -6 | 12 | – |
| December 1993 | -18 | 21 | 1 |
| January 1994 | -28 | 30 | 8 |
| February 1994 | -20 | 25 | 1 |
| March 1994 | -10 | 22 | – |
| October 1994 | 1 | – | – |
| November 1994 | -7 | 9 | – |
| December 1994 | -10 | 20 | – |
| January 1995 | -16 | 25 | – |
| February 1995 | -18 | 25 | 1 |
| March 1995 | -13 | 17 | – |
| October 1995 | 1 | – | – |
| November 1995 | -6 | 19 | – |
| December 1995 | -16 | 29 | – |
| January 1996 | -18 | 28 | 1 |
| February 1996 | -23 | 20 | 4 |
| March 1996 | -14 | 29 | – |
| October 1996 | 0 | 1 | – |
| November 1996 | -10 | 20 | – |
| December 1996 | -13 | 20 | – |
| January 1997 | -20 | 27 | 3 |
| February 1997 | -13 | 22 | – |
| March 1997 | -8 | 22 | – |
| October 1997 | 0 | 1 | – |
| November 1997 | -8 | 14 | – |
| December 1997 | -11 | 24 | – |
| January 1998 | -11 | 23 | – |
| February 1998 | -7 | 15 | – |
| March 1998 | -8 | 20 | – |
*From Climatological Data. Cleveland, OH, National Oceanic and Atmospheric Administration, www.noaa.gov.
| Mixture | Description | Fresh Air (%) | Hardened Air (%) | Hardened Air (ent, %) | Spacing Factor (mm) | Spacing Factor (ent, mm) | Specific Surface (mm-1) | Specific Surface (ent, mm-1) | Voids/mm | Voids/mm (ent) | Avg. Ch. Length (mm) | Paste-to-Air Ratio | 28-day fc′ (MPa) |
|---|---|---|---|---|---|---|---|---|---|---|---|---|---|
| H1 | ODOT Class FS (morning) | 3.8 | 4.9 | 2.6 | 0.246 | 0.179 | 24.2 | 44.2 | 0.298 | 0.286 | 0.165 | 8.7 | 50.6 |
| H1 | ODOT Class FS (morning, 14-day) | 4.5 | 3.4 | 2.4 | 0.222 | 0.187 | 30.8 | 42.4 | 0.260 | 0.250 | 0.130 | 11.8 | Note 4 |
| H2 | ODOT Class FS (afternoon) | 6.5 | 4.7 | 2.6 | 0.350 | 0.360 | 25.2 | 43.5 | 0.296 | 0.287 | 0.159 | 9.0 | n/a |
| I1 | H1 w/0.8*A/E dosage | 7.0 | 4.1 | 2.8 | 0.157 | 0.128 | 42.1 | 61.0 | 0.431 | 0.425 | 0.095 | 11.0 | 44.6 |
| I2 | H1 w/0.6*A/E dosage | 5.6 | 4.4 | 3.0 | 0.176 | 0.147 | 36.1 | 50.6 | 0.393 | 0.386 | 0.111 | 10.1 | 50.7 |
| I3 | H1 w/0.4*A/E dosage | 6.2 | 4.1 | 2.6 | 0.470 | 0.387 | 14.0 | 20.7 | 0.143 | 0.135 | 0.286 | 10.8 | 48.3 |
| I4 | H1 w/0.2*A/E dosage | 5.8 | 5.2 | 4.5 | 0.213 | 0.200 | 27.7 | 31.3 | 0.359 | 0.355 | 0.144 | 8.5 | 50.2 |
| I5 | H1 w/0.05*A/E dosage | 3.1 | 2.7 | 1.8 | 0.382 | 0.318 | 20.2 | 28.8 | 0.138 | 0.132 | 0.198 | 15.5 | 57.7 |
Note 1: All specimens cured 28 days (including 27 days in lime water) unless noted otherwise.
Note 2: All air void measurements for 14-day cures performed at the University of Washington.
Note 3: All air void measurements for 28-day cures performed at Michigan State University.
Note 4: Compression tests not performed on day 14.
Note 5: RSC2 data obtained from contractor’s report; separate traverse not conducted for this project.
Note 6: 28-day Pyrament® #1 linear traverse data not available.
| Mix | Description | Durability Factor | Cycles to 60% RDM | Cycles to 0.1% Dilation | % Mass Loss @ 60% RDM or 300 Cycles | % Dilation @ 60% RDM or 300 Cycles | |||||
|---|---|---|---|---|---|---|---|---|---|---|---|
| Mean | Std. Dev. | Mean | Std. Dev. | Mean | Std. Dev. | Mean | Std. Dev. | Mean | Std. Dev. | ||
| H1 | ODOT Class FS (morning) | 17.2 | 1.7 | 87 | 6.2 | 72 | 2.1 | -0.72 | 0.01 | 0.179 | 0.006 |
| H1 | ODOT Class FS (morning, 14-day) | 13.0 | 0.6 | 65 | 2.9 | 62 | 8.1 | -0.86 | 0.11 | 0.127 | 0.025 |
| H2 | ODOT Class FS (afternoon) | 18.5 | 0.5 | 92 | 2.5 | 73 | 3.0 | -0.51 | 0.01 | 0.180 | 0.037 |
| I1 | H1 w/0.8*A/E dosage | 18.8 | 1.0 | 95 | 5.3 | 82 | 8.2 | -0.32 | 0.07 | 0.151 | 0.029 |
| I2 | H1 w/0.6*A/E dosage | 14.0 | 0.8 | 71 | 3.3 | 66 | 4.1 | -0.83 | 0.05 | 0.144 | 0.016 |
| I3 | H1 w/0.4*A/E dosage | 17.6 | 2.4 | 89 | 10.4 | 75 | 6.1 | -0.87 | 0.05 | 0.170 | 0.017 |
| I4 | H1 w/0.2*A/E dosage | 12.8 | 0.4 | 64 | 0.7 | 56 | 1.0 | -0.90 | 0.04 | 0.150 | 0.010 |
| I5 | H1 w/0.05*A/E dosage | 7.75 | 0.4 | 41 | 2.3 | 33 | 0.9 | -0.69 | 0.03 | 0.156 | 0.007 |
Note 1: All specimens cured 28 days unless noted otherwise.
Note 2: All frost resistance testing was accomplished in accordance with AASHTO T161 (ASTM C 666) Procedure B, except for use of cloth wraps and cure periods noted.
Note 3: All frost-resistance testing for 14-day cures performed at the University of Washington.
Note 4: All frost-resistance testing for 28-day cures performed at Michigan State University.
The Ohio sections were constructed in September 1992 and first surveyed in November 1994. As previously stated, all of these test sections were diamond-ground between 1992 and 1994, which made it impossible to observe scaling in the original surface. However, it was possible to observe the ground surface for deterioration. No evidence of surface scaling or other deterioration has been seen on the diamond-ground surface over the monitoring period.
All patches in the Ohio section developed a longitudinal crack shortly after construction (within 2 months). High temperature gradients that developed in the repairs during curing are thought to be responsible for the longitudinal cracking. One repair in the FS section also developed a transverse crack.
However, other than these cracks, in 1994 the Ohio sections were distress free. No signs of scaling or D-cracking were present on either the repair concrete or the surrounding concrete. Faulting and cracking were very low. Results from the 1994 survey are given in tables 10 and 11.
| ERES ID | Repair Type | Station | Longitudinal | Transverse | ||||||||||
|---|---|---|---|---|---|---|---|---|---|---|---|---|---|---|
| SHRP | 1994 | 1995 | 1996 | 1997 | 1998 | SHRP | 1994 | 1995 | 1996 | 1997 | 1998 | |||
| FS—3 to 8 hr | ||||||||||||||
| H-2 | FS | 152+53 | L | L | L | L | L | L | L | L | L | L | H | |
| H-3 | FS | 151+11 | L | L | L | L | L | L | ||||||
| H-4 | FS | 149+48 | L | L | L | L | L | L | ||||||
| H-5 | FS | 148+66 | L | L | L | L | L | L | ||||||
| H-6 | FS | 147+57 | L | L | L | L | L | L | ||||||
| H-7 | FS | 147+03 | L | L | L | L | L | L | ||||||
| H-8 | FS | 146+68 | L | L | L | L | L | L | ||||||
| H-9 | FS | 145+04 | L | L | L | L | L | L | ||||||
| H-10 | FS | 144+25 | L | L | L | L | L | L | L | |||||
| Percent Slabs Cracked | 100 | 100 | 100 | 100 | 100 | 100 | 0 | 11 | 11 | 11 | 11 | 22 | ||
| FS—Freeze-Thaw | ||||||||||||||
| I-1 | I-3 | 152+14 | L | L | L | L | L | L | L | L | L | L | L | |
| I-2 | I-4 | 150+76 | L | L | L | L | L | L | ||||||
| I-3 | I-5 | 150+28 | L | L | L | L | L | L | ||||||
| I-4 | I-1 | 149+97 | L | L | L | L | L | L | ||||||
| I-5 | I-5 | 149+14 | L | L | L | L | L | L | ||||||
| I-6 | I-2 | 147+82 | L | L | L | L | L | L | ||||||
| I-7 | I-3 | 147+43 | L | L | L | L | L | L | ||||||
| I-8 | I-4 | 147+17 | L | L | L | L | L | L | ||||||
| I-9 | I-2 | 145+04 | L | L | L | L | L | L | ||||||
| I-10 | I-1 | 144+64 | L | L | L | L | L | L | ||||||
| Percent Slabs Cracked | 100 | 100 | 100 | 100 | 100 | 100 | 0 | 10 | 10 | 10 | 10 | 10 | ||
| Faulting | ||||||||||||||
|---|---|---|---|---|---|---|---|---|---|---|---|---|---|---|
| ERES ID | Repair Type | Station | Approach Joint | Leave | ||||||||||
| 1994 | 1995 | 1996 | 1997 | 1998 | 1994 | 1995 | 1996 | 1997 | 1998 | |||||
| FS—3 to 8 hr | ||||||||||||||
| H-2 | FS | 152+53 | 0.01 | 0.00 | 0.01 | 0.02 | n/a | 0.06 | 0.02 | 0.05 | 0.06 | n/a | ||
| H-3 | FS | 151+11 | 0.05 | 0.03 | 0.02 | 0.03 | 0.01 | 0.11 | 0.07 | 0.10 | 0.05 | 0.07 | ||
| H-4 | FS | 149+48 | 0.04 | 0.02 | 0.04 | 0.01 | n/a | 0.06 | 0.04 | 0.03 | 0.04 | 0.00 | ||
| H-5 | FS | 148+66 | 0.04 | 0.02 | 0.01 | 0.01 | n/a | 0.00 | 0.00 | 0.01 | -0.01 | 0.00 | ||
| H-6 | FS | 147+57 | 0.02 | 0.00 | 0.00 | 0.00 | 0.03 | 0.05 | 0.00 | 0.01 | 0.02 | 0.04 | ||
| H-7 | FS | 147+03 | 0.02 | 0.00 | 0.00 | -0.01 | -0.01 | 0.00 | -0.01 | -0.01 | 0.00 | -0.01 | ||
| H-8 | FS | 146+68 | 0.01 | 0.00 | 0.02 | -0.02 | 0.10 | 0.04 | 0.03 | 0.08 | 0.07 | 0.07 | ||
| H-9 | FS | 145+04 | 0.00 | 0.02 | -0.01 | -0.02 | 0.01 | 0.04 | 0.00 | -0.01 | 0.02 | 0.00 | ||
| H-10 | FS | 144+25 | 0.05 | 0.04 | 0.03 | n/a | n/a | 0.04 | 0.03 | 0.01 | 0.02 | n/a | ||
| Average | 0.03 | 0.01 | 0.01 | 0.00 | 0.03 | 0.04 | 0.02 | 0.03 | 0.03 | 0.02 | ||||
| FS—Freeze-Thaw | ||||||||||||||
| I-1 | I-3 | 152+14 | 0.03 | -0.01 | 0.00 | 0.03 | 0.01 | 0.01 | 0.01 | 0.03 | 0.03 | -0.01 | ||
| I-2 | I-4 | 150+76 | 0.03 | 0.03 | 0.03 | 0.01 | 0.02 | 0.02 | -0.02 | -0.01 | -0.02 | -0.04 | ||
| I-3 | I-5 | 150+28 | -0.02 | 0.00 | 0.00 | 0.00 | -0.01 | 0.05 | 0.05 | 0.04 | 0.04 | 0.05 | ||
| I-4 | I-1 | 149+97 | 0.02 | 0.01 | 0.03 | -0.01 | -0.02 | 0.02 | -0.03 | -0.03 | 0.00 | 0.02 | ||
| I-5 | I-5 | 149+14 | 0.00 | 0.00 | 0.01 | 0.0 | 0.0 | 0.0 | -0.01 | 0.01 | -0.01 | 0.00 | ||
| I-6 | I-2 | 147+82 | 0.04 | 0.03 | 0.03 | 0.0 | 0.0 | 0.0 | 0.0 | 0.05 | 0.03 | 0.03 | ||
| I-7 | I-3 | 147+43 | 0.00 | -0.01 | -0.02 | -0.02 | 0.0 | -0.01 | -0.02 | -0.01 | -0.03 | n/a | ||
| I-8 | I-4 | 147+17 | 0.02 | 0.00 | 0.03 | 0.0 | 0.0 | 0.0 | -0.02 | 0.00 | -0.03 | -0.03 | ||
| I-9 | I-2 | 145+04 | 0.03 | -0.02 | -0.01 | 0.0 | 0.0 | 0.0 | -0.01 | -0.01 | 0.00 | -0.01 | ||
| I-10 | I-1 | 144+64 | 0.01 | 0.02 | -0.02 | n/a | n/a | -0.01 | -0.02 | -0.02 | -0.06 | -0.06 | ||
| Average | 0.02 | 0.01 | 0.01 | 0.00 | 0.01 | 0.01 | -0.01 | 0.0 | -0.01 | -0.01 | ||||
The Ohio sections were surveyed again in November 1995. There were no significant changes in condition from 1994. No new distresses developed, and faulting remained about the same level. Some faulting values actually decreased. The decreased faulting is most likely due to measurement variability, but moisture and temperature conditions can also affect faulting measurements. Again, no signs of scaling or D-cracking were observed.
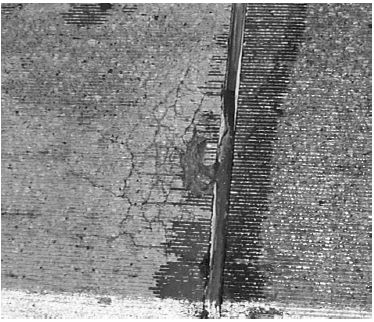
The patches were examined annually from 1994 through 1998. No additional surface defects were noted in any of the patches from 1994 through 1996. In 1997, surface map-pattern cracking was noted in varying degrees (see figure 4). The cracking was generally worse in the wheelpath near the transverse joints between the patches and the original pavement (figure 5). By 1998, the severity of the cracking had increased; some patches had been repaired with asphalt concrete where the deterioration had produced potholes.
Samples were taken from portions of the patches, and microscopic examination of the samples indicated that both cracks and air voids in the concrete were filled with ettringite.
The entrained air-void system appears to have had no effect on the deterioration of the repairs with the diamond ground surface (Stark et al., 1998, and Heinz et al., 1989).
Figure 4. Surface cracking in patch, mixture I3 (parallel lines on surface are the result of surface diamond grinding soon after construction).
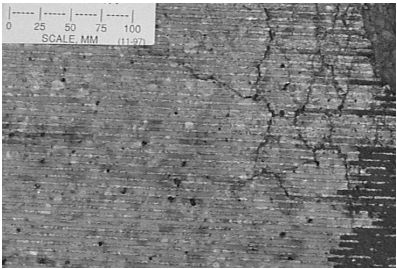
Figure 5. Deterioration in patch (left) in wheelpath, mixture I4 (surface has been diamond ground, and note longitudinal paint strip along pavement edge at bottom of photo).
Cores were taken from the Ohio test sections between 1994 and 1998 for dynamic modulus testing. The cores were dried at approximately 50-percent relative humidity and 22 °C to constant mass and were tested in accordance with ASTM C 215 to determine the dynamic modulus of elasticity. The results are summarized in table 12, along with strengths and stiffness determined as parts of the SHRP C-203 and C-206 projects.
| SHRP C-203 Designation | Strength 28-day lab, MPa | SHRP 2-month Strength | C-206 Cores, MPa Stiffness | Core Dynamic Modulus, MPa | ||||
|---|---|---|---|---|---|---|---|---|
| 1994 | 1995 | 1996 | 1997 | 1998 | ||||
| PC1 | 58.9 | 43.9 | 26,546 | – | 27,125 | – | – | 27,608 |
| PC2 | 50.5 | 55.4 | 24,822 | 29,631 | 26,876 | 26,699 | – | 25,340 |
| RSC1 | – | 41.4 | 21,030 | – | 30,968 | – | – | – |
| RSC2 | – | 38.7 | 20,685 | 29,482 | 30,834 | 33,218 | – | 24,657 |
| HES | 43.3 | 42.0 | 19,306 | – | 22,899 | – | – | 23,600 |
| VES | 37.3 | 38.6 | 26,546 | 16,937 | 18,826 | 17,832 | – | 20,131 |
| FT1 | – | 39.4 | 19,996 | – | 25,249 | – | – | 28,281 |
| ODOT | 50.6 | 51.9 | 21,719 | – | – | 18,433 | – | 21,748 |
| I1 | 44.6 | – | – | – | 20,601 | – | – | – |
| I3 | 48.3 | – | – | – | 18,217 | 21,139 | – | 27,773 |
| I4 | 50.2 | – | – | – | 20,164 | 22,160 | – | 24,907 |
| I2 | 50.7 | – | – | – | 22,281 | – | – | – |
| I5 | 57.7 | – | – | – | 22,661 | 27,647 | – | 28,925 |
With the exception of the VES and RSC2 mixtures, the core stiffnesses do not suggest any significant evidence of internal deterioration. The change in dynamic modulus of the VES section between the SHRP C-206 2-month followup coring and the 1994-98 coring indicates that this mixture may have suffered some internal deterioration, but the relatively constant stiffness from 1994-98 suggests that the deterioration is not continuing. The drop in stiffness in 1998 for the RSC2 core may not be significant, as there was no other evidence of deterioration in this section. Additional coring would be required to verify whether this drop is significant or just sampling variability.
The original Ohio pavement on which the test sections were installed was constructed with D-cracking susceptible aggregate. In an effort to determine whether the existing D-cracking could be mitigated, the D-cracked concrete near each of the joints was removed and replaced with a full-depth patch. Prior to placing the patches, the sawn faces of the existing concrete were treated with one of four sealers (or none for control) in an attempt to prevent the lateral movement of water from the transverse joint into the pavement. It was believed that this might prevent or at least delay the continuation of the D-cracking. The treatments consisted of either: (1) a penetrating oil sealer (LS), (2) a water-based silane sealer (WS), (3) a solvent-based silane sealer (SS), or 4) a two-part urethane sealer (2P). Control sections were also left with no sealer treatment (N). Table 13 summarizes the sealer treatments along with the subbase type (asphalt-treated base (ATB) or granular) and the maximum aggregate size in the existing pavement.
| Station No. | Aggregate Size | Base Type | Patch No. | Edge Treatment |
|---|---|---|---|---|
| 152+94 | 25 mm | ATB | None | |
| 152+94 | 25 mm | ATB | H-1 | SS |
| 152+53 | 25 mm | ATB | WS | |
| 152+53 | 25 mm | ATB | H-2 | LS |
| 152+14 | 25 mm | ATB | I-1 | 2P |
| 152+14 | 25 mm | ATB | (I3) | None |
| 151+11 | 25 mm | ATB | None | |
| 151+11 | 25 mm | ATB | H-3 | WS |
| 150+76 | 25 mm | ATB | I-2 | SS |
| 150+76 | 25 mm | ATB | (I4) | 2P |
| 150+28 | 19 mm | crushed | I-3 | LS |
| 150+28 | 19 mm | stone | (I5) | None |
| 149+97 | 19 mm | crushed | I-4 | SS |
| 149+97 | 19 mm | stone | (I1) | WS |
| 149+48 | 19 mm | crushed | LS | |
| 149+48 | 19 mm | stone | H-4 | 2P |
| 149+14 | 19 mm | crushed | I-5 | None |
| 149+14 | 19 mm | stone | (I5) | LS |
| 148+66 | 19 mm | crushed | 2P | |
| 148+66 | 19 mm | stone | H-5 | None |
| 147+82 | 19 mm | crushed | I-6 | WS |
| 147+82 | 12 mm | stone | (I2) | SS |
| 147+57 | 12 mm | crushed | None | |
| 147+57 | 12 mm | stone | H-6 | LS |
| 147+43 | 12 mm | crushed | I-7 | LS |
| 147+43 | 12 mm | stone | (I3) | WS |
| 147+17 | 12 mm | crushed | I-8 | None |
| 147+17 | 12 mm | stone | (I4) | None |
| 147+03 | 12 mm | crushed | WS | |
| 147+03 | 12 mm | stone | H-7 | SS |
| 146+68 | 12 mm | crushed | SS | |
| 146+68 | 12 mm | stone | H-8 | 2P |
| 145+97 | 12 mm | crushed | I-9 | 2P |
| 145+97 | 12 mm | stone | (I2) | None |
| 145+04 | 25 mm | crushed | WS | |
| 145+04 | 25 mm | stone | H-9 | 2P |
| 144+64 | 25 mm | crushed | I-10 | 2P |
| 144+64 | 25 mm | stone | (I1) | None |
| 144+25 | 25 mm | crushed | None | |
| 144+25 | 25 mm | stone | H-10 | WS |
Cores have been taken periodically from selected sections of the D-cracking mitigation test section. The cores were identified by the station of the original joint (prior to full- depth patching) along with an indication of whether the core was from the approach side of the patch or the leave side. The cores were dried at approximately 50-percent relative humidity and 22 °C to constant mass and were tested in accordance with ASTM C 215 to determine the dynamic modulus of elasticity.
Nondestructive testing of the existing concrete was conducted adjacent to the treated (or untreated) joints using Spectral Analysis of Surface Wave (SASW) methods. This testing was used to determine the average velocity of shear wave propagation in the concrete (Vokes et al., 1997). Because the equipment used to make these measurements in 1994 had an inadequate sampling rate to permit reliable separation of the measured vibrations from background noise, equipment with a higher sampling rate was used for the 1995 through 1998 measurements. These results, along with the dynamic modulus values determined from the cores, are shown in table 14.
As of 1998, the core dynamic modulus values do not show any conclusive trends. D-cracking would be expected to appear first at the intersection of the transverse and lane-shoulder joints. Equipment limitations with the core rig used prevented the cores from being taken exactly at the lane-shoulder joints, and because the cores could not be taken close to the lane-shoulder joints, this area may not show D-cracking-related deterioration for a number of years.
However, an examination of the concrete velocity measurements indicates that many sections have some degree of deterioration. Direct comparisons of the velocity values from year to year cannot be made, probably because temperature effects could not be taken into account (pavement temperature measurements at either the surface or at depth were not part of the scope of work). By normalizing the data to the approximate maximum value recorded each year (assuming the maximum values represent non-deteriorated concrete), the values can be compared. Figure 6 shows the concrete velocities for each test joint for all 4 years of testing. Visual examination during 1997 and 1998 indicated cracking near the transverse joints, which appeared to be D-cracking. These joints are marked with a "D" in figure 6. Also, in 1998 tests could not be conducted at some of the transverse joint locations because the concrete near the joints was missing right adjacent to the joint or had been patched. These are marked with a "P" in figure 6. Tests were conducted (and test values are plotted in figure 6) for these locations, but the actual testing location was a few inches (depending upon the extent of the patching or damaged concrete) further back from the original joint location. Since D-cracking severity decreases with increasing distance from the joint, these test results labeled "P" can be expected to be higher than they would have been if the test could have been conducted right at the joint.
| Station No. | Core Dynamic Modulus, MPa | NDT Velocity, m/s | |||||||
|---|---|---|---|---|---|---|---|---|---|
| 1994 | 1995 | 1996 | 1997 | 1998 | 1995 | 1996 | 1997 | 1998 | |
| 152+94 | 33,700 | 33,914 | 2,310 | 1,950 | 1,950 | 2,500 | |||
| 152+94 | 33,000 | 30,662 | 1,810 | 1,915 | 1,550 | 2,050 | |||
| 152+53 | 34,188 | 2,280 | 1,895 | 1,900 | 2,500 | ||||
| 152+53 | 2,625 | 2,200 | 1,600 | 2,050 | |||||
| 152+14 | 2,375 | 1,895 | 1,850 | 1,850 | |||||
| 152+14 | 2,750 | 2,470 | 2,400 | 2,500 | |||||
| 151+11 | 2,125 | 1,940 | 2,000 | 2,500 | |||||
| 151+11 | 36,000 | 2,670 | 1,930 | 2,300 | 2,450 | ||||
| 150+76 | 34,143 | 2,655 | 2,440 | 2,500 | 2,100 | ||||
| 150+76 | 36,600 | 2,655 | 2,470 | 2,450 | 2,450 | ||||
| 150+28 | 33,697 | 34,128 | 2,690 | 1,890 | 1,950 | 2,550 | |||
| 150+28 | 34,709 | 34,637 | 2,470 | 2,000 | 1,950 | 2,450 | |||
| 149+97 | 29,500 | 35,919 | 2,310 | 1,940 | 2,450 | 2,550 | |||
| 149+97 | 29,600 | 2,780 | 2,470 | 2,550 | 2,600 | ||||
| 149+48 | 32,500 | 2,625 | 1,870 | 2,400 | 2,600 | ||||
| 149+48 | 33,200 | 36,900 | 2,655 | 2,440 | 2,450 | 2,550 | |||
| 149+14 | 32,900 | 35,100 | 2,375 | 2,375 | 2,400 | 2,450 | |||
| 149+14 | 32,972 | 2,440 | 2,410 | 2,350 | 2,500 | ||||
| 148+66 | 2,430 | 2,375 | 2,600 | 2,050 | |||||
| 148+66 | 2,500 | 2,440 | 2,550 | 2,700 | |||||
| 147+82 | 32,322 | 2,375 | 2,500 | 2,300 | 2,550 | ||||
| 147+82 | 25,700 | 30,243 | 2,470 | 2,470 | 2,400 | 2,000 | |||
| 147+57 | 32,028 | 2,440 | 1,875 | 2,300 | 2,050 | ||||
| 147+57 | 30,635 | 2,280 | 1,920 | 1,950 | 1,300 | ||||
| 147+43 | 25,851 | 2,340 | 2,345 | 2,350 | 2,450 | ||||
| 147+43 | 30,857 | 2,250 | 2,440 | 2,450 | 2,550 | ||||
| 147+17 | 28,912 | 30,913 | 2,375 | 2,390 | 2,300 | 2,500 | |||
| 147+17 | 29,800 | 34,000 | 2,405 | 2,440 | 2,350 | 2,000 | |||
| 147+03 | 2,060 | 2,345 | 2,300 | 2,450 | |||||
| 147+03 | 31,879 | 2,470 | 1,690 | 1,950 | 2,500 | ||||
| 146+68 | 31,600 | 30,600 | 2,250 | 1,970 | 2,450 | 2,450 | |||
| 146+68 | 28,500 | 34,600 | 2,400 | 1,970 | 2,350 | 2,550 | |||
| 145+97 | 33,740 | 2,390 | 1,970 | 2,400 | 2,500 | ||||
| 145+97 | 2,340 | 2,030 | 2,250 | 2,550 | |||||
| 145+04 | 2,390 | 2,000 | 2,200 | 2,450 | |||||
| 145+04 | 35,283 | 2,090 | 1,875 | 2,300 | 2,100 | ||||
| 144+64 | 35,415 | 2,375 | 2,280 | 1,800 | 2,050 | ||||
| 144+64 | 2,375 | 1,940 | 1,900 | 2,200 | |||||
| 144+25 | 2,200 | 2,000 | 2,000 | 2,550 | |||||
| 144+25 | 22,532 | 2,410 | 1,940 | 2,400 | 2,600 | ||||
Figure 6. Field NDT velocity measurements.
D-cracking has reappeared adjacent to some of the patches and can be identified both visually and with the NDT velocities (Vokes et al., 1997). Areas with visual D-cracking are identified with a "D" in figure 6. D-cracking has reappeared in all of the sections made with aggregate having a 25-mm top size, except for three of the sections listed as being on ATB, which may reduce the moisture availability from the subbase. This suggests that none of the edge treatments was successful in significantly delaying the return of D-cracking. D-cracking has returned to some of the sections made with 19-mm aggregate, and the 19-mm sections with no evidence of D-cracking include both treated sections and control sections with no treatment. A few of the 12-mm sections also have D-cracking but, as expected, the smaller aggregate size has reduced the D-cracking potential.

