U.S. Department of Transportation
Federal Highway Administration
1200 New Jersey Avenue, SE
Washington, DC 20590
202-366-4000
Federal Highway Administration Research and Technology
Coordinating, Developing, and Delivering Highway Transportation Innovations
 |
| This report is an archived publication and may contain dated technical, contact, and link information |
|
Publication Number: FHWA-04-122 Date: February 2005 |
Previous | Table of Contents | Next
This section illustrates the application of the HIPERPAV II guidelines to solve realistic case studies. The first two case studies demonstrate the application of the HIPERPAV II guidelines in identifying early-age factors that affect long-term pavement performance. The last two case studies demonstrate the use of the HIPERPAV II guidelines in identifying early-age factors that influence the cracking characteristics of CRCP. Two scenarios are illustrated for each of the JPCP and CRCP case studies: a proactive scenario and a post-mortem scenario.
The proactive scenario may occur during the planning, design, or construction stage of a project. Under this scenario, the user of the guidelines may refer to chapter 5—HIPERPAV II Input Parameters— for the proper selection of HIPERPAV II inputs under the five categories of pavement design, materials and mix design, environment, construction, and traffic. Because these guidelines provide only general guidance with the selection of the input parameters in these categories, the user should employ engineering judgment in the final selection of the inputs.
For the post-mortem scenario, the user of the guidelines may be experiencing a particular problem, either occurring in the early age or during the long term. For this particular case, the user may refer to chapter 3, Early-Age Pavement Distresses, or chapter 4, Impact of Early-Age Behavior on Long-Term Performance, according to the nature and timeframe of the specific problem.
Under both scenarios, the user may refer to chapter 2, Early-Age Pavement Behavior, for a detailed understanding of the mechanisms occurring during the early age that influence the performance of the pavement in the long term.
During high temperature conditions, at what time of day should concrete be placed to minimize the probability of cracking?
Under hot weather conditions, when air temperatures exceed 32 °C, concrete temperatures often increase rapidly after placement. This causes the concrete to set at a high temperature, and any significant cooling soon after set will produce high thermal stresses in the pavement. Cracks likely will develop and adversely affect pavement performance. This premature random cracking is commonly called thermal shock (see section 3.2).
The contractor, Jane Q. Buildalot, is scheduled to construct a 305-mm JPCP in Austin, TX, on July 18, one of the hottest days of the year. Knowing that high temperatures can cause unwanted cracking, she reviews the HIPERPAV II guidelines to help determine the optimal time to begin construction and still produce a pavement with good early-age and long-term performance. The time of day recommended in the guidelines for construction is early evening and into the night (see section 5.4.2). Delaying the time of construction to evening takes advantage of nighttime cooling, thereby offsetting the concrete's heat of hydration. Jane can use HIPERPAV II to solve for the exact window of time when paving will produce a high quality pavement at early age and also in the long term.
HIPERPAV II can be used to assess how changing the time of placement impacts concrete stresses. For this case study, the HIPERPAV II temperature database will be used to estimate the climatic conditions on July 18. It is anticipated that the maximum temperature will be approximately 40 °C and the minimum temperature 18 °C. Jane is planning to use a concrete mix specified to reach a laboratory 28-day tensile strength of 3.2 MPa, with siliceous river gravel as the coarse aggregate. Sawcutting will occur at the optimal time.
Jane has several options besides changing the time of placement to avoid excessive concrete temperatures. She could use Type II cements or cool the concrete mix components. For this case study, however, she will determine the optimal time of placement for this specific concrete mixture (Type I + fly ash) to minimize the probability of cracking.
Twelve HIPERPAV II runs will be performed to determine how the time of placement affects the pavement stresses and the concrete strengths. The maximum stress-to-strength ratio will be determined for each scenario. A stress-to-strength ratio greater than 1 indicates the pavement will likely crack. A window of caution will be noted when the stress-to-strength ratio is greater than 1. Not willing to risk problems, she decides that no paving should be performed during this timeframe.
As illustrated in figures 66 and 67, changing the time of construction shifts the concrete's peak heat of hydration, allowing it to be offset from the maximum daily temperature. Figure 66 33 illustrates how the concrete temperature rises sharply when its heat of hydration coincides with the peak daily temperature.
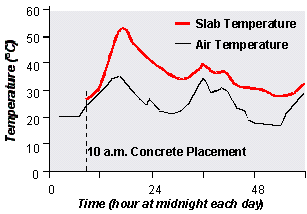
Figure 66. Typical temperature development in the slab for concrete placement at 10 a.m.
Intuitively, it is expected that concrete placed after the maximum air temperature (6 p.m.) and before sunrise (5 a.m.) will offset the concrete's heat of hydration and the maximum daily air temperature. This will produce the most desirable placing conditions, because it forces the peak heat of hydration to coincide with the minimum air temperature. The resulting temperature in the concrete will be low. The effect of early evening placement on concrete temperature is shown in figure 67.

Figure 67. Typical temperature development in the slab for concrete placement at 8 p.m.
Jane performs multiple HIPERPAV II analyses at 2-hour intervals using a design reliability of 90 percent. The impact of changing the time of placement during hot weather conditions on the stress-to-strength ratio can be seen clearly in figure 68. For the conditions analyzed, the window of caution is from 7 a.m. to 5 p.m. These results clearly demonstrate how HIPERPAV II can be used to determine the best time of day for placing concrete to minimize the probability of cracking in JPCP.
Under these assumed conditions, the peak heat of hydration occurs about 6 to 8 hours after placement. Placement at 9 a.m. should produce the worst conditions, since 8 hours later, the peak air temperature is reached, thereby matching and amplifying the peak heat of hydration temperature.
After the window of caution is determined, Jane can use HIPERPAV II in an iterative manner to further investigate the effects of other proactive changes on minimizing the potential for cracking during the high-risk period of 7 a.m. to 5 p.m. The measures Jane can examine include different cement types, different aggregate types, cooled batching water, and base whitewashing.
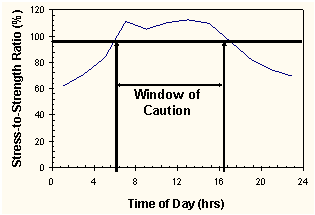
Figure 68. Early-age stress-to-strength ratio as a function of time of placement.
Now that Jane has determined the most favorable time to construct the pavement to prevent early-age failures, she wants to see how the time of placement influences the pavement's long-term performance. Reviewing the HIPERPAV II guidelines, she sees that joint opening, delamination, and built-in curling are some of the primary early-age indicators of long-term performance.
Jane suspects that built-in curling will definitely play a significant role in the long-term performance analysis, since the concrete is being placed during one of the hottest summer months, and the pavement likely will set with a positive thermal gradient. According to the guidelines, this will affect pavement smoothness, faulting, and cracking.
Entering the specific load transfer, construction, and traffic inputs for this project, she assesses long-term performance as a function of placement time at 90 percent reliability. For all of the runs, joint faulting is a constant 0.25 mm, and it is not affected by placement time. However, transverse cracking and smoothness of the pavement change as a function of the time of placement.
Figure 69 shows that pavements placed during the window of caution have the highest percentage of transverse cracking in the long term at 30 years, the expected design life. The pavements placed early in the morning and during the night have the lowest amount of long-term damage. Similarly, she finds that the serviceability and ride of the pavement will be the best if she places the JPCP outside of the window of caution (see figure 70).
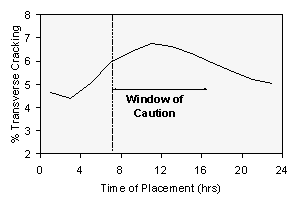
Figure 69. Transverse cracking as a function of time of placement.

Figure 70. International Roughness Index (IRI) and serviceability as a function of time of placement.
Based on this HIPERPAV II analysis, Jane is confident that placing the pavement at night and during the early morning hours will result in a pavement with few early-age distresses, and that the pavement will perform well in the long term.
After 10 years of use, a concrete pavement is faulting. Is it possible that this behavior was caused by early-age factors?
The faulting of a nondoweled JCP in Austin, TX is increasing, and the engineer, Joe Q. Thinksalot, is determined to find out why. More specifically, he wants to see if early-age conditions may be a contributing factor. With the HIPERPAV II guidelines in hand, he turns to section4.1 : Faulting of JPCP without Dowels. He wants to connect the early-age behavior of this pavement to its long-term performance. The early-age joint design is cited as being one of the most influential factors. The joint opening of a nondoweled pavement is a function of the temperature change, joint spacing, slab-subbase restraint, and the load transfer efficiency.
Joe decides to use HIPERPAV II to help him understand how these four influential parameters affect JPCP performance. He will perform a post-mortem analysis on this 250-mm thick JPCP. Looking at the construction records, Joe finds that the slab length varied between 4.5 and 7.6 m, and that the pavement was constructed on a smooth asphalt concrete subbase. Additional information and measurements collected during a field inspection visit are presented below:
Faulting occurs in JPCP as a result of several factors. Water enters the joint in the JPCP, and the subbase under the pavement becomes saturated. As the truck loads pass over the joint, the loose subbase material pumps. It comes out of the joint and causes the difference in elevation, as illustrated in sections 4.1 and 4.2 of this guide.
Joe uses HIPERPAV II to examine the effect of slab length, from 4.5 to 7.6 m, and dowels on JPCP early-age and long-term performance. The early-age critical stresses for the 4.5- and 7.6-m slab lengths are shown in figures 71 and 72. As expected, the stresses in the 7.6-m slabs are higher. The longer slabs experience more contraction and expansion around their centerline.
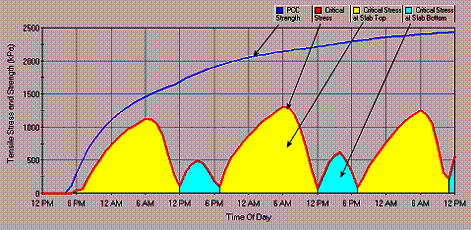
Figure 71. Early-age analysis results for 4.5-m joint spacing.
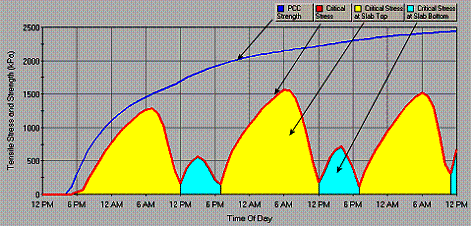
Figure 72. Early-age analysis results for 7.6-m joint spacing.
A long-term HIPERPAV II analysis yields the faulting results for the 4.5- and 7.6-m nondoweled jointed pavements shown in figure 73. The faulting of the 7.6-m slabs is approaching an objectionable level at 30 years. Comparatively, the faulting of the 4.5-m slabs is about 25 percent less.
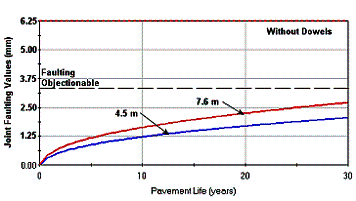
Figure 73. Predicted faulting for 4.5-m and 7.6-m joint spacing alternatives with no dowels.
Several design changes can be made to the JPCP to reduce its faulting. One possible alternative is to use dowels at the joints. Dowels are one of the most effective means to reduce faulting. The HIPERPAV II results demonstrate this, as illustrated in figure 74. Faulting of the pavements with dowels is 36 to 50 percent less than it was when the pavement was nondoweled.
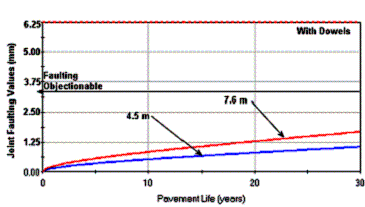
Figure 74. Predicted faulting for 4.5-m and 7.6-m joint spacing alternatives with dowels.
How does hot versus cold weather placement of CRCP influence its behavior?
Cracks develop in CRCP a few hours to a few days after construction due to thermal stresses. In some cases, the cracks may not be apparent for 5 or 10 years, but after they do appear, they can rapidly progress into distresses that significantly affect the long-term performance of the pavement. Excessive thermal cracking often is due to high temperature differentials, excessive subbase friction, aggregates with high CTE/contraction, or a combination of the above.
In this case study, a proactive seasonal analysis is performed on a 280-mm CRCP. The engineer, Mary T. Rifick, wants to see the influence of summer and winter placements on CRCP performance for a given steel design. She knows that thermal stresses play a significant role in CRCP crack development, and subsequently their long-term performance.
For guidance, Mary refers to the HIPERPAV II guidelines. In section 5.3, Climatic Inputs, there is a discussion on the effect of early-age and long-term climatic inputs on CRCP performance. She decides to perform two series of HIPERPAV II runs, one for summer placement (July 25) and another for winter placement (January 2) using the weather estimates contained in HIPERPAV II. Because of the unpredictability of actual weather conditions, she decides to adjust the posted 72-hour temperatures. She lowers the minimum air temperature after the critical analysis to 1 °C.
When evaluating the HIPERPAV II analyses, Mary will examine the early-age indicators of long-term CRCP performance: crack spacing, crack width, and steel stress (described in section 2.3). She knows that if the average crack spacing is less than 1.1 m, it is likely that punchouts will form in the CRCP, decreasing its long-term performance (described in section 4.7).
To perform her analysis, Mary modifies the post-72 hour climatic data, but keeps all other inputs at their default values. Over time, the crack spacing decreases, as shown in figure 75. She finds that a winter placement yields a CRCP with a larger average crack spacing at 1 year (2.1 m) than does a summer one (1.7 m). This means that punchouts are not as likely to form when a CRCP is constructed in winter.
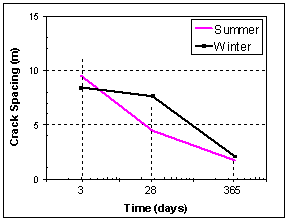
Figure 75. Change in crack spacing with time for summer and winter placements.
For both the summer and winter placements, increasing the
temperature differential in the pavement (increasing ![]() T) causes the crack
spacing to decrease. As
T) causes the crack
spacing to decrease. As ![]() T
increases, the slab is subjected to a larger temperature change, as shown in
figure 76. This means that more cracks
are likely to form, because cracking in concrete pavements is highly influenced
by temperature variations.
T
increases, the slab is subjected to a larger temperature change, as shown in
figure 76. This means that more cracks
are likely to form, because cracking in concrete pavements is highly influenced
by temperature variations.
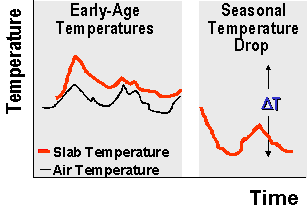
Figure 76. Representation of PCCP temperatures in the early age and at the lowest seasonal air temperature.
HIPERPAV II takes into account the thermal processes due to the concrete's heat of hydration, the curing temperature, the daily minimum temperatures, and the annual minimum temperature when predicting crack formation. A cumulative frequency plot of crack spacing at 1 year for the summer and winter placements (with ![]() T = 33 °C and 12 °C, respectively) is shown in figure 77. The trend at 1 year is consistent: the CRCP placed in the summer has more closely spaced cracks.
T = 33 °C and 12 °C, respectively) is shown in figure 77. The trend at 1 year is consistent: the CRCP placed in the summer has more closely spaced cracks.
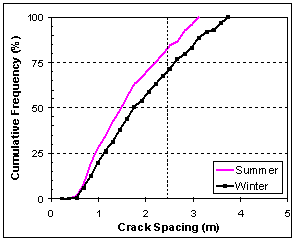
Figure 77. Crack spacing distribution for pavements constructed during summer and winter.
Using this HIPERPAV II analysis, Mary realizes that with proper analysis, she will be able to construct a CRCP with good long-term performance during the winter. If a CRCP can only be placed in the summer, she can modify the construction process to improve its performance. She has other options to control the concrete temperature, such as improving the curing method. They can be investigated with HIPERPAV II, as well. HIPERPAV II allows her to take the guesswork out of CRCP performance and helps her construct CRCP with consistently good long-term performance.
How does coarse aggregate type affect the performance of CRCP for a set of climatic conditions?
Two CRCP sections, pavement A and pavement B, were placed at the same time on the same day, December 12, 1997. However, pavement A has been performing significantly better with fewer punchouts and lower maintenance costs than pavement B for the past 5 years. To determine what is causing this difference in performance, the engineer, Sam K. Pable, picks up the HIPERPAV II guidelines and looks at chapter 2, Early-Age Pavement Behavior; chapter 3, Early-Age Pavement Distresses; and chapter 4, Impact of Early-Age Behavior on Long-Term Performance. The early-age indicators of long-term CRCP performance are crack spacing, crack width, and steel stresses. Walking down the CRCP, Sam notices that the cracks are spaced closer in pavement B than in pavement A, as shown in figure 78. On pavement A, crack spacings are distributed between 1.1 and 2.4 m, while on pavement B, the spacing is less than 1.1 m in some instances.
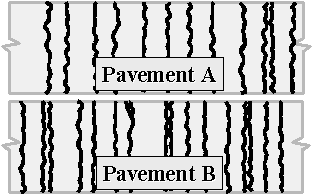
Figure 78. Illustration of differences in cracking patterns for pavements A and B.
Further investigating the reasons behind this performance difference, Sam studies the construction documents to see if there is a difference in materials used or construction procedures followed when building pavements A and B. After studying the mix designs, the only significant difference he can find is that limestone aggregate was used in pavement A and that siliceous river gravel was used in pavement B.
Sam decides to use HIPERPAV II to assess the behavior of a 280-mm CRCP constructed with concrete containing different aggregate types, namely siliceous river gravel, basalt, granite/gneiss, sandstone, and limestone. The climatic database in HIPERPAV II is used to estimate the temperatures at noon on December 12.
HIPERPAV II can be used to understand how aggregate type affects the early-age performance of CRCP. The expansion and contraction of the concrete greatly depends on the coarse aggregate CTE, since coarse aggregate comprises about half of the concrete volume. Because temperature changes are the greatest in the pavement immediately after construction, its volume changes are significant at early ages. Figure 79 shows how the concrete volume changes based on its CTE when it is subjected to a temperature drop.
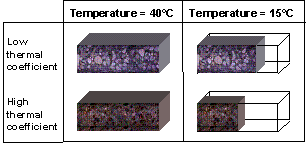
Figure 79. Illustration of difference in volumetric changes with temperature for concretes with different CTE.
The CTE is especially important for pavements placed in the summer season when temperature extremes are high, as in Sam's analysis. During hot weather placement, the peak ambient temperature may coincide with the peak heat of hydration (as in morning placements). Under such conditions, concrete pavements having a high concrete CTE tend to have an increased probability for early-age cracking, when compared to pavements constructed with coarse aggregate having a lower thermal coefficient. The following are the HIPERPAV II default CTE values for the selected aggregates:
For each of these aggregate types, HIPERPAV II analyses are performed to determine how aggregate CTE impacts CRCP crack spacing, crack width, and steel stresses. It is expected that the aggregate with the lower CTE will yield a pavement with longer crack spacings and fewer long-term failures (punchouts) (see section 4.7).
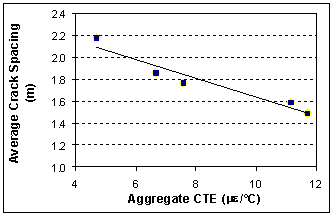
Figure 80. Average crack spacing after 1 year foraggregates with different CTE.
For aggregate with a low CTE, the crack spacing is high (2.1 m), which translates to a reduced number of punchouts in the long term. Figure 81 shows the cumulative crack spacing for the pavements containing siliceous river gravel and limestone at 1 year.
It is apparent that the average crack spacing is smaller for the pavement with the siliceous river gravel.
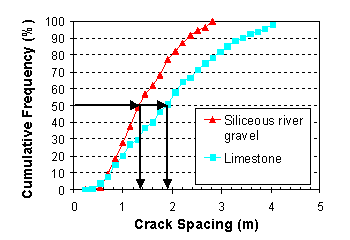
Figure 81. Crack spacing distribution after 1 year for the siliceous river gravel and limestone strategies.
From these results, Sam concluded that CRCP will have better long-term performance if the concrete used in its construction has a low CTE. In this case study, changing the aggregate in the concrete from one with a high CTE to one with a low CTE resulted in a larger average crack spacing. This translates to less distress in the long term. Sam discovered that the pavement constructed with the low CTE aggregate provides better performance because the thermal stresses are reduced. If low CTE aggregates are not available (as is often the case) and a high CTE aggregate must be used, he knows that HIPERPAV II can optimize the time of day and the season of placement to ensure the best CRCP performance possible.