U.S. Department of Transportation
Federal Highway Administration
1200 New Jersey Avenue, SE
Washington, DC 20590
202-366-4000
Federal Highway Administration Research and Technology
Coordinating, Developing, and Delivering Highway Transportation Innovations
 |
| This report is an archived publication and may contain dated technical, contact, and link information |
|
Publication Number: FHWA-HRT-04-150 Date: July 2006 |
Previous | Table of Contents | Next
The concrete petrographer is often called upon to explain the causes of deterioration of an HCC placement. The determination of the severity and the extent of the distress must include an examination of the placement. The laboratory work of the petrographer includes identification of the cause(s) of distress through an examination of the cracks and crack surfaces, paste and aggregate condition, and identification and study of the nature of the aggregates and any secondary reaction products by performance of various tests.
Concrete is fabricated by placing aggregate consisting of gravel, sand, or rock fragments or other mineral material in a very chemically active environment. The fluid of fresh cement paste is a saturated solution of calcium hydroxide. This solution is very alkaline (a pH of 13.5 is not uncommon and the high pH level can be maintained long after the concrete hardens absent chemical reactions (e.g., pozzolanic reactions) to reduce it). These alkaline solutions are so strong that they will chemically burn skin and etch glass and are much stronger than the solutions to which rock might typically be subjected during the natural weathering cycles. In hardened concrete, these solutions can cause dissolution of particular siliceous minerals or glass in aggregates, or cause chemical and volume changes in particular carbonate rocks. These reactions are collectively called alkali-aggregate reactions, which are subdivided into ASR in the case of the former and alkali-carbonate reactions (ACR) in the latter. Both of these reactions are deleterious when they cause sufficient expansive force within concrete to rupture the concrete despite the restraint of the mass of the placement and the powerful bonding within the cement paste. If the expansive force is so minor that it cannot overcome the restraint imposed by the concrete, then no deterioration occurs (Hilton, 1974; Houston, 1969).
The alkali metals (sodium and potassium) in cement are reported in terms of sodium oxide equivalent (Na2Oeq) calculated as the sum of the sodium oxide (Na2O) mass percentage plus 0.658 of the potassium oxide (K2O) mass percentage. The factor 0.658 accounts for the difference in the atomic mass between Na2O and K2O. Gebhardt (1995), in a survey of North American portland cements, reports alkali contents ranging from 0.11 to 1.2 percent Na2Oeq, with Na2O ranging from 0.03 to 0.47 percent and K2O ranging from 0.07 to 1.20 percent. However, cement is not always the only source of the alkalis involved in the deleterious reactions. Deleterious alkalis may come from groundwater, seawater, deicing chemicals, or other sources (e.g., aggregates).
The identification of AAR as a cause of concrete deterioration requires an integration of field and laboratory evidence (British Cement Association, 1992; Lane, 2001). In the field, a differential volume change between the exterior and interior portions of the concrete mass resulting from AAR is manifested by pattern cracking on the surface, with an overall expansion of the element. Laboratory investigations will focus on determining the cause of the expansion, specifically: Are aggregate particles reacting? If so, which ones and what is the nature of the reaction?
T.E. Stanton (1940), working in California, first identified reactions between the alkalis in cement and aggregates as a cause of concrete distress. In the early literature, prior to the discovery of ACR, the reaction was simply called the alkali-aggregate reaction (Diamond, 1978). The reactive constituent in the California aggregates studied by Stanton was opal.
In light of Stanton ’s discovery, some cases of previously identified but unexplained concrete deterioration were revisited and were found also to be explainable by a similar phenomenon; a notable example from Virginia is the Buck Hydroelectric Plant (Kammer and Carlson, 1941), involving a crushed phyllite aggregate. Since the reactive constituents in these early cases were silica minerals or siliceous glasses, the subgroup alkali-silica reaction was coined. Mielenz (1956) mapped known ASR occurrences in 17 States: California, Arizona, and Nevada; Idaho, Washington, and Oregon; Colorado, Wyoming, Kansas, Nebraska, and Missouri; Indiana and Ohio; Alabama; Georgia; New Jersey; and Virginia. An updated map (Mielenz, 1994) shows occurrences in 33 States. A nationwide survey of State highway departments for the Strategic Highway Research Program (SHRP) received positive responses from 19 States, negative responses from 18 States, and no response from 5 States (Stark, et al., 1993). From this knowledge of alkali-reactive constituents, it is probably safe to conclude that alkali-silica reactive aggregates occur in virtually all of the 48 contiguous States.
It is somewhat of a misnomer that the reaction has been given the name alkali since it is actually the hydroxide ions associated with the sodium and potassium ions in solution that cause the deleterious reactions. The alkalis are not always present in sufficient amounts to cause a deleterious reaction, thus explaining why deleteriously affected concrete is not as widespread as potentially reactive aggregates. In a closing comment to the discussion of his paper, Stanton (1940) suggests that, based on work to date, deleterious ASR would not occur with cements having alkali contents below 0.60 percent Na2Oeq, with the caveat that the future developments would settle the issue. The 0.60 percent Na2Oeq value was then adopted in 1959 (Frohnsdorff, Clifton, and Brown, 1978) and remains as the designating limit for "low-alkali cement" as specified in ASTM C 150. Tuthill (1982), citing field evidence, reported that the 0.60 percent limit was set too high and that 0.40 percent was a more appropriate limit to avoid deleterious reactions.
This reaction occurs between the hydroxide ions associated with the dissolved salts of sodium and potassium and the silica molecules of particular imperfectly crystallized siliceous rocks and minerals, such as opal, chert, and cristobalite, or highly siliceous volcanic glasses or highly strained or granulated siliceous rocks, such as the metaquartzites, other stressed silicates, and exceptionally fine-grained siliceous rocks (such as siltstones and phyllites). The reaction produces a silica gel that will expand in the presence of moisture. The expanding gel causes cracks in the aggregate and paste. The cracks allow more moisture to enter and expansive gel to fill the cracks and cause more expansion.
As the reaction proceeds, the gel forms and can expand. The expansion ruptures the aggregate particles, allowing the gel to migrate out of the particle where it can permeate the paste and collect in entrapped voids, pores, and microcracks. These gel deposits may continue to expand, opening microcracks and creating new cracks.
Sometimes, the entire center of a highly reactive aggregate particle, such as chert, may be converted to an expansive gel that can create, ooze out into, and enlarge microcracks. When the concrete is broken or cut open, many large cracks may be seen radiating from reactive particles. Destructive cracks may also be found radiating from gel-filled pores and voids.
The gel formed at the aggregate surface and that formed before hardening (usually distributed interstitially throughout the paste) are high in lime. These high-lime gels are thought to be unable to expand and therefore innocuous. Pozzolanic materials and ground slag react with hydroxyl in a similar reaction, incorporating the alkalis in the (nonswelling) silicate hydrate produced, thus removing them from the pore solution and reducing pore solution alkalinity.
With the exception of the pure limestones and dolomites, almost all rocks contain some silica. Silica is the most common oxide in the earth ’s solid crust. The more soluble the form of the silica, the faster and more intense is the reaction. Varieties of naturally occurring silica minerals are listed in rough order of decreasing reactivity in table 21. This list is very general because, of course, the order is dependent on the degree of disorder to be found within the particular variety and mode of occurrence of the species.
Table 22 lists rocks that have been found to be deleteriously reactive and thus can be considered potentially reactive. The actual reactivity of any given rock is dependent on the type and amount of reactive constituent (see table 21) present, as well as other factors. The list in table 22 is not exhaustive and will likely grow with the passage of time.
|
|
Once the reaction has started in a concrete, it will continue as long as deleterious alkali ions, reactive aggregate, and water are available in sufficient supply. The rate of the reaction depends on the solubility of the silica-bearing minerals involved, the type of gel formed, the amount of water-soluble alkali present, the availability of water, paste permeability (the ability of water and ions to migrate), and temperature
ACR was first observed by Swenson (1957) in Kingston, Ontario, Canada, and was found by Newlon and Sherwood (1962) to occur in Virginia. This reaction occurs between particular impure dolomitic limestones of a specific petrographic type (Newlon, Sherwood, and Ozol, 1972; Swenson, 1957; Swenson and Gillot, 1960; Walker, 1978) and the hydroxide ions associated with the dissolved salts of sodium and potassium alkalis in the pore solution. ACR is not as well understood as ASR, but it involves de-dolomitization (decomposition of dolomite to brucite and calcite) (ACI 221.1R; Ozol, 1994). The expansion produced occurs within the aggregate particle causing cracks within the aggregate and the paste and, therefore, deleterious expansion of the mass. The dolomite crystals in the aggregate are chemically altered by the alkali solutions in what is apparently a multistep process. Which step causes the expansion has not been determined.
All known reactive carbonate rocks are from the geologic time period known as the Ordovician period. Fortunately, the particular proportion of minerals and the microstructure of the reactive carbonate rocks involved are not very common. This rock has been suspected of not being a geologically stable combination of minerals (Steidtmann, 1917). De-dolomitization, although rare, has been observed in rocks and experimentally at low (less than 50 oC) temperatures in the presence of solutions with a high calcium-to-magnesium ratio (Pettijohn, 1975), conditions not unlike those to which the aggregate would be exposed in concrete.
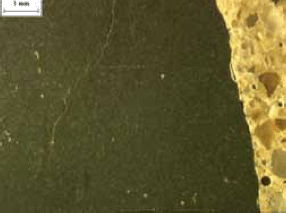
The carbonate aggregate that is associated with this reaction is an impure dolomitic limestone. The two major carbonate minerals, calcite and dolomite, are present in nearly equal amounts in the most common ACR rocks; however, some reactive rocks have dolomite contents of up to about 90 percent of the carbonate fraction (Ozol, 1994). Noncarbonate minerals (insoluble in weak HCl), usually of submicroscopic size, make up 10 to 25 percent of the mass and generally consist of clay, various iron sulfides, and quartz. Small quantities of other minerals may also be present. The aggregate is often (but not always) dark gray or nearly black because of the finely divided iron sulfides. The fracture in a hand specimen is subconchoidal because the individual crystals are so small and interwoven that their cleavage and parting do not affect the surface.
When the cement alkali content is less than about 0.45 percent Na2Oeq, the cement has been considered to be too low in alkali content to contribute to a significant chemical reaction and concomitant expansion as a result of ACR (Swenson and Gillott, 1960). At this time, we do not know if this low limit for the alkali content will prevent ACR in every case.
ACR is not related to the aggregate soundness problem found in the Midwest that has been termed D-cracking. D-cracking has not been found in Virginia and, therefore, VTRC has not had any experience with it. Refer to appendix D for more details on D-cracking.
AAR causes internal volume expansion that is manifested on the exterior surfaces of the concrete by map or pattern cracking (figures 93 through 97) (see also ACI 201.1R, SHRP C/FR-91-101). Field observations can be critical to a proper determination of the cause(s) of distress and should be made by the petrographer and/or other qualified personnel following appropriate protocol (see Van Dam, et al., 2002a,b). In performing the examination, careful attention should be given to features suggestive of AAR (British Cement Association, 1992; Lane, 2001). (Note that although these documents are addressing ASR, the field manifestations of ASR and ACR will be similar, with the exception of possible exuding of ASR reaction products as outlined in table 23.) Table 23 also provides factors for rating the extent and severity of the observed features.
| Features, observations |
| Cracking Position, disposition, and pattern Discoloration Surface patches, along cracks Efflorescence, exudations Position, extent, quantity Popouts Number, size, distribution, particle nature |
| Classification, index extent, and severity of each feature |
| Extent of features, ranking value: Not significant 1 Slight, up to 5 percent area or length 2 Moderate, 5 to 20 percent 3 Extensive, more than 20 percent, but not all 4 Total, all areas affected 5 |
| Severity of features, ranking value: Not significant 1 Minor feature, non-urgent, cosmetic 2 Unacceptable features requiring attention 3 Severe defects requiring immediate attention 4 Structurally unsafe 5 |
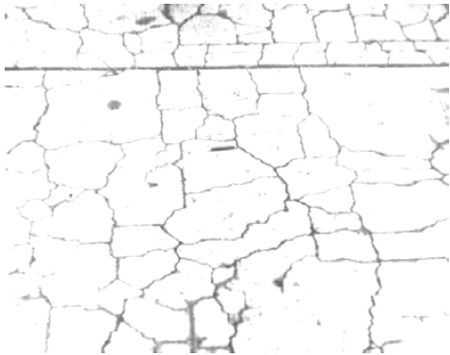
The pattern of cracking that indicates expansion of the concrete can be very similar to cracks generated in masses of mud when the top layer dries and shrinks, plastic shrinkage cracks (see chapter 4), and cracks in particular lava flows that occur when the surface cools rapidly and shrinks. Each portion of the surface pulls away from every other portion, generating an irregular honeycomb pattern. The size and regularity of the pattern depend on the cohesiveness, uniformity, and isotropy of the material and the speed of shrinkage.
This pattern is generated because there is a differential volume change between the exposed surface material and the attached massive substrate. In plastic or drying shrinkage cracking, mud cracking, or cooling lavas, the surface has shrunk relative to the substrate. In expansive AAR, the pattern is generated by an increase in volume of the substrate relative to the volume of the overlying surface material. The surface cracking pattern has been called pattern cracking, map cracking, Isle of Man cracking , and crow’s foot cracking .
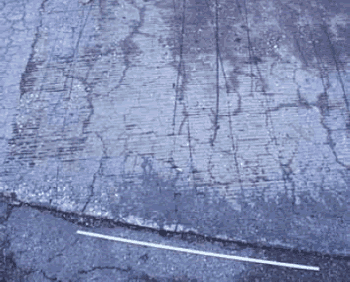
In ordinary concrete that is free to expand equally in all directions parallel with the plane of the surface, the classical cracking pattern is usually very evident on the surface in all stages of deterioration (see figure 93). In continuously reinforced HCC pavement or in concrete units that are much longer than they are wide (such as beams), the concrete is not free to expand equally in all directions. In the early stages of deterioration, concrete can expand only at right angles to the length and the cracks will, of necessity, be at right angles to the direction of the expansion and therefore parallel with the long dimension (and the reinforcing steel when present) (see figure 94). In the early stages, longitudinal cracking caused by AAR is sometimes mistaken for cracking caused by expansion of the corrosion products of the reinforcing steel. If a nonreinforced, relatively equant concrete member fabricated with similar materials (such as a bridge approach slab) and placed at the same time is availab le, it may show classical pattern cracking long before the longitudinal or reinforced unit exhibits anything other than longitudinal cracking. Figures 95 through 97 show examples of concrete distressed by AAR.
Figure 93. Idealized sketch of cracking pattern in concrete mass caused by internal expansion as a result of AAR.
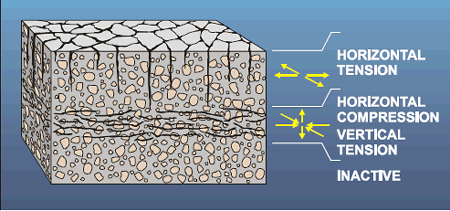
Figure 94. Map cracking with preferred longitudinal trend in continuously reinforced concrete pavement.
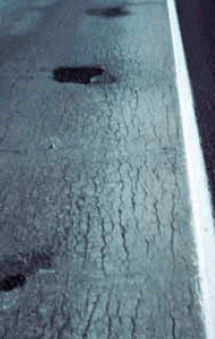
Figure 95. Typical destructive ASR in plain or lightly reinforced pavement.
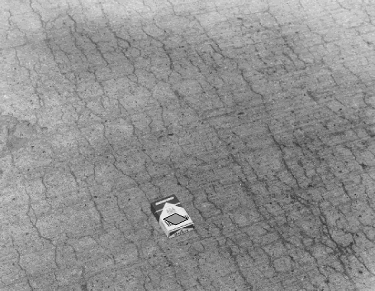
Figure 96. Destructive ASR in anchor block.
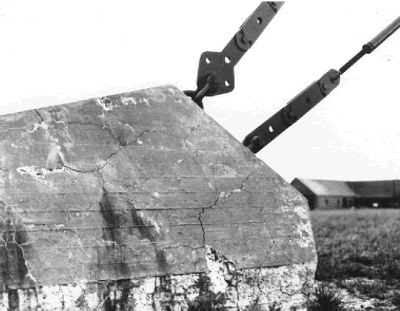
Figure 97. Cracking of pavement as a result of ACR.
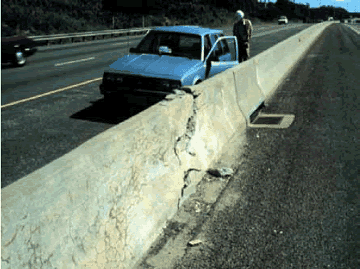
The expansion of the placement may be very evident. Expansion joints may have closed, with the joint compound having been squeezed out. Guardrail sections that had been planned with a space between may be abutting and grinding together and destroying each other. Occasionally, the expansion may cause blowups, with slabs of concrete bowing upward off the base because they no longer fit the space. The expansion can cause shearing of bolts and, occasionally, humping of nearby flexible pavement on the shoulders. Figures 98, 99, and 100 show examples of structural expansion.
Figure 98. Upper portion of backwall sheared by expansion of bridge deck.
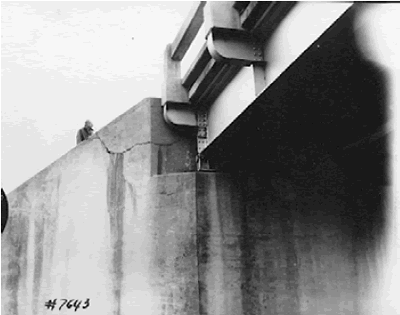
Figure 99. Expanding median barrier crushes itself.
Expansion caused by ASR of quartzose coarse aggregate.
If elements of the placement are being forced together or the cracking pattern indicates that the lower or damper portions of the concrete may have expanded relative to the upper drier portions, or both, the concrete is probably deteriorating by internal expansion.
The expansion is not always clearly shown and may be difficult to understand and document. Expansion is greatest in the areas that have the least optimum combination of factors (i.e., areas that combine the reactive aggregate in sufficient amounts; a sufficient amount of alkali in the pore solution; and, most variable of all, sufficient amounts of moisture and a sufficiently high permeability to permit the reaction and expansion to occur). Because the reaction cannot occur without moisture, the reaction and expansion are greatest at the depths in the concrete that very seldom become dry. The surface zone of the concrete is the driest portion, does not react as much, and does not expand as much; however, the surface portion is bonded to the concrete beneath and must move with it and, therefore, cracks. An internal RH of 80 percent is needed for ASR to proceed with deleterious expansion. Nearly all concrete will have an internal RH of more than 80 percent if one side is on the ground and the RH is measur ed at a depth of 50 mm from the exposed surface, even in the desert (Stark, 1991).
ASR produces an expansive silica gel that may be visible on the surface of the concrete in most advanced cases of deterioration. The gel may be translucent and moist or sticky, but often becomes dehydrated and carbonated to an opaque white coating or an efflorescence (see figure 96). Such exudates should be sampled for analysis in the laboratory as they may consist of merely carbonated hydroxides (see section 10.4).
Figure 100. Closing of joint caused by bridge deck expansion as a result of ACR.
Occasionally, as the gel dehydrates on a pavement surface, it becomes polished to a translucent glaze. In a severely deteriorated bridge, the silica gel and leached-out calcareous reaction products may form stalactites hanging under the bridge. In cases of an ASR with little or no deterioration caused by expansion, the silica gels may exist within the concrete as void fillings or as fillings in cracks produced by structural strains or deterioration caused by cycles of freezing and thawing.
Guidance on the sampling of concrete suspected of materials-related distress can be found in Van Dam, et al. (2002b). Sampling of HCC in the early stages of alkali-aggregate deterioration may need to be more complete than the sampling suggested in appendix A. The surface evidence of AAR is not usually evenly distributed on the placement and is not often indicative of the condition of the HCC beneath the surface. Whereas it is important to obtain specimens of the most deteriorated areas, it is equally important to study specimens of concrete from areas that have no surface deterioration so that an assessment of the extent of the underlying expansion can be made. Full-depth cores should be taken of several areas showing surface distress, of apparently undamaged HCC halfway between such areas, and at regular distances between the halfway cores and the most distressed areas.
At this stage, field examinations have suggested differential volume change between the interior and exterior of the concrete mass. The goal of the laboratory examination is to determine whether the interior is expanding and, if so, which concrete components and what mechanisms are involved in causing the expansion.
To maintain objectivity in the petrographic assessment of damage, several authors have proposed rating systems (Grattan-Bellew, 1995; Clemeña, et al., 2000; Rivard, Fournier, and Ballivy, 2000). The use of such rating procedures is further described in CSA A864-00 (CSA International, 2000). In these rating procedures, the number of occurrences of specific features observed during a low-magnification examination of a lapped surface is weighted according to the specific feature and summed, and the rating is normalized for the area observed. Features and suggested weighting values specific to ASR are shown in table 24. The weighting assigned to a particular feature is somewhat subjective based on consideration of its indication of damage related to ASR. Thus, this type of process provides a means of achieving an objective quantitative rating of ASR-related damage from a petrographic examination.
| Feature Observed | Factor (Grattan-Bellew, 1995; Rivard, et al., 2000) | Factor (Clemeña, et al., 2000) |
|---|---|---|
| Coarse aggregate with cracks | X 0.25 | 2 |
| Coarse aggregate with cracks and gel | X 2 | 4 |
| Coarse aggregate debonded | X 3 | 0.5 |
| Reaction rims on aggregate | X 0.5 | 4 |
| Corroded aggregate | — | 4 |
| Cement paste with cracks X 2 4 | X 2 | 4 |
| Paste with cracks and gel | X 4 | 6 |
| Air voids lined with gel | X 0.5 | 0.25 |
When developing rating systems, careful consideration should be given to the selection and interpretation of features to be rated. Preexisting rims on aggregates (i.e., weathering rims on ravel sand particles) must be distinguished and discounted. Rims that have formed in situ in the concrete are clear evidence of alteration; however, such alteration can often be innocuous. Likewise, cracks resulting from natural processes or aggregate processing may be present in particles prior to their introduction into concrete, and this possibility must be considered when examining the concrete for signs of internal distress.
Applying a similar approach, but categorizing damage-related features into damage-specific, aggregate-specific, and ASR-specific groups, a rating scheme that will objectively assist in ascribing responsibility among the active deterioration mechanisms can be developed (table 25).
| Category | ||
|---|---|---|
| A: Concrete Damage | B: Aggregate Involvement | C: ASR-Specific |
| Cracks in paste | Cracks in aggregate | Gel in aggregates |
| Cracks in aggregate | Cracks at aggregate periphery | Intergranular corrosion of aggregate |
| Aggregate debonded | Aggregate reaction rims (formed in concrete) | Gel in paste cracks |
The laboratory examination can be conducted in four steps:
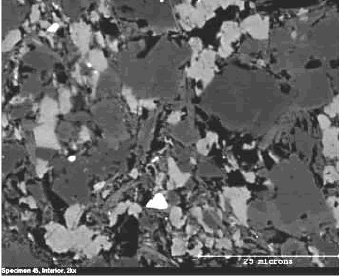
Examine the surfaces for the presence of any reaction products and for the relationship of the cracks in the paste to any deterioration of the aggregate particles (figures 101 and 102). Place particular emphasis on the specimens of the interior portion of the placement. The material of the severely cracked drier surface portion has not expanded so much and may not exhibit so abundantly evidence of the cause of the deterioration. Examine the ends of partial-depth cores and observe whether the fracture plane passes through or around coarse aggregate particles (figures 103 and 104). Fracture surfaces of tested splitting tensile specimens are also useful for studying these relationships (figure 105). Study the aggregate to determine its nature and the evidence of alteration by an AAR. Such evidence may be: (1) rims on the aggregate that seem to make the exterior of the aggregate less permeable; (2) cracks extending out into the paste; (3) intergranular corrosion of either grain boundaries or cements; in extreme cases, the centers of particles (e.g., sandstone) may be hollowed out because the original cement between the sand grains has been corroded by the reaction so that the centers are more friable than the rims; and (4) aggregate particles that have been cracked by deposits of gel and dehydrated gel that occur as rims within and around the particles, often on bedding planes or other partings intrinsic to the aggregate. Report the various types of deterioration observed.
When liquid gels exude onto the surface, saturating the paste, filling the cracks, and oozing from the surfaces, or dehydrated, carbonated gels can be seen as a white deposit, the ASR is in its most easily identifiable phase (see figures 103 and 104). These white deposits are common as rims around coarse aggregate in the paste and the cracks and bedding or foliation planes in the aggregate and as fillings in voids. These deposits are more common with depth. In the near-surface portions of the concrete, the rims may be difficult to see. The rims that occur inside the aggregate are most easily seen on surfaces that have been forced apart by the reaction (i.e., in cracks caused by the reaction (figure 104)). On the surfaces of the cores and on sawed and lapped surfaces, there may be no evidence of rims whatsoever and the only hint of an ASR may be scattered white void fillings of dehydrated silica gel.
Figure 101. Bridge deck.
Note the vertical crack from the surface to a depth of approximately 60 mm where damaged coarse aggregate particles are situated. Coarse aggregate is a quartzose gravel susceptible to ASR.
Figure 102. Extracted core.
Note the vertical crack from the surface to a depth of approximately 60 mm where damaged coarse aggregate particles are situated. Coarse aggregate is a quartzose gravel susceptible to ASR.
Figure 103. ASR in longitudinally reinforced pavement constructed with dark metabasalt aggregate.
Note pattern of cracking on the surface.
Figure 104. ASR in longitudinally reinforced pavement constructed with dark metabasalt aggregate: 100-mm core that fractured on this surface upon removal from the pavement.
Note the dried, white carbonated gel around each piece of aggregate.
Figure 105. Fracture face of splitting tensile specimen: Examine for aggregate fracture and deterioration, as well as secondary deposits.
The most easily detected identifying characteristic of the alkali-reactive carbonate rocks is the microtexture of the aggregate. Invariably, this texture is that of small rhombic crystals of dolomite suspended in a calcite, micrite matrix that contains the fine, particulate, insoluble constituents. This texture may occur evenly throughout the aggregate or may be confined to particular seams and crack fillings. All occurrences of carbonate rock that have been found to be reactive have portions in which this particular texture exists. However, not all dolomitic limestones with this texture expand with sufficient force to cause distress.
If the dolomite rhombs are large enough, they may, in some cases, be observed with a hand lens or stereomicroscope on a lightly etched, finely lapped surface of the aggregate. This surface may be fabricated on a large fragment (e.g., 76 by 100 mm) of the rock or may be a lapped surface produced on a slice of the HCC.
Figure 106. Destructive ASR in pavement.
Photograph by M.C. Thomson, courtesy of PennDOT
Figure 107. Destructive ASR in pavement: Alkali-silica gel in a 2-mm void in lapped slice from the pavement in figure 106 (dark aggregate is siltstone).
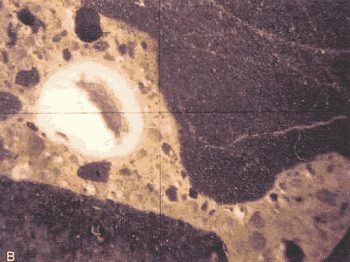
Photograph by M.C. Thomson, courtesy of PennDOT
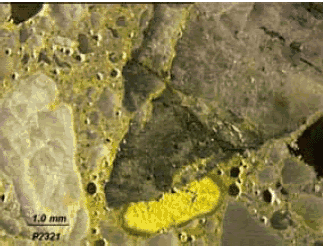
Figure 108. ASR damage expressed on lapped slab (cracks highlighted in yellow, deposits of reaction product highlighted in red).
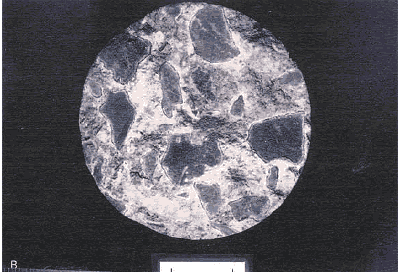
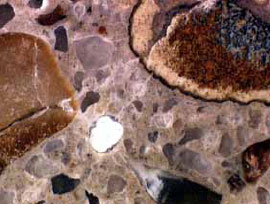
Figure 109. Lapped surface showing type of aggregates and ASR products.
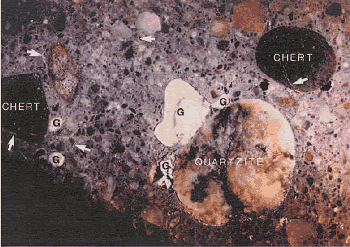
1 inch = 25.4 mm
G = Pocket of alkali-silica gel, arrows indicate gel-filled cracks (field width is 100 mm)
Figure 110. Lapped surface of specimen affected by ACR exhibiting rim and areas of altered paste at corners of aggregate.
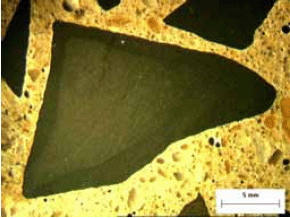
Figure 111. Paste cracking and alteration of paste.
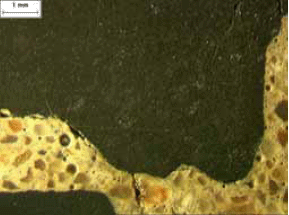
Figure 112. Lapped surfaces of ACR specimen showing aggregate cracking and alteration of paste.
Note the extremely fine-grained texture of the aggregate.
Figure 113. Internal cracking of aggregate particle.
Note the extremely fine-grained texture of the aggregate.
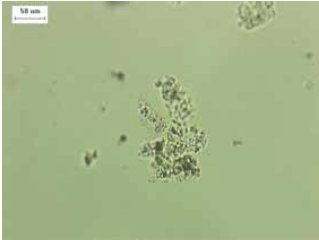
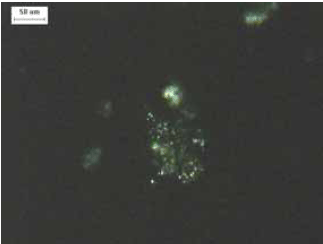
Examples of ASR are shown in figures 114 through 120. Note that the ASR product may exhibit different characteristics depending on its state. Gels will exhibit optical isotropy. The originally gelatinous reaction product can develop a more orderly structure in response to the chemical environment. Such reaction products will exhibit a degree of anisotropy observed as slight to increasing birefringence. Presumably, the isotropic reaction product possesses the capability for continued expansion, whereas the crystallized reaction product probably does not, or does to a greatly reduced degree.
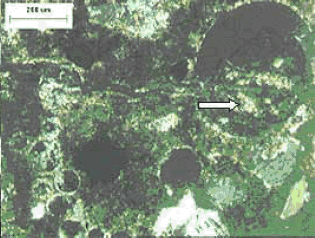
Examples of ACR are shown in figures 121 through 127. The formation of rims is a feature of ACR; however, it is not uncommon with many carbonate rocks and should not be taken as clear evidence of the deleterious nature of the reaction as many rocks form rims without evidence of distress (Mather and Mather, 1991). Localized alteration (carbonation) of the paste adjacent to the aggregate particles can be observed in polished slabs and thin sections. This alteration proceeds from reactions associated with dedolomitization rather than the more common carbonation by atmospheric CO2 (Mather, Buck, and Luke, 1964). In thin sections or polished sections (using SEM), aggregate particles should be examined for the characteristic ACR texture, as well as evidence of corrosion of dolomite crystals. Brucite, hydrotalcite, or other secondary minerals resulting from de-dolomitization may be present (Walker, 1967).
Figure 114. Thin section showing void containing crystallized ASR product.
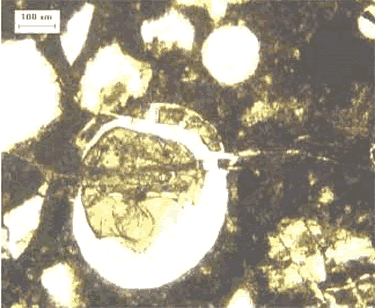
Figure 115. Thin section showing aggregate crack.
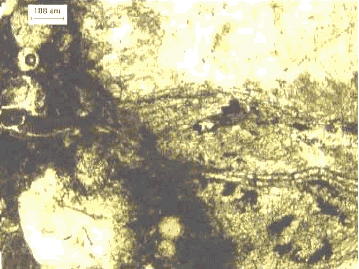
Figure 116. Thin section in plane polarized light.
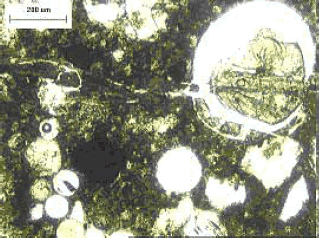
Note that reaction product exhibits birefringence.
Figure 117. Thin section with crossed polars.
Note that reaction product exhibits birefringence.
Figure 118. Backscattered electron image of ASR-damaged concrete.
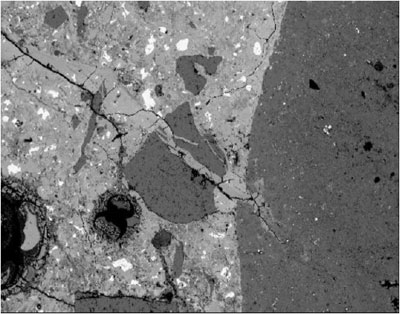
Reaction product-filled crack extends from coarse aggregate particle on right through mortar (field width is approximately 10 mm ).
Figure 119. Optical image of lapped section showing ASR product associated with damaged chert particles.
Field width is 15 mm.
Figure 120. Similar feature in backscattered electron image as associated EDX elemental plots for K, Si, and Ca.
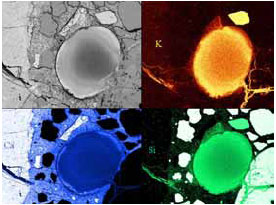
Figure 121. Thin section of ACR rock (lower left of image) and adjacent altered paste in plane polarized light.
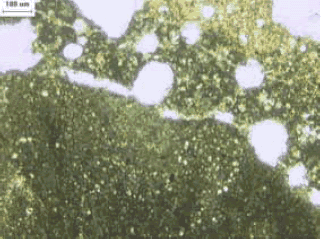
Figure 122. Thin section of ACR rock (lower left of image) with crossed polars.
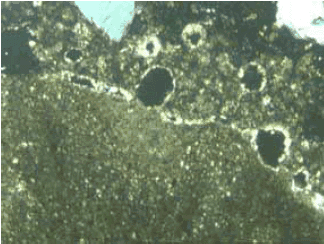
Figure 123. Backscattered electron image of polished thin section showing area of altered paste adjacent to ACR rock in lower left.
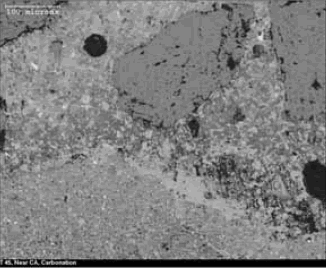
Figure 124. Thin section of fracture in ACR rock at low magnification.
Figure 125. Thin section of fracture in ACR rock at high magnification.
Figure 126. Backscattered electron images of outer rim of reacting ACR rock.
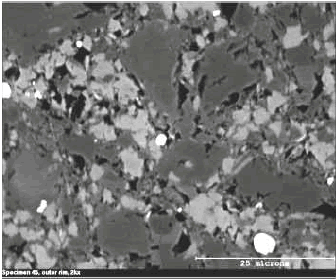
Figure 127. Interior of same particle.
In cases where ASR has caused significant distress, the reaction product is often readily visible. However, in cases with particular aggregates (e.g., granitic rocks), significant distress may have occurred with minimal amounts of gel. In addition, concretes with low distress levels either at an early stage of development or when fully developed may
Figure 128. Powder mount of ASR product in plane polarized light.
Immersion oil index of refraction = 1.532, reaction product index is slightly lower. Birefringence exhibited with crossed polars demonstrates developing crystallinity.
Figure 129. Powder mount of ASR product in crossed polarized light.
Immersion oil index of refraction = 1.532, reaction product index is slightly lower. Birefringence exhibited with crossed polars demonstrates developing crystallinity.
Figure 130. Polished specimen treated with sodium cobaltinitrite solution.
Potassium in secondary deposits in void and paste are stained yellow.
exhibit minimal amounts of reaction product. In cases with aggregates suspected of ASR, but with no readily observable reaction products, the spot tests may help locate deposits of gel. If deterioration is determined to be caused by the expansion of the concrete of the placement and there is no evidence of alkali-silica gels (even when the HCC is examined in thin sections with the petrographic or P/EF microscope), the distress must be the result of a cause other than the ASR. If the aggregate is fine-grained, limey dolomite, the ACR is likely. Discoveries of new reactions will occur only if the petrographer and the client or engineer consider all of the facts with an open mind.
If the alkali-silica gels exist and the major portion of the aggregate is carbonate rock, then a sufficient quantity of chert, opal, microcrystalline quartz, or other siliceous material must be present within the carbonate rock, such as vein fillings, siliceous fossils, or other inclusions.
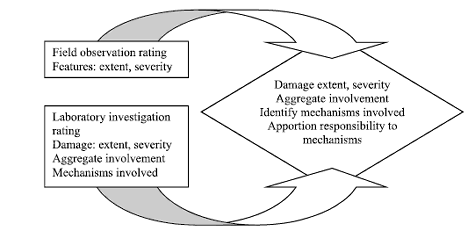
The findings of the laboratory examination should be integrated with the field observations to characterize the condition of the structure and to attribute responsibility among mechanisms (figure 131).
In the evaluation of structures where the noted AAR-related damage is slight or marginal, the age of the structure should be carefully considered. In a younger structure, the reaction may be in progress and consideration should be given to expansion and damage monitoring over an extended period. If affected by ASR, the presence of fresh, unaltered gel reaction product would serve as an indicator of an active ASR condition. On the other hand, if the structure is relatively old (20+ years) or the noted reaction product is carbonated or crystallized (exhibiting slight birefringence), the reaction has probably run its course for the given conditions of the concrete materials and exposure conditions.
Figure 131. Integration of field observations with laboratory investigations.