U.S. Department of Transportation
Federal Highway Administration
1200 New Jersey Avenue, SE
Washington, DC 20590
202-366-4000
Federal Highway Administration Research and Technology
Coordinating, Developing, and Delivering Highway Transportation Innovations
 |
| This report is an archived publication and may contain dated technical, contact, and link information |
|
Publication Number: FHWA-HRT-04-150 Date: July 2006 |
Previous | Table of Contents | Next
It is necessary to calculate, estimate, or determine microscopically the volume of air-free paste in an HCC specimen in order to calculate the specific surface and the spacing factor by means of the equations in ASTM C 457 (see chapter 6).
When the design of the mixture is known and it is fairly certain that all additions of water or other changes in the mixture have been properly documented, the percentage of paste can be calculated from the mixture design by adding the volumes of water and cementitious materials and expressing the volume as a percentage of the total volume of HCC produced by the mixture(ACI 211.1, ACI 211.2, ACI 211.3).
Slight variations in paste content used in the calculations of air-void parameters do not cause much change in the values obtained. Therefore, for ordinary intradepartmental work, for preliminary work, and whenever accuracy of the spacing factor and specific surface is not required, the paste content is estimated. The normal range of paste content is 23 to 32 percent; 27 percent has often been used as a good estimate of paste content in normal concrete (ACI 211.1, ACI 211.3, ACI 221R). The petrographer should use his or her judgment to adjust this figure based on the appearance of the specimen (see figures 61 and 62). If the quantity of the paste appears to be far from normal (see figures 63 and 64), a microscopical determination of the percentage of the paste should be made to permit an accurate determination of the air-void parameters. If an estimate is to be used, the calculations may proceed and the data and method recorded in the notes for the report.
The amount of air-free paste present is most easily determined by making a microscopical determination (linear traverse or point-count method) of the amount of aggregate present. The aggregate occurrence (the sum of the aggregate chords or the sum of the points falling in the aggregate) is calculated by dividing by the total (total traverse length or total number of points) to determine the percentage of the aggregate. Most laboratories using point-count equipment perform paste content determinations concurrently with air content determinations; therefore,separate paste determinations are most often needed when linear traverse analyses are performed. The paste percentage is determined by subtracting the aggregate and the air percentages from 100 percent.
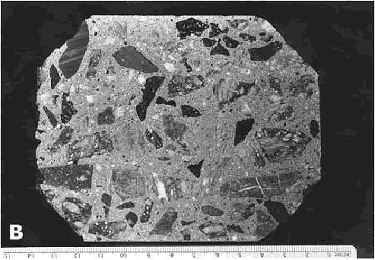
Figure 61. Finely lapped slices of concrete with normal paste content : Rounded to subangular quartz gravel coarse aggregate and fine sand aggregate.
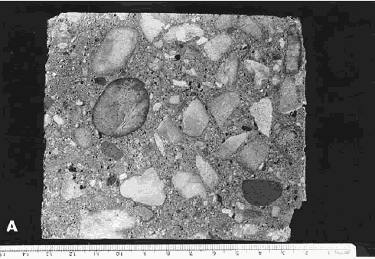
Figure 62. Finely lapped slices of concrete with normal paste content: Angular crushed granite coarse aggregate and fine sand aggregate.
To obtain the same accuracy in a microscopical determination of the aggregate as that of the air voids, at least 1000 occurrences (fragments) of the aggregate must be counted (point count) or measured (linear traverse). To determine the percentage of a substance of which there are only 200 occurrences in the traverse of the surface on which the percentage of air was determined, five such slices would have to be prepared and examined. Examining such a large number of surfaces is often economically impossible, and unless the air-void determination included these surfaces, the air content determined may not be relevant to the paste content. When there are fewer than 1000 aggregate particles along a microscopical traverse, the percentage of paste or aggregate determined should be considered an estimate.
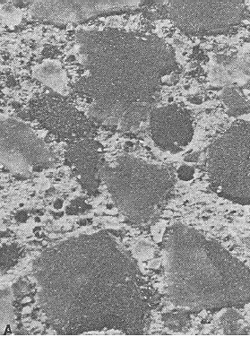
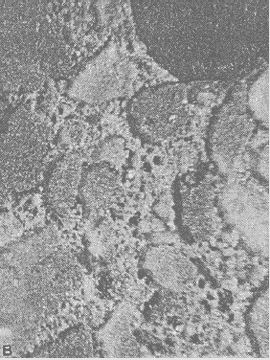
Figure 63. Finely lapped slices of concrete with abnormal paste content: High paste content.
The coarse and medium-sized aggregate is a fine-grained metamorphosed shale, and the fine aggregate is a quartzose sand.
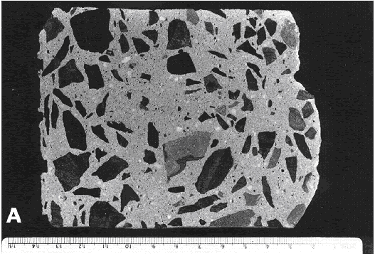
Figure 64. Finely lapped slices of concrete with abnormal paste content: Low paste content.
The coarse aggregate is a granitic gneiss, and the fine aggregate is a river sand.
Paste can usually be distinguished from aggregate on the basis of color, luster, internal structure, and the sort of surface produced by the lapping procedures. However, occasionally, aggregate particles so closely resemble the paste in color, luster, and finely lapped texture that it is possible to miss small corners of coarse aggregates and fragments of sand and be quite uncertain about the exact location of the boundary between these phases. Strangely enough, carbonate aggregate is usually distinguishable by color, luster, translucence, and crystal structure. It is usually the light brown to creamy gray quartz pebbles and sands that are the most difficult to distinguish from paste.
When aggregate particles are lapped in a slice of concrete, they are ground off to the level of the paste and a fine matte surface is produced on the aggregate surface remaining in the slice of concrete (see figures 65 and 66). This matte surface will be a little different for each aggregate
Figure 65. Lapped surface.
The darker line at the top surface represents the lapped, matte aggregate surface.
Figure 66. Flaws in lapped surface.
The darker line at the top surface represents the lapped, matte aggregate surface. This is an illustration of the type of flaw caused by aggregate that is fragile and recognizable by the broken aggregate surface (marked "A" flaws caused by a fragment of aggregate flaking off), and the type of flaw caused by complete or nearly complete loss of an aggregate particle that is recognizable by the shape of the cavity remaining and the texture of the paste surface within the cavity (marked "B" flaws caused by a piece of aggregate falling out). lithology exposed in the surface; however, it is generally sufficiently different from a broken surface or a natural water-worn surface of the type of aggregate for a technician to be able to distinguish a matte-lapped surface from all others. Because of the generally higher capillarity of the paste and the greater hardness of the aggregate, the matte surface on an aggregate particle is usually quite different from the surface of a finely lapped paste. The lower the w/cm, the denser the paste becomes and the more the lapped surface on the paste becomes like the lapped surface on the aggregate. When the problem of distinguishing paste from aggregate becomes difficult, the differences in solubility in weak acid or the differences in porosity indicated by dye absorption can be used to differentiate between aggregate and paste.
The problem cannot be solved by adhering to statements such as: "The paste content calculated from the known mixture proportions is approximately 12 percent higher than the one obtained from the ASTM C 457 measurements" (Pleau, et al., 1990, p. 5). Pleau, et al. called this sort of error "an unavoidable artifact of the measurement process" (p. 6). In their work, no effort seemed to have been made to enhance the paste-aggregate boundary and lessen their error. They used the point-count method, determining paste concurrently with the analysis of the air content. They explained the difference between their mixture proportion and their point-count results by stating that there were errors made in determining the proper outlines of the aggregates when the aggregate occurred close to the surface being examined. In their specimens, the paste seemed to have been more translucent than may have normally been encountered. Reportedly, their operators frequently saw through the paste and counted n aggregate particle beneath. Also, they had occurrences of discolored portions of the paste that appeared to be aggregate particles and thus were counted as such.
Other than the dark blue&green blotchy appearance often seen in pastes containing ground granulated blast-furnace slag, the only such "discolorations" seen in the VTRC laboratory, when studied in thin section, have been determined to be lumps of cement (see figure 67) caused by either exposure of the cement to moisture during storage or an improper batching sequence. The example shown in figure 67 was found in a lump of concrete, commonly referred to as a "cement ball," found tumbling down the discharge chute of a concrete truck mixer.
Figure 67. Knot of cement exposed on finely lapped slice (rounded shape was caused by tumbling in the mixer).

A discussion of the factors that can result in this type of nonhomogeneity can be found in Gaynor and Mullarky (1975). In retempered concrete (see appendix C), some of the aggregate may have coatings of dense, partially hydrated cement. Obviously, counting a cement lump or coating as aggregate in the point-count method will decrease the ratio of paste to aggregate determined. Although Pleau, et al. (1990), found a consistent 12 percent shortage in the microscopically determined paste content in the laboratory-mixed specimens they used, they did not present any evidence that indicated that all paste contents determined microscopically should be increased by such an amount.
The percentage of paste is determined in six steps, as listed in table 16:
|
| CAUTION: Perform the etching procedure after the air-void determinations have been made because the acid will round off the void edges and make the voids appear larger. Therefore, if an acid etching procedure is to be used, determining the paste content must be a separate procedure from the air-void determination. |
Figure 68. Etched slice: Etched surface on concrete fabricated with quartz sand fine aggregate.
Width of image is 10 mm.
Figure 69. Etched slice: Etched surface on concrete fabricated with crushed limestone fine aggregate.
Width of image is 10 mm.
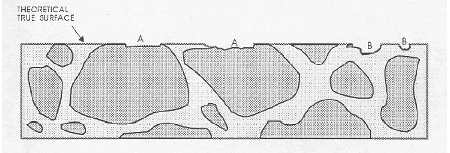
None of these problems should cause errors if you think clearly about the view seen and mentally reconstruct the view that would have been seen if the paste area on the lapped surface accurately indicated the true proportion of the paste present. Avoid errors by allowing sufficient time for the analysis. Figure 70 illustrates some of the flawed and etched artifacts that may be observed in surfaces during the microscopical determination of the paste-aggregate ratio. These surfaces are different from the undercut surfaces discussed in section 5.2.1 (see figure 41). The undercut surfaces have a somewhat similar high relief; however, the features are rounded and there is no way a mental reconstruction of the surface will yield a good estimate of the position of the paste-aggregate boundary. Undercutting must be overcome by proper surface preparation.
% Paste = 100 % minus (% aggregate plus % air voids)
Figure 70. Cross section of surface demonstrating problems of boundary distinction.
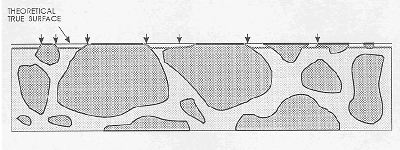
The darker line at the top surface represents the lapped, matte aggregate surface, and the shaded line just below the top represents the etched surface with possible misinterpretations at arrows. Acid-etched surface shows the need for counting as aggregate only the matte-lapped surface of the aggregate.
The percentage of a specific type of aggregate or other substance should be determined when deemed important by the client or the petrographer. Any substance that can be recognized when seen on the surface of the slice as being composed of a particular material can be counted by the point-count method or measured by linear traverse equipment and an estimated volume percentage of the substance can be determined. The accuracy of such determinations is dependent on the frequency of the occurrence of the particles of the substance, as discussed in section 7.1.2.
Substances cannot be distinguished on the basis of size. It is possible to know only that the exposed cross section of an object indicates that the object is large enough to have the particular cross section. The object may be much larger.
Occasionally, the petrographer is requested to determine the relative amounts of coarse aggregate and fine aggregate. If there is a distinct lithologic difference between the two (e.g., a fine-grained greenstone coarse aggregate and quartz sand fine aggregate), an estimate of the percentage of each can be made using point-count or linear traverse equipment. If there is no readily recognizable lithologic difference (most often the case when crushed limestone is used for the fine as well as the coarse aggregate), it is impossible to make a percentage determination of the relative amounts of these materials by readily available optical methods (see section 12.3). The calculation of diameters from chords such as that of Lord and Willis (1951) that are dependent on the spherical shape of the item measured cannot be used for aggregate particles. The distinction cannot be made on the size of the area of the particle exposed on the lapped surface because a piece of coarse aggregate may be almost hidden, with only a tiny corner showing. At present, the available methods include removing the paste with an acid or disaggregating the concrete by freezing with liquid nitrogen and subsequent sieve analysis of the aggregate. Both methods can be confounded-the acid dissolution approach if the aggregate contains a carbonate component and the freezing approach if the aggregate contains unsound or sensitive components.
An experienced petrographer will usually be able to tell by comparison with other specimens of concrete if an unusual amount of either coarse or fine aggregate is present. The original design of the mixture should indicate the sizes intended to be used (see figures 71 and 72).
If the petrographer feels that the aggregate is not sized according to the intended grading, an investigation of the sizes of the materials in the stockpiles can be made. If the sizes in the stockpiles are within specification, the problem may be in the proportioning of the aggregates during fabrication of the concrete mixture.
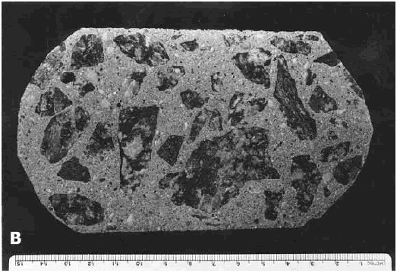
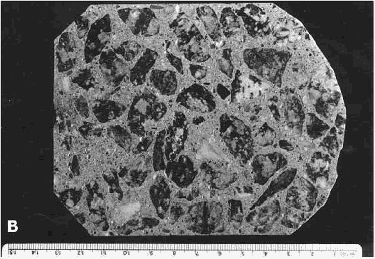
Figure 71. Varying amounts of aggregate size fractions: (A) Concrete fabricated without larger sizes of coarse aggregate.
Figure 72. Varying amounts of aggregate size fractions: (B) Concrete fabricated with coarse aggregate that is larger than what is now considered to be normal for bridge deck concrete.