U.S. Department of Transportation
Federal Highway Administration
1200 New Jersey Avenue, SE
Washington, DC 20590
202-366-4000
Federal Highway Administration Research and Technology
Coordinating, Developing, and Delivering Highway Transportation Innovations
| REPORT |
| This report is an archived publication and may contain dated technical, contact, and link information |
|
| Publication Number: FHWA-HRT-05-038 Date: August 2006 |
Publication Number: FHWA-HRT-05-038 Date: August 2006 |
A number of places in the draft guide present information for which there seems to be some uncertainty as to the applicability or sensitivity to concrete pavements. The following sections identify several of these and present information derived either from literature sources and/or from laboratory work that provide additional information.
The relationship between bleeding rate of freshly placed concrete and the evaporation of water from concrete during the first few hours after placing is critical in the initial curing period to avoid early-aged cracking. The conventional understanding is that when the evaporation rate exceeds the bleeding rate in fresh concrete, a dangerous condition exists that could lead to plastic shrinkage cracking. The most commonly used guidance for general concreting is that when evaporation rates exceed 1.0 kg/m2/h, as determined from the nomograph in figure 1 of ACI 308(31) (and in many other places), definite action to retard evaporation is necessary. An evaporation condition of 0.5 kg/m2/h warrants caution. There appears to be uncertainty in how this same guidance applies to pavement concrete.
Two things need to be evaluated in this section. One is to evaluate how well the ACI nomograph predicts the evaporation rates of bleed water from concrete. The other is to evaluate the bleeding rate of pavement concretes to determine whether the current guidance is still reasonable.
The approach is to use some recent literature that has been developed on the evaporation rate calculation, along with some laboratory work that measures evaporation rates of water from concrete at various stages of maturation from initial casting to some hours after time of setting. This will allow definition of the limits of the nomograph calculation. Bleeding rates of pavement concrete are investigated with laboratory specimens.
Al-Fadhala and Hover (2001) present a comprehensive review of the origin of the ACI nomograph and conducted a rather involved investigation of the accuracy with which it represents evaporation rates from concrete.(32) The calculation is intended only to represent the evaporation rate of water from a free-water surface, so would only be expected to apply to the bleed water of concrete, and not to represent evaporation of water from within the mass of the concrete.
In Al-Fadhala and Hover's(32) investigation, the nomograph was found to accurately represent the evaporation rate from a free-water surface for evaporation rates up to about 0.5 kg/m2/h. Above this point, the nomograph tended to overestimate the rates of evaporation. For example, at observed evaporation rates of about 1.8 kg/m2/h, which was the upper extreme of their investigation, the nomograph overpredicted evaporation by about 50 percent. The authors offered a revised equation to represent the phenomenon, based on an empirical fit of the data.
ER = 0.0565 (eo -ea) - 0.0485V - 0.305 (5)
Variables are defined as in the description of Menzel's equation in chapter 4. The authors comment that neither calculation is particularly reliable when windspeeds drop below 5 m/s.
Analysis of Menzel's equation by calculating and comparing evaporation rates for some trial conditions shows that two variables dominate: wind velocity and concrete temperature. The calculated evaporation rates are relatively less sensitive to changes in air temperature and relative humidity. This would suggest that control of plastic shrinkage cracking should focus around control of concrete placing temperatures and avoiding or protecting against the effects of wind.
An effort was also made to verify the nomograph in this project. Evaporation of pure water and of bleed water from concrete and mortar were measured under variable conditions.
Evaporation rates of pure water were measured from two different container types. One was an evaporation cup specified in ASTM C 156.(18) These are aluminum cups covered with a disc of filter paper and secured by a threaded ring, similar to the configuration of a Mason jar. The cup is filled with cotton balls and partially filled with water. The cotton balls provide a wicking action that keeps the filter paper wet. Evaporation actually occurs from the wet filter paper surface. The surface area of the cup is relatively small, 0.0045 m2. The other device was a somewhat larger (surface area of 0.014 m2) plastic dish half full of water. In this configuration, water was evaporated directly from the water surface.
Experimental conditions were either room temperature (22 °C, 50 percent RH) or a walk-in environmental room (38 °C, 30 percent RH). The windspeed was varied from 0 to 3 m/s. Surface temperature measurements were determined with an infrared thermometer.
Work was done with the C 156(18) evaporation cups in the 38 °C room only. The measured rate of mass loss when air was directed onto the surface at 3 m/s was 2.2 kg/m2/h. The calculated evaporation rate using the nomograph was 0.41 kg/m2/h. The surface temperature was constant at 26 °C. There has been some commentary on the nomograph that the surface temperature should not be used in the calculation because of the evaporative cooling effect, but instead the temperature of the mass of the container (or the concrete) should be used. The temperature of the interior of the evaporation cup was not measured, but the verification ran about 4 h, so there was ample time for this small device to equilibrate with the ambient temperature. If temperature of the interior the cup was assumed to be 38 °C, then the calculated evaporation rate would have been 1.4 kg/m2/h, still considerably lower than the observed value.
When the air was directed 355 mm above the evaporating surface at 3 m/s, the observed mass loss was 0.79 kg/m2/h. Using measured surface temperatures (29 °C), the calculated evaporation rate was 0.62 kg/m2/h. This wind condition approximates the conditions described in ACI 308R(5) for collecting appropriate data for calculating evaporation rates.
The verification was repeated using the plastic dishes. Determinations were made at both the 22 °C and 38 °C conditions with varying windspeed. The comparison of the observed mass loss and the calculated evaporation rate is shown in figure 10.
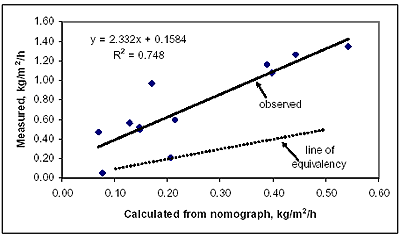
Figure 10. Calculated versus measured evaporation rates. Wind directly on the free-water surface.
In this experimental setup, temperatures of the water below the surface could be determined and were found to average about 2 °C higher than the surface temperature. Using this value causes the calculated evaporation rate to increase slightly and is the basis for the data shown in figure 10.
The results of this investigation suggest that the actual mass loss of water from a surface may be strongly dependent on the details of the wind flow patterns. Perhaps more than simple evaporation is involved when the wind is blowing directly onto the surface. Aerosol formation potentially becomes a significant mechanism for transport of water away from the surface. In the case of the C 156 evaporation cups, the filter paper surface potentially creates a much higher effective surface area than does a simple free-water interface.(18) This same condition might be analogous to a mortar surface as the bleed water just starts to recede below the surface.
To further investigate this problem, water losses from concrete specimens of known bleed rate were measured. Specimens were made at 23 °C, then immediately put into a 38 °C walk-in room at 30 percent RH, with windspeed 3 m/s blowing directly on the specimen surface. Both surface temperature and concrete temperature at a depth of 25 mm were measured using an embedded thermocouple. The 25-mm temperature ramped up slightly during the course of the test (4-6 h), so calculated evaporation rates using this value varied from 0.34 kg/m2/h at the start to 0.75 kg/m2/h at the end. Test specimens were cast either in a 240 by 140 by 75-mm Nalgene® pan or in a 150 mm by 100 mm cylinder mold (150 mm by 300 mm standard strength mold cut down).
Concrete was made with 25 mm nominal maximum sized crushed limestone coarse aggregate (816 kg/m3), natural sand (544 kg/m3), Type I portland cement (350 kg/m3), and a water-cement ratio of 0.37 to 0.45. Air content was about 6 percent and slump about 40 mm (1.5 inch).
Figure 11 shows the mass loss, bleeding rate, and calculated evaporation rates for one of the specimens cast in the Nalgene pan made with a water-cement ratio of 0.45. Note that the bleeding rate and the calculated evaporation rate (using the temperature of the concrete at 25 mm) were very close to the same and averaged 0.5 kg/m2/h (bleeding rate is not really constant, as will be shown in a later section). Mass loss from the concrete averaged about 4 kg/m2/h. This indicates that all of the bleed water and then some of the water from the mass of the concrete were being lost.
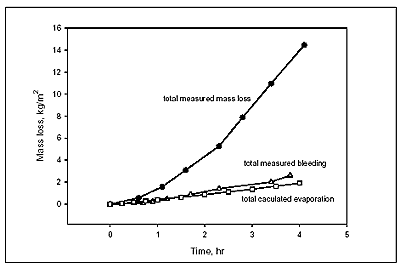
Figure 11. Comparison of total water lost, expected from the ACI 308 nomograph and bleed rate of a 0.45 water-cement concrete.
Figure 12 shows results of another set of determinations on a 0.37 water-cement ratio specimen
cast into the 150 by 100 mm molds. Bleeding rate was not measured. The total evaporation rate in this case was less than in the previous one, but still higher than the rate expected from the nomograph.
The measured mass loss on these specimens was lower than in the previous example, but still higher than the calculated evaporation rates from the nomograph. The lower water-cement ratio specimens lost somewhat less water, presumably because of the lower bleeding rate and somewhat tighter microstructure of the fresh paste.
The conclusion to be drawn from this work is that wind blowing directly onto the surface of fresh concrete causes loss of water considerably higher than expected from the nomograph. This condition is not implausible during construction. Under such conditions, water losses of about twice as much as under laminar flow conditions might be expected.
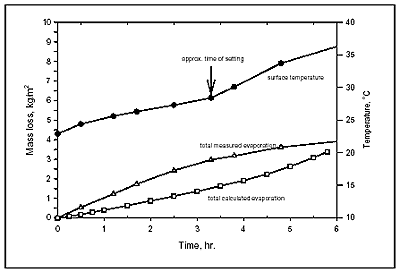
Figure 12. Evaporation of water from a 0.37 water-cement specimen compared with the rate expected from the ACI 308 nomograph. Surface temperature changes approximately track evaporation rates.
It is a common belief that the levels of evaporation that serve as limits in table 1 of ACI 308 are based on past history of typical bleeding rates of concrete.(31) Al-Fadhala and Hover (2001)(32) have verified this in their review of the literature. Apparently the National Ready Mixed Concrete Association report (NRMCA, 1960)typified bleeding in concrete as ranging from 0.5 to 1.5 kg/m2/h.(81) Paving mixtures tend to be of a lower water-cement ratio than is often used for general concrete construction. Some practitioners have commented that concrete for slip-form paving has little or no bleeding, which would appear make it more vulnerable to evaporative effects.
Figure 13 shows bleeding rate for a typical concrete paving mixture, containing 350 kg/m3 cement and a water-cement ratio of 0.43. The test specimen was 28-centimeters (cm) thick. Bleeding stopped between 4.5 and 5.0 h. This corresponds approximately to the time of initial setting of this concrete. Average bleeding rate was 0.19 kg/m2/h, with a peak of 0.33 kg/m2/h at about 2.5 h after mixing.
Two features are significant about this pattern. First, the average bleeding rate is considerably below the most conservative limit in the ACI guidance of 0.5 kg/m2/h. Even for a thicker pavement, in which the total bleeding would be expected to be higher, the standard guidance is probably not sufficient. For example, scaling this bleeding rate by simple proportion up to a 45-cm thickness would result in an estimated average bleeding rate of 0.31 kg/m2/h.
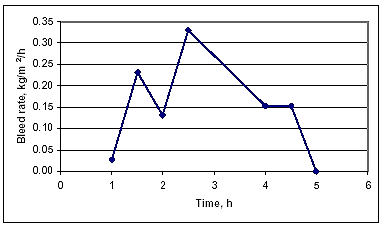
Figure 13. Bleeding pattern of a 0.45 water-cement ratio concrete.
The second significant feature is the extremely low bleeding rates during the first and last part of the bleeding period. During the first hour, the bleeding rate was only 0.025 kg/m2/h. Bleeding similarly approaches a very low rate as time of setting is approached.
While bleeding rate varies as a result of changes of several concrete mixture properties and properties of concrete materials, water-cement ratio is likely to be a major variable influencing bleeding rate. The effect of this variable was investigated among mixtures ranging from a water-cement ratio of 0.35 to 0.50. Test specimens varied in thickness, so the rates are standardized in terms of a unit thickness of concrete, in centimeters, i.e., kg/m2/h/cm. Results are shown in figure 14.
Figure 14. Bleeding rate per unit thickness of concrete (cm) versus water-cement ratio.
The equation in figure 14 is then useful for approximating the average bleeding rate of a given concrete. This number can then be compared to the estimated evaporation rate and a determination made as to the likely danger of cracking due to excessive drying of the concrete. For example, for a 30-cm thick pavement made at a water-cement ratio of 0.45, the estimated average bleeding rate is 0.24 kg/m2/h. Evaporation rates higher than this will constitute a drying hazard.
The conclusion from these determinations is that bleeding rates of paving mixtures, even at their peak rates, may be less than the warning level of 0.5 kg/m2/h. This, together with the apparent tendency of the nomograph to underestimate rates of water loss under some windy conditions, suggests that the current guidance on deleterious drying conditions may be insufficiently conservative for paving. The results of this limited investigation suggest that water losses from the concrete of as much as two times the calculated evaporation rate could occur, depending on conditions. Evaporation rates of as little as 0.3 kg/m2/h may cause critical losses from some concrete if not protected, particularly during the few minutes immediately after placing and the time immediately before time of setting when bleeding rates are considerably lower than average.
Whether cracking actually develops during these periods when evaporation exceeds bleeding depends on the tensile strain capacity of the concrete. Freshly placed concrete of a modest water-cement ratio has a very high tensile strain capacity, so that its reaction to shrinkage strains is largely to settle into a thinner placement. Slip form concrete is a stiffer mixture and may present a much lower tensile strain capacity, so that shrinkage cracks may be more likely to develop soon after placement than in more plastic concrete. However this is conjecture at this point. Just before time of initial setting, concrete has a much lower tensile strain capacity and is quite sensitive to shrinkage-strain cracking.
A reasonable practical approach would be to determine the bleeding rate of the concrete on a particular project. This can be done relatively simply on site as part of preplacing activity. Then use that data to determine deleterious evaporation rates from nomograph calculations. If windspeeds are over about 2 m/s, then an extra level of caution is required. During placing, if surface sheen disappears within the first hour, or before final curing is applied, then that would be taken as evidence that water losses are excessively high. The preplacing determinations and estimation of potential evaporation rates using the nomograph are useful in cautioning the field crews as to the likelihood of a deleterious condition developing.
Time of setting was found to have a significant effect on losses of water from concrete. Presetting loss rates were measured as high as 2-4 kg/m2/h even though very little of this is bleed water, apparently even some of the pore water is still reasonably evaporable. Evaporation rates from specimens covered for various periods then exposed to evaporative conditions showed that evaporation rates dropped dramatically after time of setting. Some results are shown in table 3, in which different evaporation conditions were created by windspeed, air temperature, and relative humidity. The evaporations rates from these specimens were always higher immediately after uncovering the specimen surface than after 1 to 2 h of drying. Evaporation at just 1 hour after time of setting was still strongly affected by wind. This effect was reduced as the mortar aged, which would be expected by the continued consumption of mixing water by hydration reactions.
| Mortar 5 h old (time of setting ~ 4 h) | |||
|---|---|---|---|
| Initial exposure to drying | > 1 hour drying | ||
| Nomograph | Measured | Nomograph | Measured |
| 0.12 0.50 0.30 |
0.13 1.10* 0.70* |
0.12 0.39 0.35 |
0.13 0.74* 0.60* |
| Mortar 24 h old | |||
| Initial exposure to drying | >2 h drying | ||
| Nomograph | Measured | Nomograph | Measured |
| 0.10 0.65 0.46 |
0.12 0.28* 0.16* |
0.10 0.65 0.46 |
0.05 0.10* 0.06* |
| Mortar 4 days old | |||
| Initial exposure to drying | >2.5 h drying | ||
| Nomograph | Measured | Nomograph | Measured |
| 0.19 0.90 0.61 |
0.05 0.08* 0.05* |
0.19 1.25 0.61 |
0.02 0.05* 0.03* |
| *windspeed 2-3.5 m/s directed onto the specimen surface. | |||
The sharp reduction in water loss after time of initial setting can be understood by observing time of setting specimens (ASTM C 403).(71) If specimens are formed and covered to prevent evaporation, then the time of setting apparatus leaves a hole in the concrete after it has stiffened enough to hold its shape. Before time of setting, the hole will fill with bleed water. The water level will remain relatively stable leading up to time of setting if no evaporation is allowed. As the concrete starts to show the higher penetration resistance typical of incipient setting, the water level drops rapidly, and the holes are found to be essentially empty soon after setting. This also corresponds to a rapid loss of sheen on the surface of the concrete.
Measurements of the heat of hydration show that this time corresponds with the onset of rapid hydration of the C3S in the cement. As a result, there is considerably less free mixing water in the concrete that can move to the surface of the concrete and evaporate.
Concrete continues to be susceptible to shrinkage cracks (now called drying shrinkage cracks as opposed to plastic shrinkage cracks that form in plastic concrete) after time of setting, so it is important to start final curing measures as soon as possible after initial time of setting.
Evaporation reducers are marketed as a product that can be of substantial benefit to reducing evaporation from fresh concrete when evaporation rates are high enough to cause concern that plastic shrinkage cracking could develop. On informal inquiry of some users, there seems to be some concern about whether or not these products are useful. There is currently no specification or test method for evaluating them, and no literature could be found on their evaluation. Other users were quite confident of their value, though no data were available.
Three evaporation reducers were investigated in a limited testing program. These are represented by serial numbers 010147, 010149, and 030019. Mortars were prepared according to ASTM C 156.(18) Evaporation reducers were applied at the manufacturer's recommended rate (5 m2/L) immediately after molding, and the specimens were put into a walk-in environmental room at 38 °C, 30 percent relative humidity, with a fan directed on the surface at a speed of 3 m/s. Specimens were weighed periodically and evaporation rates calculated. Control specimens had no evaporation reducer applied. The test was run for 2.5 h. Table 4 presents the results.
| Evaporation Reducer | Mass loss, kg/m2/h | % Reduction | |
|---|---|---|---|
| With Evaporation Reducer | Control | ||
| 010147 | 0.58 | 0.75 | 23 |
| 010149 | 0.49 | 0.88 | 44 |
| 030019 | 0.42 | 1.19 | 65 |
From this limited investigation, it appears as though protecting concrete during the period between placing and applying final curing using evaporation reducers might require repeated applications, depending on conditions. This would particularly apply if the time of initial setting was several hours after placement. A plausible practice would be to use evaporation reducers as a protection against excessive drying, but to repeat applications whenever sheen disappears prior to time of initial setting.
Test methods and a specification for evaporation reducers need to be developed. The limited test results presented above suggest wide variation in performance among products. These products are in common use and potentially have an important role to play in preventing early drying problems.
Existing guidance on time of application of curing compounds cautions against several scenarios that negatively impact the performance of curing compounds. It is not clear that these cautions are relevant to paving concrete or to the newly developed low-VOC curing compounds that are the new standard material used in highway paving. The approach to investigating this issue will be to review current practices in highway paving, then to execute lab work in which curing compounds are applied at different times and under different conditions to test specimens of laboratory concrete.
Manufacturer's guidance and standard guidance all direct that curing compounds be applied to a concrete surface when sheen has disappeared. Most State DOT guidance reflects this, although a few DOTs direct that curing compound be added while there is still some sheen present. ACI 308 distinguishes between disappearance of sheen that results when bleeding stops and the bleed water evaporates, and the apparent loss of sheen that occurs before bleeding stops under conditions in which evaporation rate exceeds bleeding rate.(31)
ACI 308 describes the consequences of applying curing compound at first point of apparent loss of sheen due to high evaporation rates.(31) The curing compound is described as forming a bond with the surface of the specimen, then when additional bleed water rises to the surface, it causes a delamination of a thin layer of surface mortar.
During this investigation, a USACE pavement was investigated that may have represented a case of delamination from early application of curing compound. The pavement was placed during strong drying conditions (not measured, but quite windy). Curing compound was applied within about 15 min of placing due to concern for development of plastic shrinkage cracks. A solvent based (not VOC compliant) curing compound was used. About 3 months later, the pavement had developed some small areas of delamination of a thin layer of surface mortar. Spalled areas were about 15-25 mm across. Petrographic examination showed the damage to be larger than the spalled areas, apparently caused by cracks that had developed parallel to the surface at a depth of about 1-2 mm (See figure 15).
Figure 15. Development of spall as a result of early application of curing compound.
As discussed above, bleeding starts within a few minutes to an hour after concrete is placed and is terminated by the time of setting. Depending on the materials and mixture proportions, some concrete may cease bleeding before this. But, being at least approximately tied to time of setting, loss of sheen may not occur for 2-4 h or more. Therefore, strict adherence to the standard guidance could result in considerable delay to work schedules and decreased productivity. In interviews with paving engineers it was found that it is common practice to apply curing compound sooner than the probable time of setting. In some cases it is common practice under strong drying conditions to apply curing compound as soon as is practical after the paving machine passes.
The work involved six low-VOC curing compounds. One was a wax-based, one was a polyalphamethyl styrene based material, and four were described in product literature as being resins based. Some additional information is summarized in table 5.
| Curing Compound (USACE ID No.) | Description | Moisture loss (ASTM C 156 (18) ) kg/m2 at 72 h |
|---|---|---|
| CMB 000134 | low VOC, wax, 12% solids | 0.50 |
| CMB 000135 | low VOC, resin, 12% solids | 0.49 |
| CMB 000182 | low VOC, resin, 28% solids | 0.34 |
| CMB 010021 | low VOC, resin, 16% solids | 0.09 |
| CMB 010150 | low VOC, polyalpha methylstyrene, 40% solids | 0.63 |
The test conditions varied some as the work progressed and new things were learned about this process, but test protocols fell into five categories, as described below. Details are annotated with the test results (tables 11-16).
Evaporation conditions, as calculated from the ACI nomograph ranged from about 0.34-0.56 kg/m2/h during the first 4 h after placing in the 38 °C environmental chamber. Measured specimen surface temperatures were used in the evaporation rate calculation. During this time, concrete surface temperatures increased slowly from the temperature at fabrication due to the cooling effects of evaporation (25 °C at fabrication to about 30 °C at time of setting). After time of setting, concrete temperatures quickly rose to approximately equal to air temperatures, which resulted in a calculated evaporation rate of 1.24 kg/m2/h.
Three properties were measured to determine the effects of application protocols. One was water loss as indicated by mass change. The second property was water absorption. The water absorption test was patterned after ASTM C 1151 (now withdrawn).(27) The rationale was that if membrane formation was negatively impacted, then the effects of a higher water loss rate in the period after time of setting would appear as a poorly hydrated zone of paste in the top several millimeters of the concrete. The third test was the rebound number (ASTM C 805).(80) The results of this test were found to reflect the development of surface hardness.
Test specimens were cast in 240 by 40 mm by 75-mm Nalgene pans. A paving-type concrete containing 350 kg/m3 of portland cement and a water-cement ratio of 0.45 was used. Time of setting was determined to be 3.9 h at 23 °C. Sheen disappeared from this concrete within about 10 min of the time of setting of a covered specimen. Mass change was measured approximately every 30 min until time of setting, then at a greater intervals with increasing time.
The surfaces were prepared for measuring water absorption and rebound number by brushing with a wire brush to remove any curing compound and any loose material. Both the top and bottom of the specimen were brushed, even though the bottom contained no curing compound. Specimens that were obviously poorly cured tended to lose some surface paste in this process, which probably made the surface absorption appear to be a little better than would have been observed if this could have been prevented. The bottom surface of the specimen was used to indicate the quality of a well-cured surface (this assumed that water losses at the 75-mm depth were minimal).
No delamination of surface mortar was observed. The effect of bleed water developing under the curing compound that was applied before bleeding stopped was (1) to cause a poorly formed membrane containing tears and (2) cracking that appeared to result from shrinkage.
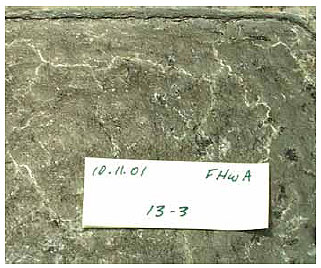
Figure 16. Cracked curing membrane resulting from application before cessation of bleeding.
Plausibly, formation of bleed water under a freshly applied coat of low-VOC curing compound acts as a diluent. Manufacturers commonly caution against diluting curing compound because it might interfere with proper membrane formation. Figure 16 shows development of cracks in a curing membrane that has been applied before bleeding had stopped.
Other details resulting from applying curing compound very early seemed to vary among curing compounds. One curing compound was observed to form a relatively strong membrane that floated on the surface of the bleed water and cracked only when the specimen finally dried. Another effect of early application is that a substantial amount of liquid accumulates on the surface of the concrete. Application of curing compound at a rate of 5 m2/L results in addition of liquid to the surface of concrete of 0.2 kg/m2. If bleed water then appears at a rate of 0.3 kg/m2 in a relatively short interval, which is plausible, then the sum of these two volumes of liquid makes for a substantial amount of liquid on the surface of the concrete, which will be of low viscosity and subject to running or blowing around by the wind.
Water-loss data, water absorption data and rebound number data for the top and bottom surfaces of test specimens treated at various times with the various curing compounds are summarized in tables 6-11. Water-loss data were divided into loss before final curing treatments were completed and water loss between the time of final curing treatments and 7 days. These data are a little confusing, but some patterns do emerge on careful examination.
Water lost before curing treatments were complete would impact the possibility of plastic shrinkage cracking developing. Shrinkage was not measured in these experiments because it was not believed that it could be practically done. Holt (2000) designed and built a relatively sophisticated test apparatus for measuring shrinkage of fresh concrete and related that property to water losses.(70) It can be deduced from her data that for the concrete she was studying, plastic shrinkage cracking could reasonably be expected when water loss before time of setting exceeded about 1 kg/m2. Plastic shrinkage cracking is far too complicated a phenomenon to be reduced to such a simple criterion, but in the absence of a better approach to analyzing the data in this work, hopefully it provides a useful point of reference.
Another reference point for this work is the amount of water expected to be lost during the initial curing period if no action is taken to prevent it. For the specimens and conditions in this work, a water loss of 3.0 kg/m2 can be expected if no curing or protection is applied during the 4‑hour period between placing and time of setting. This value is taken from the average losses in experiments 17-2 and 17-4 (table 9). This value includes approximately 0.6 kg/m2 bleed water and that can reasonably be considered expendable.
| Exp. No. | Conditions before application of final curing treatment | Application rate, m2/L | Mass loss before final curing applied, kg/m2 | Mass loss start of final cure to 7d, kg/m2 | Water absorption, kg/m2 T=top B=bottom | Rebound number, kg/m2 T=top B=bottom |
|---|---|---|---|---|---|---|
| 9-1 | Half curing compound (CC) early, half applied 1.5 h (h), exposed to wind, 38 °C, 30% RH. | 5.8 | 2.09* | 0.93 | T=0.18 B=0.18 |
T=19 B=27 |
| 9-2 | Exposed to wind, 38 °C, 30% RH for 1.5 h, then add CC. | 5.8 | 1.65* | 0.98 | T=0.18 B=0.18 |
T=23 B=23 |
| 9-3 | Covered at 38 °C until TOS, sheen gone. | 4.9 | 0.0 | 1.16 | T=0.36 B=0.21 |
T=11 B=21 |
| 9-4 | Covered at 38 °C for 3.5 h, blotted off remaining bleed water. | 5.6 | 0.18** | 1.31 | T=0.29 B=0.21 |
T=17 B=21 |
*This value includes bleed water lost, estimated to be 0.60 kg/m2 from exp. 12-3.
**Amount of residual bleed water. No evaporative losses, some bleed water was reabsorbed. Surface still had sheen when curing compound applied.
| Exp. No. | Conditions before application of final curing treatment | Application rate, m2/L | Mass loss before final curing applied, kg/m2 | Mass loss start of final cure to 7d, kg/m2 | Water absorption kg/m2, T=top B=bottom | Rebound number kg/m2, T=top B=bottom |
|---|---|---|---|---|---|---|
| 12-1 | Half CC early, half applied 1.5 h, exposed to wind, 38 °C, 30% RH. | 4.7 | 1.54* | 0.93 | T=0.21 B=0.15 |
T=18 B=22 |
| 12-2 | Exposed to wind, 38 °C, 30% RH for 1.5 h, then add CC. | 5.2 | 0.97* | 0.81 | T=0.20 B=0.15 |
T=24 B=25 |
| 12-3 | Covered 3.5 h, 23 °C, bleed water poured off at intervals. | 5.6 | 0.60** | 0.64 | T=0.27 B=0.18 |
T=21 B=29 |
| 12-4 | Covered 3.5 h, 23 °C, small residual bleed water poured off. | 4.5 | 0.32*** | 1.06 | T=0.35 B=0.21 |
T=17 B=26 |
| 12-5 | Bleed water evap for 2.5 h at 38 °C, 30% RH, no wind. | 3.5 | 0.55* | 0.67 | T=0.18 B=0.19 |
T=25 B=24 |
| 12-6 | Covered for 2.5 h at 38 °C, residual bleed water blotted off. | 4.0 | 0.13*** | 1.22 | T=0.28 B=0.16 |
T=22 B=25 |
*This value includes bleed water lost, estimated to be 0.60 kg/m2 from exp. 12-3.
**Bleed water only, no evaporative losses.
***Amount of residual bleed water. No evaporative losses, some bleed water was re-absorbed. Surface still had sheen when curing compound applied.
| Exp. No. | Conditions before application of final curing treatment | Application rate, m2/L | Mass loss before final curing applied, kg/m2 | Mass loss start of final cure to 7d, kg/m2 | Water absorption kg/m2, T=top B=bottom | Rebound number kg/m2, T=top B=bottom |
|---|---|---|---|---|---|---|
| 13-1 000134 wax | Half CC early, half applied 1.5 h, exposed to wind, 38 °C, 30% RH. | 3.5 | 0.77* | 1.58 | T=0.40 B=0.19 |
T=17 B=26 |
| 13-2 000134 wax | Exposed to wind, 38 °C, 30% RH for 1.5 h, then add CC. | 3.3 | 1.22* | 1.04 | T=0.31 B=0.19 |
T=20 B=26 |
| 13-3 010021 resin | Half CC early, half applied 1.5 h, exposed to wind, 38 °C, 30% RH. | 5.8 | 0.41* | 1.57 | T=0.44 B=0.19 |
T=17 B=27 |
| 13-4 010021 resin | Exposed to wind, 38 °C, 30% RH for 1.5 h, then add CC. | 6.2 | 1.02* | 1.61 | T=0.32 B=0.19 |
T=21 B=25 |
| 13-5 000135 resin | Half CC early, half applied 1.5 h, exposed to wind, 38 °C, 30% RH. | 4.8 | 1.33* | 1.15 | T=0.34 B=0.11 |
T=20 B=26 |
| 13-6 000135 resin |
Exposed to wind, 38 °C, 30% RH for 1.5 h, then add CC. | 5.1 | 1.66* | 1.26 | T=0.37 B=0.12 |
T=21 B=25 |
*This value includes bleed water lost, estimated to be 0.60 kg/m2 from exp. 12-3.
| Exp No. | Conditions before application of final curing treatment | Application rate, m2/L | Mass loss 0-4 h, kg/m2 | Mass loss start of final cure to 7d, kg/m2 | Water absorption kg/m2, T=top B=bottom | Rebound number kg/m2, T=top B=bottom |
|---|---|---|---|---|---|---|
| 17-2 | Exposed to 3 m/s wind, 38 °C, 30% RH for 7 days. | - | 3.48 | 2.82 | T=0.47 B=0.26 |
T=12 B=24 |
| 17-4 | Exposed to 3 m/s wind, 38 °C, 30% RH for 7 days. | - | 2.56 | 2.17 | T=0.44 B=not determined |
T=12 B=20 |
Experiments 12-3 (table 7), 23-1, and 24-2 (table 10) represent near ideal conditions in that all bleed water was lost before curing compound was applied, but there was no evaporation loss of any additional water. In 12-3, bleed water was drained off periodically, then curing compound applied when the sheen was nearly gone. In 23-1 and 24-2, enough time was allowed for most or all of the bleed water to drain into a layer of sand on the bottom of the specimen. Evaporative losses during the remainder of the 7 days exposure ranged from 0.64 to 1.2 kg/m2. An unexpected result in these data was that the water absorption data for specimens that had been allowed to set with bleed water reserved showed higher values, which indicates less density in the surface concrete.
Experiments 9-3, 9-4 (table 6) and 12-4 represent conditions when most or all of the bleed water was allowed to re-absorb before curing compound was applied. Evaporative losses ranged from 1.1 to 1.3 kg/m2 after application of curing compound.
| Exp. No. | Conditions before application of final curing treatment | Application rate, m2/L | Mass loss before final curing applied, kg/m2 | Mass loss start of final cure to 7d, kg/m2 | Water absorption kg/m2, T=top B=bottom | Rebound number kg/m2, T=top B=bottom | |
|---|---|---|---|---|---|---|---|
| 23-1 | Covered at 38 °C for 3 h. | 4.8 | 0 | 0.72 | T=0.21 B=N/A* |
N/A* | |
| 23-2 | Half CC immediately, half applied 1.5 h, exposed to wind, 38 °C, 30% RH. | 5.2 | 0.89 | 1.57 | T=0.21 B=N/A |
N/A | |
| 23-3 | All CC applied immediately. | 4.6 | 1.4 (lost in 3 h) |
1.86 | T=0.20 B= N/A |
N/A | |
| 23-4 | No CC. | - | 3.30 (lost in 3 h) |
0.96 (3 hour-7d) |
T=0.46 B= N/A |
N/A |
*Effect of casting on sand made the bottom of the specimen unsuitable for determining water absorption or rebound number.
| Exp. No. | Conditions before application of final curing treatment | Application rate, m2/L | Mass loss before final curing applied, kg/m2 | Mass loss start of final cure to 7d, kg/m2 | Water absorption kg/m2 T=top B=bottom | Rebound number kg/m2 T=top B=bottom |
|---|---|---|---|---|---|---|
| 24-1 | Covered at 38 °C for 3 hour. | 4.7 | 0 | 1.26 | Not determined | Not determined |
| 24-2 | Covered at 38 °C for 4 hour. | 5.3 | 0 | 1.16 | Not determined | Not determined |
| 24-3 | All CC applied immediately. | 4.0 | Not determined | 2.56 | Not determined | Not determined |
| 24-4 | Half CC immediately, half >3 h at 38 °C, 30% RH, wind 3 m/s. | 6.3 | Not determined | 2.93 | Not determined | Not determined |
A couple of things can be deduced from the water loss data during the early hours after placing. One is that even though early application of curing compound seems to have negative effects on the quality of the membrane formation, the presence of the curing compound before the time of setting seems to have some effect of retarding water losses during this period. Experiments 13-1 and 13-3 (table 8) show this effect particularly well. In 13-3, even some of the bleed water was retained. The poor membrane quality shows up as somewhat higher evaporative losses between time of setting and 7 days. This is discussed below in the section on water retention.
The water absorption and rebound number shows the condition of the concrete surface. Surface density is inversely related to water absorption. Results are somewhat complicated. In general, when heavy drying occurs, large water absorption and low rebound numbers result. When moderate water losses occur, lower water absorption and high rebound numbers result. However, an unexpected result occurs when no water losses are allowed through the time of setting, so that all bleed water is reabsorbed prior to application of curing compound. In these cases, water absorption values were typically a little higher and rebound numbers were typically a little lower. The conclusion is that some water loss during the initial curing period results in some compacting of the solids of the concrete's surface zone. If this occurs without plastic shrinkage cracks, then there may be some benefit to the phenomenon. However, the balance point between too much evaporation and resulting cracking and a small amount of evaporation and a useful densification of the concrete may be a little too sensitive to warrant engineering this condition into a pavement placement.
In conclusion, the following guidance appears to be appropriate.
The purpose of using curing compounds to cure concrete is to retain sufficient water in the concrete that physical properties develop adequately in the time required. Whether a curing compound application retains sufficient water under a given set of climatic conditions is strongly affected by two properties: the basic impermeability of the material making up the compound and the amount of application (basically the thickness of the membrane). Guidance on both of these is somewhat varied. The importance of these properties will be evaluated by using some literature that has been found since the interim report was written, by comparing practices used by State DOTs and other agencies, and by evaluating some laboratory tests on concrete specimens. The test method for determining the inherent water retention properties of curing compound is quite variable among laboratories, to the point that serious buyer-seller disputes sometimes develop. The test method is investigated with laboratory work, with the intention of recommending improvements that might reduce this variation.
When curing materials fail to perform adequately in a drying environment, the drying only affects the near-surface zone of the concrete and is usually thought to be confined to the upper 50 mm of concrete. The conventional understanding of the problem is that hydration ceases when the relative humidity of the concrete drops below 80 percent. The effect is to inhibit development of physical properties because of inadequate hydration of cement. Cracking can also occur.
Physical properties affected are strength and abrasion resistance. There is some indication that they can be recovered with water derived from rainfall subsequent to completion of the structure, if such water is available. The position held by T. C. Powers is that water retention is necessary to develop properties only to the point of meeting immediate needs, then additional curing can be derived from natural sources.(83) Aside from strength and abrasion resistance is the issue of drying shrinkage cracking. The amount of drying shrinkage in concrete has been shown not to be strongly related to extent of curing. In fact there is some thought that excessive hydration contributes to increased drying shrinkage. But, the effects of drying very early may not exactly follow the same rules. The consequences of drying shrinkage are potentially related, at least in part, to the rate of drying (creep effects). As shown above, concrete loses water by evaporation very rapidly before time of setting, but slows down substantially after time of setting. Even this slower evaporation rate has a time dependency to it. Concrete dries faster immediately after setting than it does several days after setting. This was demonstrated above under the discussion of evaporation of water from concrete. Thus, if absence of adequate water retention occurs early, then the consequences are likely to be greater than if it occurs later.
There is not much information or research on the subject of exactly how much water retention is required during the final curing period. The current requirements for curing compounds vary from a high value of 0.55 kg/m2 at 3 days (ASTM C 309(23)) to low values of about 0.25 kg/m2 at 3 days (some State DOTs) and 0.31 kg/m2 at 7 days (USACE CRD-C 300)(84). It is difficult to determine how these limits were developed. During the period when much of the research that focused on developing curing compounds occurred, the approach to evaluating various products was to cast 150 mm by 300 mm cylinders and after being stripped from molds, coat them with curing compound. Strength relative to specimens cured in water or fog was the evaluation criterion. Abrasion resistance and water absorption are mentioned in the literature as relevant properties, but most of the results presented emphasized strength. No single value was reported as critical, but if one averages across several of the results in the major publications, a value of around 0.6 kg/m2 emerges.
No data or discussions were found in the literature supporting the lower numbers used by some agencies. It seems likely that these were developed as a response to the commonly held belief that curing operations are mostly inadequately performed, both in the performance of the curing compound and the attention to detail with which it is used. The lack of confidence in the curing compounds may stem from the huge uncertainty in the testing of products for water retention. ASTM C 156 is the recognized standard, but some State DOTs have developed variants of the method. Information on this will be presented below.(18)
Some information on the effects of water losses on near-surface properties can be derived from concrete experiments done in this project. The experimental protocol was described in the "Time of Application of Curing Compounds" section. Some test results are from those data, but some additional data were also generated separately and reported in this section of the report.
As above, water absorption and rebound number are metrics for near-surface condition. Water loss during the period after application of final curing is the principal independent variable, but losses during the period before application of final curing varied widely (0-3.9 kg/m2) and were included in the analysis. Multiple linear regression was the statistical tool used to evaluate the effects of losses during these two curing periods on the surface properties of water absorption and rebound number. Loss during the initial curing period was found not to be a significant variable in the analysis of either water absorption data or rebound numbers. This indicates that losses during the initial curing period do not have a major effect on the measured near-surface properties developed during the final curing period, at least for the small laboratory specimens used in this work. Plausibly, large concrete placements would have developed some plastic shrinkage cracks that would increase the water absorption. The effects of water losses after curing compound application on surface properties appear to be linear with moderate scatter. Figures 17 and 18 illustrate the effects.
Figure 17. Rebound number of concrete surface versus water loss in final curing period (7 days).
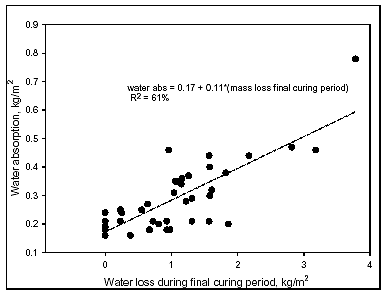
Figure 18. Surface water absorption versus water loss during the final curing period (7 days).
These results show that water retention appears to have a perceptible effect on near-surface properties, even down to very low values of water loss. However, scatter in the data makes it very difficult to resolve the effects, as measured by these two properties, at values of water loss of less than 1 kg/m2 at 7 days. In other words, even though the effects appear to be linear and continuous throughout the range, it would difficult to reliably distinguish a concrete that lost 0.3 kg/m2 from one that lost 1.0 kg/m2 of water using these methods. Predicted water absorption at a water loss of 0.3 kg/m2 would be 0.20 kg/m2 and rebound number would be 23. For water losses of 0.55 kg/m2, water absorption would be predicted to be 0.23 kg/m2 and the rebound number would be 22. These effects are difficult to resolve experimentally and may not be perceptible in practice.
White and Husbands (1990)(85) used ASTM C 1151(27) to study the effects of different water-loss properties of curing compounds on the near-surface zone of mortars. Their objective was to determine whether the USACE's more restrictive requirement of 0.31 kg/m2 at 7 days actually resulted in a measurable improvement in performance over the requirement in ASTM C 309 of 0.55 kg/m2 at 3 days.(23) In their study, they used both curing compounds as supplied by the manufacturer and curing compounds they engineered to give target water-loss properties by dilution. This dilution was executed with manufacturer-supplied solvent thus avoiding potential interactions. Water-loss values ranged from 0.28 to 1.40 at 3 days. Specimens were cured as in USACE test method CRD-C 300 (38 °C, 30 percent RH, 4 m/s wind).(84)
White and Husbands(85) were unable to detect any deterioration in performance until losses exceeded 1 kg/m2 at 3 days. They concluded that there was no evidence in the test results to support the continued requirement of 0.31 kg/m2 at 7 days and recommended that the USACE should adopt the less restrictive requirement in ASTM C 309 for curing compounds.(23) This has been done for most USACE construction except for airfield pavements. The change has not been made there because the proponents of the guidance for airfield pavements are of the belief that pavements are under more stress for water losses than most concrete and that a more restrictive than average requirement was in order.
The results reported in this work showing effects of water losses in the final curing period on water absorption and rebound number show a more general, apparently linear, trend over a wider range of water-loss values than reported by White and Husbands.(84) The slope of this relationship suggests that the differences expected for a hypothetical decrease in water loss from 0.5 to 0.25 kg/m2 would be about 1.2 on the rebound number and 0.025 kg/m2 on water absorption. These are small effects, probably undetectable above experimental error and probably not perceptible in field concrete, given all of the other variables.
The conclusion is that water losses do appear to have an effect on the near-surface zone, as measured by at least two procedures, but that the practical effect of relatively small changes in performance, as is represented by differences in various curing compound specifications, is difficult to see. In the opinion of one technical representative of a curing compound manufacturer interviewed during the information gathering phase of this work, the time of application of a curing compound is far more important in determining performance of curing compound than is performance in the water-retention test.
The selection of a limit on the water-retention property of curing compounds may be influenced more by philosophical considerations than by empirical evidence. The approach seems to be that problems with curing compounds (e.g., variable properties, errors in application rate) are the basis for many curing problems, so that requiring more stringent properties is a way to insure that the performance of the material is robust to these problems.
A couple of practical issues affect this. One is that imprecise water-loss test methods make it very difficult to determine exactly whether a curing compound is meeting a limit or not. If the limit is set at the highest tolerable level commensurate with good performance, then the manufacturer has some space to work with in over-designing a product so that testing errors do not threaten rejection. At least one major manufacturer commented, when interviewed on this subject, that his company does not compete in the paving market because of the intense contentiousness involved with specification-compliance issues. Another practical problem is that curing compounds that meet very low water-loss specifications may be difficult to work with. Within a given product line, water-retention performance is commonly engineered by adding or subtracting vehicle solids. Having very high solids content makes a material viscous and could make application by mechanical spraying difficult. Low VOC materials also present this problem.
During the course of this study, there was the opportunity to work with ASTM C 156 from a beginner's viewpoint.(18) During the last several years, all USACE personnel experienced in this test method were lost without opportunity to retain their capability. This required a totally new learning of the method, which may have resulted in some useful insights.
The ASTM C 156 method directs that specimens be placed in the curing cabinet after they are fabricated and left uncovered under the full evaporation conditions of the test until the sheen disappears before applying curing compound.(18) One of the most difficult things for the new user to learn is the point at which the sheen on the test specimens disappears. There are some supplemental instructions in C 156 on verifying this, but there is still quite a bit of uncertainty on this point to the novice user of the method.(18)
A small study was executed to investigate this detail of the test method involving three curing compounds. Time of application was systematically varied from about 1 h to 3 h after fabrication. The mortar used reached initial set in about 2 h. Application rate of curing compound was also varied. Test results were analyzed by multiple linear regression using water loss at 3 days as the dependent variable and application time and application rate as the independent variables. Both variables were found to be statistically significant. The following equations were developed for the three curing compounds, representing water-loss rates (kg/m2) at 72 h.
WaterLoss (CuringCompound 1) = 0.25-0.34* time + 0.18* appl.rate R2 = 0.85 (6)
WaterLoss (CuringCompound 2) = 0.60-0.31* time + 0.19* appl.rate R2 = 0.86 (7)
WaterLoss (CuringCompound 3) = 0.55-0.24* time + 0.06* appl.rate R2 = 0.43 (8)
Units of measure for time and appl.rate are h and m2/L, respectively. The low R2 of the third equation suggests a large random error. This probably is not true, given the residuals, but rather a consequence of some nonlinear effects. The data in this equation covered a much smaller range of evaporation rates. The cause of this effect was not further investigated.
The first two equations are very similar. The positive sign on the application rate coefficient is due to the convention for reporting application rates (m2/L), so that a high number represents a small amount of curing compound. In a hypothetical situation where time of application was changed from 1.5 h to 2.0 h, the change in measured evaporation rate would be 0.17 kg/m2 in the first equation, 0.15 kg/m2 in the second, and 0.12 kg/m2 in the third. This source of error could possibly be removed in a single laboratory by standardizing time of application for a given mortar recipe, but this is plausibly a significant source of between-laboratory error. It is easy to see how large between-laboratory variation could arise when each laboratory is using its own mortar recipe and may be interpreting the instructions on cessation of bleeding a little differently.
A potentially better way to improve water retention is to require a higher application rate (or more applications) of a relatively weak curing compound rather than insist on extremely conservative acceptance limits.
A demonstration of this concept was executed in the laboratory using a curing compound with a relatively low solids content and a water retention (C 156(18)) that, at 0.49 kg/m2, was close to the 0.55 kg/m2 limit in C 309.(23) Application rates were 2.6, 5.4, and 9.7 m2/L and no curing compound. The test specimens were same as used in the work on curing compounds described above. Water-loss values in concrete are not expected to be exactly the same as in mortar, but they should be correlated with the results from mortar tests (C 156(18)). Results are shown in figures 19-21.
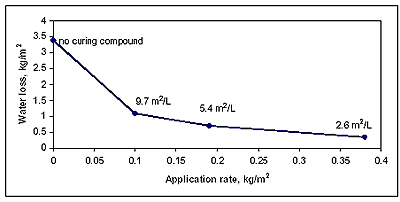
Figure 19. Water loss at 72 h versus application rate of curing compound. The more conventional representation of application rate (m2/L) is annotated by each point.
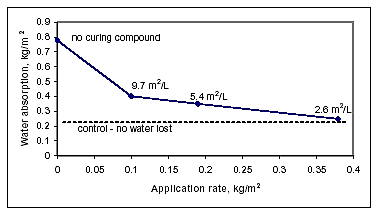
Figure 20. Surface water absorption versus application rate of curing compound.
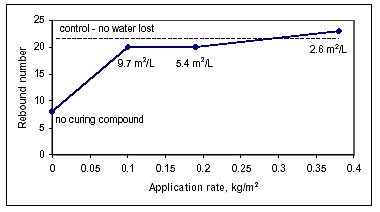
Figure 21. Rebound number versus application rate of curing compound.
These results show that a relatively high level of performance can be attained by increasing the application rate of a relatively weak curing compound. In this case, the curing compound had to be applied in two coats to prevent too much liquid from collecting on the surface at one time.
Losses of too much water during the final curing period have been shown to negatively impact the quality of the near-surface zone of the concrete, as measured by water absorption and rebound number. Some guidance on water-added and sheet curing methods contains provisions for correcting for drying events during the final curing period. The practice is that if dry concrete is discovered during the final curing period, the problem is to be fixed and curing extended. The question is whether surface properties are recoverable upon reapplication of water. This could also be an important question for concretes cured with too light a curing compound application.
Four tests were run to examine this question. All were performed using the 0.45 water-cement ratio concretes as described above (see subheading of "Time of Curing Compound Application").
In conclusion, it appears that there is substantial capacity for concrete that has dried out early in its hydration history to recover, at least as indicated by surface density-type measures. Drying shrinkage, on the other hand, is known to be only partially recoverable (as discussed in Mindess and Young (1981)(78), and other concrete texts). The same may be true for surface density, but it does not appear to be true within the limits of the experiments done in this work.
Drying time of curing compounds can be a practical problem in the field, particularly when environmental drying conditions are not favorable. The current specification limit for drying time is 4 h under the moderately high evaporation rates defined in test method C 309.(23) The problem can be particularly acute with use of low-VOC curing compounds. The effect of drying conditions on drying time of some low-VOC curing compounds was investigated with laboratory specimens. The purpose of this analysis is to determine whether a simple calculation based on the evaporation-rate nomograph can be developed for estimating drying times under poor evaporation conditions. Six low-VOC curing compounds were included. Drying conditions varied from 0.02 kg/m2/h (cold, high humidity, no wind) to 1.0 kg/m2/h (38 °C, 30 percent RH, 2.5 m/s wind). The following equation reasonably represented the drying times over this range.
Drying Time = 1.04* (evaporation rate)-0.67 (9)
where the evaporation rate is as calculated by the ACI 308 nomograph, assuming the surface temperature is equal to the air temperature.(31) Figure 22 shows the relationship between predicted and observed drying times.
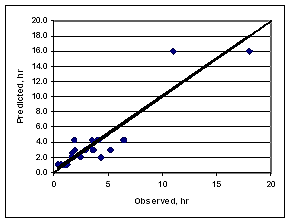
Figure 22. Comparison of calculated versus measured drying times for six curing compounds under a range of drying conditions.
This is not a highly accurate calculation and cannot resolve drying time effects of 1-2 h or less. But the calculation does appear to have some value in helping to anticipate approximate effects of poor drying conditions on a specific construction site or for determining whether seemingly excessive drying times on a project are out of the ordinary and possibly due to a defective product or are attributable to poor drying conditions.
Tined and grooved surfaces contain a considerable amount of vertical or near-vertical surfaces. Curing compounds that tend to sag when applied to vertical surfaces will likely perform poorly because the compound will tend to run into the low spots of the tined pattern. To investigate this, three curing compounds were evaluated for their tendency to sag. No standard test method for this property was known to exist, so an ad hoc method was constructed.
The test was performed on 140 by 120 mm hardened concrete specimens. Specimens were soaked in water for 1 hour, then surface-dried with a towel and in air for about 10 min. Four specimens were turned on edge so that the surface to which application was to be made was in a vertical position. Curing compound was sprayed onto the specimens at four different application rates, ranging from about 15 m2/L to about 5 m2/L. Specimens were left for about 5 min to detect any delayed sagging. Curing compounds were chosen for this evaluation for their apparent viscosity: one appeared to have the approximate viscosity of water, another was of intermediate viscosity, and a third was of very high viscosity.
The low-viscosity material sagged at an application rate of 16.8 m2/L, the intermediate-viscosity material sagged at between 4.6 and 6.7 m2/L, and the high viscosity material did not sag at 5.0 m2/L (no higher application was attempted).
The interpretation of this result is that the low viscosity material should be applied in three or four coats, the intermediate viscosity material in two coats, and the high viscosity material in a single coat.
After this work was done, it was discovered that the Texas DOT (TxDOT, 1998) has viscosity and sagging requirements for curing compounds to be used on grooved pavements.(86) They appear to be using proprietary testing equipment, procedures, and guidance based around this to set their requirements.
Existing methods for estimating curing compound applications involve indirect measurements. One involves bookkeeping on the amount of materials used and the surface area covered. Another involves measuring flow rates through delivery nozzles and rate of movement of the application equipment and then calculating the average application rate. Both of these procedures should give good estimates of average coverage, but neither is probably strong in detecting localized irregularities in application.
Three methods were investigated that should be more sensitive to local irregularities in curing compound application: direct measurement of mass of application, infrared measurements, and visible light reflectance. A report of these results was published during the execution of this project (Poole, 2001).(87)
Direct measurement of curing compound application by weighing sampling devices placed in the path of the curing compound application equipment is plausible. A typical application rate for curing compounds is 5 m2/L. At this rate, a 10- by 10-cm coupon would then receive 2.0 grams of curing compound. To verify curing compound application to within 10 percent accuracy, one would need to measure the mass of application to within 0.2 grams (g) of wet curing compound. These limits are reasonably attainable, even with field usable balances. However, a significant source of error is in the loss of solvent due to evaporation between the time when the curing compound is applied and the sampling coupon retrieved for weighing. Under relatively severe drying conditions (e.g., 1 kg/m2/h) 0.8 g would evaporate in 5 min, assuming the evaporation rate follows Menzel's formula for evaporation of water from a free-water surface. Even under less intense evaporation rates, sizable measurement error could occur unless considerable attention is paid to collecting the sample and protecting it from evaporation relatively quickly.
One solution to the evaporation problem is to measure dry mass. However, since curing compound contains 70 to 85 percent solvent, a somewhat larger sample would be required to collect enough material to give a precise measurement on the dried material. A 10 by 10 cm sampling device would contain from 0.3 to 0.6 g of dry material at the above described application rate and solvent content. This procedure would be easily done in a laboratory setting, but probably would be awkward in a field setting because of the necessity to dry the material to constant weight, need for a constant temperature oven, and the need for a relatively precise balance to weigh the relatively smaller amounts of material. This is basically a plausible method, but considerable care would be required to eliminate sources of error. It is the only method that would appear to work on nonpigmented curing compounds.
The concept behind this technique is that concrete that has a poorly formed or thin coat of curing compound will allow more water to evaporate that concrete on which a well formed and adequately thick curing compound has been applied. This difference in evaporation would then result in a surface temperature difference that could be detected by an infrared thermometer or an infrared camera. The plausibility of this approach was examined using laboratory specimens. Three mortar specimens were prepared according the ASTM C 156.(18) No curing compound was applied to one, and curing compound was applied to the other two at a rate of 5 m2/L at different application times. If useful temperature differences could be demonstrated under these conditions, then the concept could be further investigated for its ability to detect more subtle variations in treatment. The specimens were exposed to C 156 conditions (evaporation rate of 0.6 to 1.1 kg/m2/h) and surface temperatures measured with an infrared surface temperature thermometer.(18) Results are shown in figure 23.
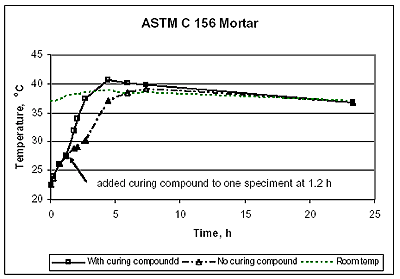
Figure 23. Effect of curing compound application on concrete surface temperature.
A measurable temperature difference was observed. The temperature of coated specimens rose above the temperature of uncoated specimen almost as soon as the curing compound had dried (about 2 h after specimen fabrication), reaching a maximum of 4 °C after 5 h. However, this temperature difference persisted only for a short while, becoming indistinguishable by about 7 h.
The conditions of this experiment were relatively simple and did not include the effect of sunlight. Incident radiation might tend to obscure the observed temperature effect, particularly with white pigmented curing compounds. The high level of reflectance of these materials would tend to have the opposite effect on surface temperature relative to the evaporative effects. This same effect would not appear to apply to clear curing compounds.
Given the relatively small temperature and transient difference that was observable under relatively high levels of evaporation, this technique does not appear to have promise for general field use, given the complicating effects of sunlight, and variable evaporation conditions that might exist there.
As discussed above, visual examination is a common method for verifying application of white pigmented curing compound. The purpose of this investigation was to give this practice some quantitative basis. The investigation was conducted on fresh mortar specimens and on black paper specimens coated with different levels of a white pigmented curing compound (resin based).
The mortar specimens were 10.2 cm in diameter and 5 mm thick. The mortar was proportioned as in ASTM C 156.(18) Curing compound was applied using a paint sprayer to four specimens at variable application rates that gave a visual effect varying from relatively grey to relatively white. Actual application rates were then determined by weighing the specimens. Application rates were 3.2, 5.4, 7.9, and 15.2 m2/L. An application rate of 5 m2/L is commonly cited by manufacturers as being appropriate. These four specimens were used to develop a visual standard curve. Three more specimens were coated with variable amounts of curing compound and treated as unknowns. An estimate of the actual amount of the application was made by visual comparison with the standard curve. The person making the comparison did not know the actual application rate.
Figure 24. shows photographs of the specimens. Table 12 shows the comparison of the actual and estimated application rates. The visual estimation was within about 2 m2/L of the actual application rate.
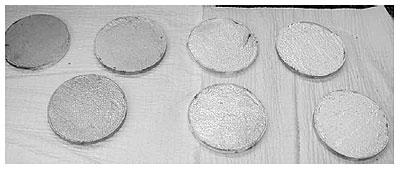
Figure 24. Fresh mortar specimens with variable applications of white pigmented curing compound. The top four specimens contained 15.2, 7.9, 5.4, and 3.2 m2/L (L to R). The bottom 3 specimens were treated as unknowns (see table 12).
| Actual application rate (m2/L) | Visually estimated (m2/L) |
|---|---|
| 12.5 | 9 |
| 6.5 | 5 |
| 3.8 | 3 |
The experiment was repeated using black construction paper glued to a stiff cardboard as the sampling device. The rationale for this variation was that the black background might provide a better contrast for visual estimation. If this is true, then a test method based on examination of paper coupons might reasonably be developed involving dispersing the coupons on a concrete surface before application of curing compound, and then collecting them for analysis.
Figure 25 is a photograph of the specimens. Table 13 shows the comparison of the actual and estimated curing compound application.
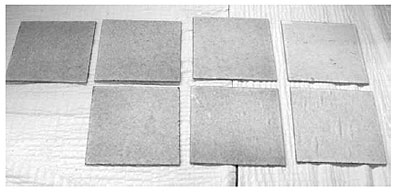
Figure 25. Black construction-paper specimens with variable applications of white pigmented curing compound. The top four specimens contained 10.1, 7.5, 5.9, 4.5 m2/L (L to R). The bottom 3 specimens were treated as unknowns (see table 13).
| Actual application rate (m2/L) | Visually estimated (m2/L) |
|---|---|
| 4.2 | 4 |
| 6.1 | 7 |
| 9.2 | 6 |
The enhanced contrast of the black paper specimens relative to the mortar specimens was not conspicuous when the mortar specimens were fresh, since they were also very dark. However, the mortar specimens containing light applications of curing compound tended to show an increase in whiteness when the surface dried, which tended to reduce the contrast on these specimens.
Reflectance is a measurement commonly used in the paint industry to measure degree of whiteness (ASTM E 1347).(88) It is also a specification-requirement test in ASTM C 309.(23) A portable reflectometer was used to measure the reflectance of the specimens made in the experiment described above. Figure 26 shows the graphical representation of the reflectance versus curing compound application of the "standard" specimens. A nonlinear curve was fitted to the data and used to calculate the curing compound application of the unknown specimens.
Table 14 shows the results of the comparison. The average accuracy of the three determinations is within 15 percent.
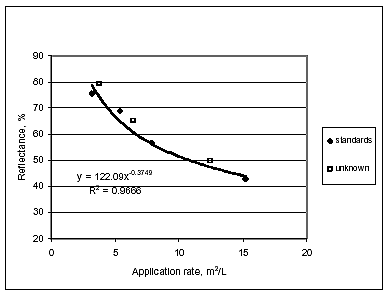
Figure 26. Reflectance versus application rate for white pigmented curing compound applied to fresh mortar at different rates. Data points represented by open symbols were treated as unknowns.
| Actual application rate (m2/L) | Estimated from Reflectance (m2/L) |
|---|---|
| 12.5 | 11.0 |
| 6.5 | 5.3 |
| 3.8 | 3.2 |
Figure 27 and table 15 show results obtained using the black-paper specimens. Two of the three unknown determinations were accurate to better than 10 percent of the true value. The other was off by 33 percent. This may be a statistical outlier, but there is insufficient replication to conclude this definitively.
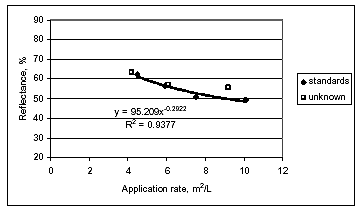
Figure 27. Reflectance versus application rate for white pigmented curing compound applied to black-paper specimens at different rates. Data points represented by open symbols were treated as unknowns.
| Actual application rate (m2/L) | Estimated from Reflectance (m2/L) |
|---|---|
| 4.2 | 4.0 |
| 6.1 | 5.7 |
| 9.2 | 6.2 |
Of the methods investigated, only the direct weighing appeared to be reasonably suited for non-pigmented curing compounds.
The visual estimation of white pigmented curing compound appears to give reasonable results when a standard set of specimens is available for comparison. The visual detection limit (difference detectable in a side-by-side comparison) appears to be about 2 m2/L. The sensitivity of this estimation probably would be substantially reduced if this frame of reference were not available, particularly if spatial variation in application rate was gradual. However, it is clear from this work that a concrete that is noticeably grey on visual examination is probably substantially undercoated, perhaps containing only half of the specified application rate.
The portable reflectometer appears to be a good tool for use in a method for quantitatively measuring curing compound application. The field portability of this instrument allows spot checking with minimal setup requirements. The instrument is battery operated and measures 10 by 15 by 5 cm. It measures reflectance on a spot approximately 2 cm in diameter. One approach to field quality assurance would be to develop a standard curve using job materials and then determine a reflectance value that corresponds with the desired application rate. Then that reflectance could be used as a criterion for evaluating the quality of application of curing compound in a field situation.
In conclusion, visual estimation of the application rate of white pigmented curing compound can be useful where a suitable reference comparison is available. Visual estimation is probably also reliable to detect areas of very low application rate in close proximity to areas of proper application rate. However, visual estimation is not a strong method for detection of low application rates when the under-application is slight or the low-application membrane is uniform. Measuring reflectance with a field reflectometer provides a useful tool for objectively determining subtle variations in application rates.
Specification on the length of the final curing period has traditionally been prescriptive in format, and the more recent trend is toward performance-based specifications. Requiring curing for a fixed time interval is the usual prescriptive specification. This type of specification is still quite common with State DOTs. The advantage of fixed time interval requirements is that interpretation and enforcement are relatively simple. But, because of the simplicity of this type of specification, the requirements must be somewhat conservative and therefore may not be representative of actual onsite conditions. Rates of development of the physical properties of concrete vary widely, depending on materials, proportions, and temperature. Performance specifications typically take the form of requiring curing until a certain state of development of one or more physical properties is reached. Strength is the most common physical property used, but at least one agency has been reported to use surface water absorption as its criterion for some concrete.
None of the standard guidance mentions the effect of using pozzolan, even though it is common knowledge now that such concretes typically gain strength more slowly. A number of papers from the research literature cite a minimum of 7-10 days when pozzolan is used, although strength gain with Class C pozzolan is typically much faster than with Class F pozzolan, and there is a strong effect of amount of pozzolan used.
| Source of Guidance | Guidance |
|---|---|
| ACI 318(3) | ≤7 days at T ≤50 °C |
| ACI 301(43) | 7 days, silent on temperature, pozzolans |
| ACI 308(31) | 7 days when using Type I cement, 14 for Type II |
| ACI 308R(6) | No prescriptive recommendation |
| ACI 325(21) | 7 days at T≤4 °C |
| AASHTO(33) | 3 days, silent on temperature, pozzolans |
| USACE (CEGS 03300)(19) | 7 days when using Type I cement, 14 for Type II |
| State DOTs | Most require 3 days, some 4 and 7 days. |
Comparisons of strength gains among eight mixtures, four containing 20 percent (mass) Class F fly ash as replacement for cement, proportioned as part of USACE planning for an airfield pavement showed that about 7 days was required for the fly ash concretes to gain the same strength as gained in 3 days in concretes without fly ash. This suggests that an approximate doubling of curing time is required when Class F fly ash is used at this replacement rate, a relatively common level in pavements.
The AASHTO guidance may be based on development of flexural strength and on the typical behavior of paving concrete mixtures. Paving mixtures are typically proportioned with relatively high cement contents and relatively low water-cement ratios. As a result, 3‑day strengths are often relatively high.
Three days is probably adequate time for most paving mixtures to develop strength sufficient for service when temperatures are around 20 °C or higher. However, rates of strength development at 10 °C may be only about half this rate, and it appears that allowing additional curing time would be of benefit. Perhaps an approach similar to that used in the UK (see appendix A, table 19) would be appropriate. This guidance bases lengths of curing required on maturity concepts, resulting in a set of curing times that graduate upwards as temperatures drop. Such an approach will be developed for this project.
Although strength development is the criterion on which prescriptive performance limits are based, properties of the concrete surface and near-surface zone are also very important in the long-term performance of pavements. No information was found to indicate that near-surface properties develop at a different rate than strength, but it is plausible that near-surface concrete may experience a significantly different temperature history than the concrete at greater depths. Thus, in cold placements, the most conservative curing guidance would need to be used. Also, concrete away from the surface will continue to hydrate after deliberate curing is terminated; concrete in the near-surface zone may or may not, depending on the climatic conditions. Conservative guidance may need to be followed in dry climates.
As is common knowledge for concrete systems, the time required to attain a given set of properties that depend on the extent of cement hydration is affected by a large number of variables, including properties of the cement, presence of pozzolan or slag, properties of the pozzolan or slag, temperature history, water-cement ratio, cement-aggregate ratio, and effect of admixtures. The cumulative effect of these creates such a variation in strength gain that no single prescriptive curing time can reasonably capture them all. Consequently, general prescriptive guidance should be relatively conservative, relying on performance tests or more sophisticated development of prescriptive times based on specific project conditions as an optional approach.
Given the tendency for concretes to be proportioned so that strength development will be substantially faster than the minimum requirements, it seems likely that the designer would want to include optional approaches that would allow for shorter curing times when justifiable. Temperature is likely to be the most common cause for variation from the prescriptive guidance if concrete materials and mixture proportions are held constant. A common rule of thumb developed from the Arrhenius relationship, which is the basis for some maturity calculations, is that time required to reach a given strength approximately doubles for each 10 °C increase in temperature, or conversely halves for each 10 °C decline. This suggests that a 7 day requirement at 10 °C would become a 3.5 day requirement at 20 °C, and a 1.75 day requirement at 30 °C.
Darter (1988) published a table of minimum opening times for pavements that corrects for temperature.(89) Results are similar to the Arrhenius approximation given above. The guidance also accounts for pavement thickness, with thinner pavements needing more time than thicker ones. The table covers pavements 180-250 mm thick. For the 180-mm pavement, the guidance is for 4.5 days at 10 °C, 2.5 days at 20 °C, and 1.5 days at 30 °C.
It is becoming increasingly common to use the maturity method as an in place estimator of strength gain based on real-time monitoring of concrete temperatures. To make best use of this technology some experience and thought must be given to the location of temperature sensors because of the relatively wide variations in temperature history among the various types of locations in a pavement (e.g., edges, top surface, center, etc.). Typically a number of locations will be instrumented so that the engineer can develop at least a partial mapping of strength development over the pavement. Hardware and software are commercially available to set up such a program, and there are consulting firms that provide this service.
Other performance methods are used to account for the variation in strength gain. One of the oldest is the use of field-cured cylinders. With this technique, cylinders are placed in locations near the placement that will give the best simulation of the temperature history of the in place concrete. This method is very simple to execute, but is commonly criticized for often representing a poor approximation of the in place condition.
A technique commonly used in precast concrete is temperature-matched curing. In this method, a thermocouple in the concrete structure feeds back to a temperature controller on a curing chamber containing standard strength cylinders. The temperature of the curing chamber then tracks the temperature in the placement, so that the cylinder strengths reasonably represent in place strengths. Use of this method would require judgment in determining the location in the concrete structure from which to take this "guide" temperature.
As mentioned in the preliminary report, a wide variety of test methods have been developed for determining the degree of physical property development in the near-surface zone of concrete as a result of curing. Many of these require specialized equipment and are not easily applied in the field. Lack of control of moisture content of the field concrete is often fatal to the field application of a test method. Several methods were thought to be plausible and some work was done to verify this.
Ultrasonic pulse velocity (UPV) is related to the modulus of elasticity of the concrete. Given that the modulus tends to increase with degree of hydration of the cement, UPV would appear to be a good tool for monitoring effectiveness of curing. Literature on the technique indicates that such a method should be workable, although the specialized nature of the equipment and the sophistication of the data analysis reported in this literature suggest the technique may be more complicated than is suitable for easy field application, at least without some development. A relatively simple analysis was done in this project to verify the plausibility of application for analysis of curing.
Concrete specimens made at a water-cement ratio of 0.42, 244 kg/m3 cement, 81 kg/m3 Class F fly ash, 926 kg/m3 coarse aggregate, and 870 kg/m3 of sand, 25-mm slump were cast into 150 by 150 mm cylindrical molds (cut down from 150 by 300 mm standard strength molds) and exposed to 38 °C, 30 percent RH, 3.3 m/s wind for 6 days. Four curing treatments were applied: no curing, curing under plastic sheet, a light coating of curing compound, and a heavy coating of curing compound (about 9 and 4 m2/L, respectively, estimated from reflectance). Specimens were demolded and UPV measurements taken by placing the transmitter on one margin of the top surface and the receiver on the far margin. The distance between the centers of the two was 120 mm. Four measurements were taken for each specimen. Table 17 summarizes the averages and standard deviations.
The pooled standard deviation among readings is 21 m/s (standard error among means = 11 m/s). The bottom of the specimens should have all been cured to approximately the same degree, so the standard deviation among the means (mean = 2720 m/s, s = 64 m/s) should give some estimate of variation to be expected among sampling sites on a single placement.
| No Curing | Plastic Sheet | Curing Compound,4 m2/L | Curing Compound, 9 m2/L | |
|---|---|---|---|---|
| Mean (n=4) of top surfaces | 2660 | 2750 | 2710 | 2730 |
| Standard deviation among determinations | 44 | 7 | 4 | 9 |
| Mean (n=4) of bottom surfaces | 2740 | 2790 | 2640 | 2710 |
| Standard deviation among determinations | 14 | 37 | 4 | 6 |
The difference between the completely uncured surface and the plastic covered surface was large enough that the difference would be detected with reasonable certainty by averaging about four sampling sites. However, the method, as executed here, was not sensitive to detecting degradation in curing due to under application of curing compound. It would then appear that the method would not be particularly good at detecting other relatively subtle variations in curing, at least as demonstrated with this equipment.
This result should not be taken as a total invalidation of the method, but as an example that simple application of the technology might not be sufficient to detect curing effects. More sophisticated hardware and data analysis procedures exist and these might be able to detect such differences.
The rebound hammer (ASTM C 805)(80) is intended, as described in the scope of the test method, to provide an in situ method for estimating strength. C 805(80) requires calibration by actually measuring strength on companion cylinders or cores taken from the concrete, therefore, the rebound number is only a relative indicator of strength. The method is often disparaged because it is most sensitive to near-surface properties of the concrete and may not represent the properties of the concrete as a whole very well. Though this may be a weakness for estimating gross strength, it was thought to potentially represent a strength for evaluating curing of near-surface concrete. A major outstanding question about use of the method for evaluating curing is whether the rebound numbers of very weak near-surface concrete are within the operating range of the instrument.
The approach to evaluating this method was to fabricate concrete specimens that had deliberately been given poor curing, then to determine whether this was detectable by C 805.(80)
In one experiment, 100 by 200 by 75 (w-l-d) mm concrete specimens were fabricated at a water-cement ratio of 0.45, 350 kg/m3 of portland cement formed into Nalgene pans. Specimen edges were sealed so that only the 100 by 200 mm surface was exposed to drying. Specimens were placed in an environmental chamber at 38 °C, 30 percent RH, and 3.3 m/s wind, directed onto the surface of the specimens. At several ages, the specimens were demolded and rebound number determined on both the top and bottom of the specimen.
Rebound numbers on relatively small specimens is strongly affected by the surface supporting the test specimen. Even well cured specimens will give very low rebound numbers if tested while sitting on a soft, flexible, or uneven surface. To give a rigid surface, a concrete cylinder (330 mm diameter by 700 mm high) was used as a base for the test specimens during testing. The average of ten relatively evenly spaced determinations was taken as a test result for each specimen. The top of the specimen (exposed surface) was expected to show significant impact of the poor curing, and the bottom of the specimen was considered to be at least relatively well cured given the common belief that the effects of poor curing do not penetrate much beyond 50 mm. Figure 28 shows the results.
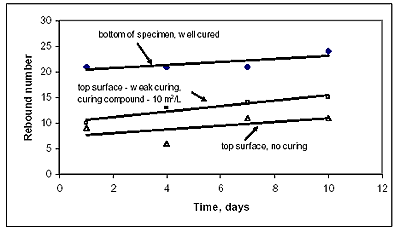
Figure 28. Effect of curing quality on development of rebound number at early ages. Specimens cured at 38 °C.
In a similar experiment involving only measurement of top or exposed surfaces, conditions of no curing, light curing compound, heavy curing compound, and plastic sheeting were compared, as shown in figure 29.
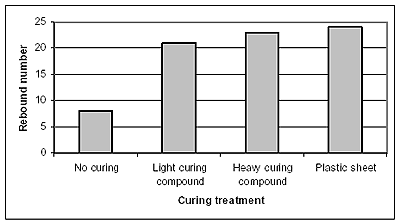
Figure 29. Effect of curing condition on rebound number of top surface of specimens at 7 days.
Rebound number was also used as one of the measures of curing effectiveness during many of the experiments in other parts of this work, along with surface water absorption and measures of water-loss from specimens. There was a relatively strong correlation between water absorption and rebound number in these data, as shown in figure 30, as well as between rebound number and water lost in the final curing period (figure 17, above).
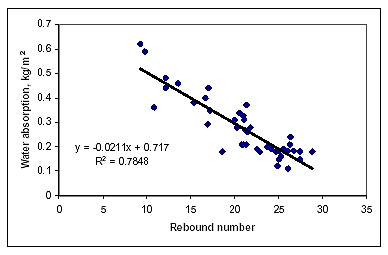
Figure 30. Correlation between rebound number and surface water absorption.
In field application, it would probably be best to select a section of pavement to serve as a standard condition, in which good curing could be assured, e.g., cured with water, or covered with plastic sheeting, or treated with curing compound under well controlled conditions. Then the rebound numbers determined on this control area could be used as a standard of comparison for the remainder of the pavement.
As found in the literature review, abundant evidence shows that surface water absorption is a useful tool for measuring the quality of concrete curing. Surface water absorption was the basis of ASTM C 1151 (test method for evaluating curing compounds).(27) This method has since been withdrawn for lack of use in testing curing compounds, but in principle it may still be the basis of a useful method for evaluating the quality of curing. The objective in this investigation is to develop some information on the sensitivity of the method to variations in curing. It is one of the methods that is sensitive to the moisture content of the concrete; hence, it is difficult to apply in the field. However, it can be easily applied to cores without elaborate equipment, and since coring is such a common way to obtain samples to evaluate field concrete, it should be evaluated further and is included in the revised guide.
Concrete specimens identical to those used in the ultrasonic pulse velocity evaluation were used. Four specimens were cast in and stored at 38 °C, 30 percent RH with no wind until bleed water had stopped appearing and surface sheen had disappeared (4 h). One specimen was then left unprotected, another was covered with a plastic sheet secured around the edges with a rubber band, another was treated with curing compound at 4 m2/L, and the last one was treated with curing compound at 9 m2/L. Specimens were exposed to 38 °C, 30 percent RH, 3.3 m/s wind for 11 days. The specimens were demolded and sawed into slices parallel to the exposed surface at approximately 15-25 mm thickness, creating surfaces that could be tested at several distances away from the exposed surface.
To standardize the finished surface of the concrete specimens to the sawed surface of the pieces cut from deeper into the specimen, a small amount of material was also sawed from the exposed surface of the specimen. More material was removed from the poorly cured specimens than from the well-cured ones because of some difficulty with sawing weak material. This is shown in the results. Specimens were dried at 60 °C, cooled, and weighed. A shallow dish was partially filled with water and paper towels folded and placed so that the concrete specimen surface would be wet, but the sides would be minimally wet when set onto the paper towels. The specimen was left for 60 seconds, excess water blotted off, and then weighed. The water absorption was calculated as the mass of water absorbed divided by the surface area, in units of kg/m2.
This method appears to clearly distinguish among the curing treatments. Results are summarized in figure 31. The concrete that was not cured showed a strong relationship between water absorption and depth down to at least 75 mm below the surface. The effect was also discernable on the lightly cured specimen, but it was not as strong and truncated at about 50 mm. The specimen that received the heavy coat of curing compound showed a slightly higher absorption near the surface, but this could not be reliably distinguished from the pattern of the specimen covered in plastic sheeting.
The data representing the specimen covered in plastic showed a slight negative slope, suggesting that the near-surface concrete was actually either slightly better cured or slightly more dense. The latter seems more plausible.
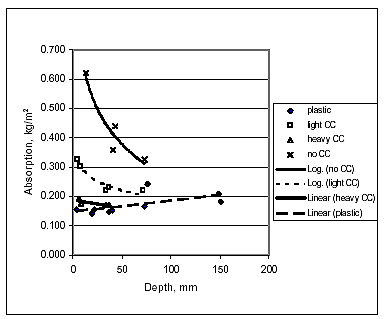
Figure 31. Surface water absorption versus depth for concrete cured with different methods.
An estimate of testing error can be derived from these data. Assuming that the degree of curing is about the same for all specimens below approximately 35 mm (except the one with no curing), then the variation among specimens is an indicator of the expected error in the method among sampling sites within a concrete placement. The coefficient of variation among these values was 16 percent. Therefore, for improved sensitivity in detecting effects, best results would be obtained if several sites were sampled and results averaged. Averaging over 4 would reduce the coefficient of variation to 8 percent. This would result in a method that would be reasonably sensitive to a 20 percent difference in water absorption.
Taking the water absorption on both sides of the saw cut as a replicate of the test method on the same concrete, the CV was found to be 11 percent.
This method was used as one of the tools for evaluating the effects of water losses in the section on evaporation of water from concrete. Figure 18 (p. 69) shows the relationship between water loss in the final curing period and water absorption of the concrete surfaces. This also supports the plausibility of the method.
To further develop the implications of the water absorption test, 75 by 75 by 250 mm prisms were cast and given the same treatments as the cylinders. Brass measuring pins were embedded in the surface and length change measured with a Whittamore gauge. The pins penetrate to about 15 mm into the concrete. Figure 32 shows the relationship between shrinkage and surface water absorption.
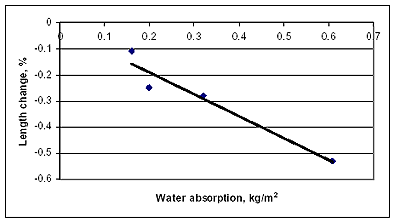
Figure 32. Relationship between shrinkage of near-surface zone of concrete and water absorption after 11 days of exposure to drying conditions.
The most serious drawback to the water-absorption method is that it requires that cores be taken so the effects of concrete moisture condition can be removed by drying. Doug Hooton of the University of Toronto has developed a variation of this test that allows in situ measurements and is purported to have a method for correcting for the water in the concrete (personal communication).(90)
As covered in the literature review (appendix B), abrasion resistance is considered to be one of the major properties affected by curing, and it appears be a useful basis for a field applicable test method. Work by White and Husbands (1990) also showed this method to have promise.(85) Part of the procedure for the water absorption test was to scour the surface of the specimen with a powered wire brush or a horizontal polishing wheel using coarse grit. It became evident from this experience that the mortar fraction of poorly cured specimens had poor abrasion resistance. The mortar was easily removed from between the coarse aggregate particles. Care had to be taken not to remove too much mortar, thus negatively impacting the water absorption test. However, it also became apparent that the abrasion resistance of the coarse aggregate would dominate an abrasion test that was based on grinding the surface with a cutting wheel or other abrasive device that acted on a relatively large surface. Therefore, efforts ceased on developing and evaluating an abrasion resistance method for concrete. Some kind of method-based use of a powered wire brush under controlled pressure could probably be developed and might be field applicable, but this was not pursued.
Measuring the amount of chemically combined water is one of the oldest methods for measuring the amount of hydration in cement pastes. It is not field applicable, but like water absorption, it can be executed on cores.
Hydration products of portland cement decompose at about 550 °C, releasing the water to evaporation, which is detectable by mass change. Therefore, mass-loss differences between 110 °C (which removes free water) and 550 °C give an indication of the amount of hydrated cement paste.
White and Husbands (1990) performed an evaluation of this method for detecting differences in curing quality of mortars and found the anticipated effect, but the differences were small enough that they concluded the method to lack adequate sensitivity for this purpose.(85) The sensitivity would be made considerably worse if applied to concrete because of the relatively low mass percentage of cement in concrete, even relative to mortars. This method was not pursued further.
ACI hot weather guidance (ACI 305R) cautions about creating situations in which the surface of the concrete is cooled to more than approximately 10 °C cooler than the interior of the concrete.(12) USACE guidance is to allow no more than a 13 °C gradient between the surface and a depth of 50 mm into the concrete (CEGS 03300, paragraph 3.15.6).(19) Gradients sufficient to cause cracking have been reported on structures that were water cured in windy conditions. This seems unlikely in a PCC pavement, but an examination of the necessary evaporation conditions required to create this temperature difference is evaluated in this section.
A set of five laboratory experiments was conducted in which a 50 mm (thick) by 150 mm (diameter) piece of concrete was warmed to plausible pavement temperatures, surface wetted, and exposed to various evaporation conditions. Temperature differences between the evaporation surface and the bottom were measured. Initial evaporation rates (at the start of the experiment) were calculated from the ACI nomograph using measured concrete temperature, wind velocity, RH, and air temperature.
Figure 33 illustrates temperature differences between the concrete surface and the 50 mm surface in such an experiment. The concrete temperature started at 44 °C, wind velocity was 4.6 m/s, air temperature was 22 °C, and RH was 29 percent.
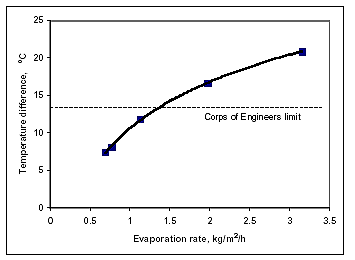
Figure 33. Relationship between maximum temperature gradient between concrete surface and 50 mm depth versus initial evaporation rate calculated from the ACI nomograph.
In general, the 50 mm surface gradient was reasonably predictable from estimates of initial evaporation rates from the wet surface. Figure 34 shows this relationship. The evaporation rate required to achieve a 13 °C gradient is about 1.4 kg/m2/h. In these experiments, the air flow was directed immediately at the surface of the specimen. As shown above in the previous discussion on the evaluation of the accuracy of the nomograph, such conditions were found to give actual mass losses of water about twice that calculated from the nomograph.
Figure 34. Temperature gradient in a 50-mm thick specimen starting at 44 °C, air temperature of 22 °C, RH of 29 percent, and windspeed of 4.6 m/s.
This does not appear likely to be a major source of problems with portland cement concrete pavements, given that most are cured with curing compound, but it could be a problem with some fast-track paving in which high curing temperatures and water are used under insulation blankets. Sudden removal of the coverings could present a warm, wet surface which, if windspeeds were high enough, cause sufficient gradient to result in cracking.

