U.S. Department of Transportation
Federal Highway Administration
1200 New Jersey Avenue, SE
Washington, DC 20590
202-366-4000
Federal Highway Administration Research and Technology
Coordinating, Developing, and Delivering Highway Transportation Innovations
 |
| This report is an archived publication and may contain dated technical, contact, and link information |
|
Publication Number: FHWA-HRT-06-117 Date: December 2006 |
Previous | Table of Contents | Next
Hardened concrete is composed of coarse and fine aggregate particles embedded in a matrix of hardened cement paste. The hardened paste, which comprises approximately 25 to 30 percent of the concrete volume, consists primarily of calcium silicate hydrate (CSH) gel, calcium hydroxide (CH), calcium sulfoaluminate and capillary pore space (space originally filled with water in excess of that required for hydration of the cement). The CSH gel is itself porous, with an intrinsic porosity of approximately 28 percent.(23) A schematic diagram of concrete paste microstructure at the boundary of an air void is shown in figure 2. The solid portion of the hydrated cement gel is depicted as small black spheres. The interstitial spaces between the spheres are the gel pores. The capillary pores are denoted with a “C.”
Figure 2. Illustration. Concrete paste microstructure.(24)
The gel pore diameters range in size from 5 x 10⁻⁷ to 25 x 10-7 mm. The temperature at which water freezes is a function of the pore size; the gel pores are so small that water cannot freeze inside them at temperatures above −78 ºC.(24) The capillary pores are considerably larger and vary in size, typically ranging from 10 x 10-6 to 50 x 10-6 mm in well hydrated pastes of low water-cement ratio, whereas in pastes of high water-cement ratio at early ages, size may vary from 3 x 10⁻³ to 5 x 10⁻³ mm. Figure 2 also shows the boundary of an air void, indicating that air voids are usually several orders of magnitude larger than capillaries and gel pores.
All concretes contain natural or entrapped air that is incorporated into concrete during mixing operations.(25) It is relatively large, often irregularly shaped voids, typically 1 to 10 mm or more in size. Entrapped air can comprise about 1 to 3 percent of the volume in concrete. Air-entrained concrete also contains much smaller, spherical air voids ranging from 0.01 mm to 1 mm in diameter. A typical average size of entrained air voids is about 0.10 mm.(7) Entrained air is incorporated into the concrete in the same way as entrapped air (mixing); however, entrained air is stabilized as small bubbles in the fresh cement paste through the action of AEA. A properly air-entrained concrete may contain 300,000 air voids per cubic centimeter of paste.
Air-entraining agents are admixtures used to stabilize the air entrapped during the mixing in the form of very small, discrete bubbles known as entrained air.(26)
The air-entraining admixtures are surfactants that possess a hydrocarbon chain terminating in a hydrophilic polar group. The other end of the chain is hydrophobic and does not mix well with water. Not all organic materials are suitable for use as air-entraining agents. One of the first used and most effective is Vinsol resin, which is extracted from pinewood.(26) The earliest work on freeze-thaw resistance, as well as recommendations for air void systems, were based on research on concretes containing Vinsol resin admixtures.
Currently, a large number of admixtures are based on synthetic chemicals. They can be divided into anionic and nonionic. The first, anionic group is composed of alkylarylsulfonates and alkylsulfates such as sodium dodecyl benzene sulfonate. An example of a nonionic agent is nonylphenolethoxylate.
If the aggregates used in concrete are frost-resistant, the freeze-thaw resistance of the cement paste determines the overall resistance of the concrete to freezing and thawing, as described below. If the aggregate is susceptible to freeze-thaw damage, it can contribute to concrete deterioration. Since most aggregates are freeze-thaw resistant and the aggregates used in this research were durable, this mechanism is not covered in this research.
Several theories have been proposed to explain concrete damage due to freezing and thawing.
The critical saturation theory, proposed by Powers,(27) states that concrete will only suffer damage from freezing when the capillaries in the cement paste are more than 91.7 percent full of water. This theory is based on the fact that water expands in volume by approximately 9 percent when it freezes. If the capillary pores are saturated with water and the water freezes, stresses will be generated. If the pores are only partially filled, the expansion resulting from ice formation may be accommodated. Critical saturation can occur in localized zones within the cement paste.
Powers(4) also put forth the hydraulic pressure theory, which states that damage from freezing is caused by a buildup of hydraulic pressure from the resistance to flow of unfrozen water in cement paste capillaries. As water freezes, if the cement paste does not expand to accommodate it, unfrozen water will be pushed through the capillary pores, away from the sites of freezing, like water through a pipe. Powers applied Darcy’s Law to illustrate the factors influencing the pressure generated by this flow:
![]()
Figure 3. Equation. Pressure gradient.
In the above equation, Δh is the pressure gradient, η is the fluid viscosity, k is the permeability, Q is the flow rate, l is the length of the flow path, and A is the flow area.. The pressure generated increases as fluid viscosity, flow rate, or length increase, and as permeability or area decrease. The fluid viscosity (viscosity of the pore solution (water with dissolved ions)) may not vary much. Flow rate is related to the rate of freezing (the faster the ice forms, the faster water is pushed through the capillaries). Permeability and flow area (i.e., size of the capillary pore) depend on the particular cement paste microstructure. For a given cement paste, pore fluid viscosity, and flow rate, a maximum length of flow can be calculated by setting the pressure gradient equal to the tensile strength of the cement paste (i.e., the maximum pressure for which damage to the paste will not occur):
![]()
Figure 4. Equation. Spacing factor.
Powers called this distance the theoretical permissible spacing between bubbles and estimated its magnitude to be on the order of 0.20 mm,(4) based on Vinsol resin admixtures.
Powers and Helmuth(24) proposed the ice accretion/osmotic pressure theory to explain experimental results that were inconsistent with the hydraulic pressure theory. The osmotic pressure theory stated that, during freezing, water moves from the gel pores to the capillary pores according to the laws of thermodynamics (diffusion from high to low free energy) and the theory of osmosis (diffusion along concentration gradients).
As stated before, the freezing temperature of the water depends on the size of the pore. Gel pores are so small that water cannot freeze in them at temperatures above −78 ºC. Water, at temperatures below 0 ºC, has a higher free energy than ice; therefore, water will flow from gel to capillaries along a free energy gradient in order to freeze. If sufficient water flows to capillaries and freezes, the capillary will become full and pressure will develop. This pressure increases the free energy of the ice (or ice and water) in the capillary. Water will continue to flow to the capillary until the free energy of the ice and water in the capillary equals the free energy of water in the gel pores.
Water flow along ion concentration gradients can also occur during freezing. The water in capillary pores is not pure water but a solution of various ions dissolved in water. Ice, on the other hand, is pure water. Therefore, when ice forms in a capillary, the concentration of the remaining unfrozen pore solution increases, thus creating a concentration gradient. Even if the capillary is full of ice and water, water will flow from the gel (less concentrated) to the capillary (more concentrated) to equalize the pore solution concentration. This osmotic movement of water generates pressure.
The theories of damage due to freezing and thawing identify stresses due to excessive pressure buildup as the cause of damage.
Under the ice accretion theory, water and ice in a capillary pore has a higher free energy than water or ice in an air void because capillaries are sufficiently small to inhibit the normal growth of ice crystals, whereas air voids (even the smallest ones) are large enough for ice crystals to form normally. Therefore, if air voids are present, water will diffuse from both the gel and capillaries to the air voids. Instead of filling the capillaries and generating pressure, water flows to the air voids, where (unless the concrete is completely saturated with water) ample space should be available to accommodate ice formation without pressure buildup. Air voids provide a similar protective function in the case of osmotic pressure.
In either case, air voids act as pressure relief sites, with each air void protecting a zone of hardened cement paste surrounding it. Figure 5 illustrates (in two dimensions) air voids protecting a zone (or shell) of paste. The limit of the protective shell is the maximum distance from an air void in which excessive pressure (i.e., that exceeding the tensile strength of the concrete) will not be generated. Thus, the goal of air entrainment is to provide a sufficient number of well-distributed air voids in the cement paste to ensure that most or all of the paste is within the required distance of an air void.
Figure 5. Illustration. The darker area shows the air void’s protection zone of concrete.
The air void system in concrete can be described using several characteristics, or parameters, such as volume, number of bubbles, bubble size distribution, and spatial distribution within the paste. Air volume is the most commonly specified parameter; however, air volume alone is not a sufficient determinant of freeze-thaw resistance.
In theory, the volume of space needed for the expansion of ice formation is quite small. In a concrete containing 30 percent paste, and assuming 40 percent capillary porosity in the paste, only 1.3 percent total air volume is required to accommodate the expansion if the concrete is fully saturated. Even non-air-entrained concretes routinely contain this much air. However, the theories of freeze-thaw damage described previously illustrate that it is not the total volume of air, but rather the presence of a sufficient number of well-distributed air voids, that is critical. These characteristics are most commonly described in terms of specific surface and spacing factor.
Specific surface, the ratio of total bubble surface area to total air volume, normally expressed in mm2/mm3 or inches2/inches3, reflects the relative number and sizes of the air voids. For a given volume of air, a greater number of smaller air voids results in a higher specific surface area. Figure 6 shows the same volume of air as figure 5 in smaller voids. These figures indicate that for a given volume of air, smaller air voids provide more protection than larger voids, as the number of bubbles will be higher and the distance between them will be less. Specific surface, then, is an indicator of air void system effectiveness.
Figure 6. Illustration. Smaller air voids have higher specific surface and a greater number of bubbles than larger air voids, and offer more protection.
The spacing factor(4) is an empirical quantity intended to represent the maximum distance that water would have to travel in the cement paste to reach an air void. If this distance is less than the critical maximum distance at which excessive stresses develop, the concrete should be adequately protected. The spacing factor was derived from a hypothetical air void system consisting of single-sized air voids arranged in a cubic lattice. In reality, voids are multisized and distributed randomly through the cement paste. Therefore, a distribution of spacings (distances from different points in the paste to the nearest air void) exists.(28)
Nevertheless, much research has shown a relationship between spacing factor and concrete freeze-thaw durability (Klieger studies), at least for concretes containing admixtures available at the time of the research (Vinsol resin). Specific surface and spacing factor can be determined from ASTM C457(18) measurements.
Often-quoted rules of thumb for these parameters are: 6±1 percent air, specific surface ≥ 24 mm2/mm3, and spacing factor ≤ 0.20 mm. However, air content and specific surface cannot be viewed as independent. A specific surface of 24 mm2/mm3 at an air volume of 6 percent may be adequate, but a specific surface of 24 mm2/mm3 for an air volume of 4 percent may not be adequate. This concept is illustrated in figure 7, which shows a concrete volume containing two-thirds the volume of the air of figure 6 in identically sized voids (and therefore, with identical specific surface). Even with the voids spaced so their protected shells do not overlap, the unprotected area is significantly greater at the lower air void content.
Figure 7. Illustration. Protection zone for a lower air void content.
Because air volume and specific surface must be considered in tandem, total bubble surface area (the product of air volume and specific surface) has been proposed as an appropriate parameter.(29)
In practice, air content is usually the only parameter that is specified. That is because until the recent advent of AVA, which estimates the spacing factor from measurements on fresh concrete, the only means of determining the spacing factor was ASTM C457(18) (hardened concrete). Air content is usually tested in the field using the pressure-meter method (ASTM C231(14) and AASHTO T 152(15)) or the volumetric method (ASTM C 173(16) and AASHTO T196(17)), or it can be also calculated gravimetrically (ASTM C 138(30) or AASHTO T 121(31)) from concrete density (unit weight). However, the air content alone may not indicate the adequacy of freeze-thaw protection. As previously stated, it is the volume, number, and size distribution (taken together) that determine the quality of the air void system. Furthermore, the stability of the air void system (and thus, the air content and other parameters) may be affected by a number of materials, as well as environmental and construction variables-mix proportions, mixing time, haul time, pumping, spreading, vibration, and finishing. Thus there is no guarantee that the air void system in the concrete, as placed, is the same as the air void system of the concrete sampled at the truck chute or from the grade.
The AASHTO T-161(20) and ASTM C666 Resistance of Concrete to Freezing and Thawing(21) are the standard laboratory test methods for assessing concrete’s resistance to freezing and thawing. The test method uses concrete specimens (of widths and depths from 76 mm to 127 mm and lengths between 279 mm to 406 mm) that are subjected to temperature cycling from 4 ºC to −18 ºC. The duration of the cycles is 2 to 5 hours. The freezing portion of the cycle is accomplished by air cooling (similar to air conditioning); the thawing portion, by submersion in water.
Freezing rate is an important factor. In pastes of ordinary porosity, where hydraulic pressure is the main mechanism of deterioration, fast freezing in the laboratory promotes more severe concrete degradation than in the field. In dense pastes, where growth of capillary ice is the main cause of damage, fast freezing in the laboratory promotes milder degradation than in the field.(32)
There are two standard procedures, designated Procedure A and Procedure B. In Procedure A, the prisms are placed in containers (usually stainless steel) with approximately 3 mm space between the prism and the bottom and sides of the container. The container is filled with water, thereby surrounding the specimen on all sides (including the top) with water for the duration of testing. Figure 8 shows a photograph of a vertical container. Some equipment provides for horizontal containers. This study uses vertical containers. In Procedure B, the specimens are placed directly into the freeze-thaw chamber with no container or other covering.
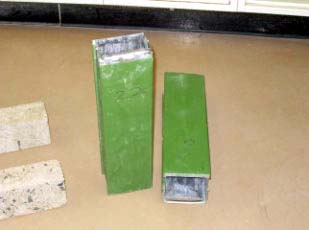
Figure 8. Photo. Vertical container for freeze-thaw concrete specimen (ASTM C 666 Procedure A).
Modal testing is a nondestructive method for assessing the dynamic response of structures. This method uses sinusoidal excitation for the input signal and forces the specimen to vibrate at a frequency as the response of the specimen is monitored with an accelerometer.(33)
ASTM C215(22) uses modal testing to assess damage to beams undergoing freeze-thaw testing. A natural frequency of vibration is a characteristic (dynamic property) of an elastic system. Assuming a homogeneous, isotropic, elastic material, the dynamic modulus of elasticity is related to the resonant frequency and density.
Resonance manifests itself as a great increase in amplitude of oscillation when a system is driven at a certain frequency. The natural frequency (resonant frequency) is the characteristic frequency at which maximum response (amplitude) occurs.
Two methods for measuring resonant frequency are described in ASTM C215(22): sinusoidal excitation (forced oscillation) and impact excitation. The classic ASTM C215(22) forced resonance setup uses either transverse or longitudinal resonance. In the longitudinal mode, the oscillator is at one end and the pickup is at the other. In the transverse mode, the oscillator is in the middle of the top surface, and the pickup is at one end of the top surface.
The ASTM C215(22) impact method uses a modally tuned impact hammer to excite vibrations in the beam and an accelerometer attached to the beam to record the response. ASTM C215(22) shows schematics of the impact resonance test setup. Modal tuning enables the isolation of the hammer’s response from the structural response, thus providing an accurate measurement of the specimen response and not the combined system (impact hammer and structure) response.(34)
The resonant frequency of a concrete prism varies depending on the testing mode and the orientation of the prism. The resonant frequency in the longitudinal direction is typically much higher (on the order of 5000 Hz) than the transverse resonant frequency (on the order of 2500 Hz). The resonant frequency for a prism with a rectangular cross section is lower when the prism is supported on the wider edge.
In the present study, the impact test method was used to measure transverse frequency, following the setup used by Clarke.(35) Appendix D presents more details about this method. The test setup is shown in figure 9. The rectangular test prisms (75 mm by 100 mm by 400 mm) were placed with the narrow edge (75 mm) down on piano wire supports located at the nodal points (0.224 by prism length from the end of the specimen).
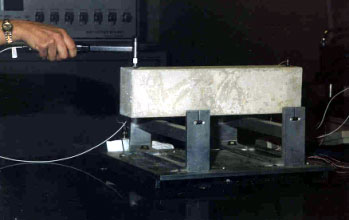
Figure 9. Photo. ASTM C 215 test setup.
The procedure used to assess damage begins by removing the beam from the freeze-thaw chamber, and after the thawing cycle is finished, towel drying (to saturated, surface dry (SSD)) the beam and weighing it. The specimen is placed on the piano wire supports, and an accelerometer (output signal) is attached to one end of the beam using vacuum grease. Using the impact hammer, the beam is tapped at its opposite end, and the time domain response data (impulse versus time and response versus time) are recorded using appropriate equipment. Figures 10 and 11 are examples of time domain impulse and response data, respectively.
Figure 10. Graph. Time domain impulse data.
Figure 11. Graph. Time domain response data.
Dynamic signal analysis software (Virtual Bench Dynamic Signal Analyzer (DSA)) can then be used to transform the time domain data to the frequency domain (using the Fast Fourier Transform (FFT)) to determine the frequency response curve and to determine the resonant frequency. A typical frequency response curve is shown in figure 12. The resonant frequency is the frequency (x-axis value) at the maximum amplitude of the frequency response curve.
Figure 12. Graph. Frequency response curve.
Testing is repeated at regular intervals-usually every 10 to 30 cycles (depending on expected freeze-thaw behavior). The relative dynamic modulus (RDM), expressed in percentage, is calculated as follows:
![]()
Figure 13. Equation. Relative dynamic modulus.
where c is the number of cycles of freezing and thawing, nc is the resonant frequency after c cycles, and n is the initial resonant frequency (at zero cycles).
The durability factor (DF) is defined as:
![]()
Figure 14. Equation. Durability factor.
where Pc is the relative dynamic modulus, N is the number of cycles completed, and M is the planned duration of testing (usually 300 cycles). Testing is usually halted when the relative dynamic modulus falls below 50-60 percent of its initial value.
If the concrete is not adequately protected by air entrainment, microcracking occurs with each cycle of freezing and thawing. Microcracks increase damping in the beam, thereby reducing the vibration amplitude and flattening the frequency response curve. Cracking also causes the resonant frequency to decrease-waves take longer to travel through the concrete when it contains cracks (figure 15).
Figure 15. Graph. Effect of freeze-thaw cycling on the resonant frequency curve of a non-air-entrained concrete after 31 cycles when concrete failure was achieved (mix 302-beam A, see chapter 5).

