U.S. Department of Transportation
Federal Highway Administration
1200 New Jersey Avenue, SE
Washington, DC 20590
202-366-4000
Federal Highway Administration Research and Technology
Coordinating, Developing, and Delivering Highway Transportation Innovations
 |
| This report is an archived publication and may contain dated technical, contact, and link information |
|
Publication Number: FHWA-HRT-06-117 Date: December 2006 |
Previous | Table of Contents | Next
In order to evaluate the relation between concrete microstructure and its freeze-thaw resistance, an experiment was designed for concretes with fresh air contents (total air) ranging from 2.5 to 4.5 percent and w/c ranging from 0.4 to 0.5; freeze-thaw testing was performed using ASTM C 666,(21) Procedure A. Specimens were monitored for changes in resonant frequency (ASTM C 215(22)) and mass at regular intervals. ASTM C457(18) air void system evaluations (both modified point count and linear traverse) were conducted on hardened specimens from each mix.
The experiment was designed as a central composite design in the two variables, with a total of 13 mixes (4 factorial points, 4 axial points, and 5 center points). Central composite design, (which is enhanced factorial design), is widely used for fitting a second-order response surface. It allows estimation of a full quadratic model for each response. Response surface methodology consists of a set of statistical methods normally applied in situations where several factors (for instance, the proportions of individual materials in concrete)—in this case w/c ratio and air entrained—influence one or more performance characteristics, or responses (freeze-thaw resistance, for example).
The experiment design of this study consists of 2k factorial points, 2*k axial points, and 5 center points, where k is the independent variable (in this case 2). The design is shown in table 1. Shaded mixes represent the control mix (center point), which was repeated several times.
| Run # | Mix ID | W/C | Total fresh air (%) | Point type |
|---|---|---|---|---|
| 1 | 115-1 | 0.45 | 3.5 | Center |
| 2 | 115-2 | 0.45 | 3.5 | Center |
| 3 | 115-3 | 0.40 | 4.5 | Factorial |
| 4 | 116-1 | 0.45 | 3.5 | Center |
| 5 | 116-2 | 0.40 | 2.5 | Factorial |
| 6 | 116-3 | 0.45 | 2.5 | Axial |
| 7 | 117-1 | 0.50 | 3.5 | Axial |
| 8 | 117-2 | 0.50 | 2.5 | Factorial |
| 9 | 117-3 | 0.45 | 4.5 | Axial |
| 10 | 117-4 | 0.45 | 3.5 | Center |
| 11 | 118-1 | 0.50 | 4.5 | Factorial |
| 12 | 118-2 | 0.45 | 3.5 | Center |
| 13 | 118-3 | 0.40 | 3.5 | Axial |
Materials included Type I Portland cement (ASTM C 150(36)), #57 crushed limestone coarse aggregate, ASTM C33(37) natural sand (quartz), and tap water (material properties can be found in appendix A). The air-entraining admixture was a Vinsol resin-based admixture meeting ASTM C 260(38) (AASHTO M154(39)). Concrete was mixed in a 0.25 m3 drum mixer according to ASTM C192.(40) The batch size was 0.07 m3. Mix proportions actually used are shown in table 2.
Fresh concrete tests included slump (ASTM C 143(41)), fresh air content (ASTM C231(14)), and unit weight (ASTM C 138(41)). Five 75- by 100- by 400-mm prisms (for freeze-thaw testing) and eight 100- by 200-mm cylinders (for strength testing and ASTM C457 evaluations(18)) were cast for each mix. Admixture dose is given in liters (L) per 100 kg of cement.
| Mix ID | W/C | Coarse agg (SSD) kilogram (kg)/m3 |
Fine agg (SSD) kg/m3 |
Cement kg/m3 |
Water kg/m3 |
AEA L/100 kg |
WRA† L/100 kg |
|---|---|---|---|---|---|---|---|
| 115-1 | 0.45* | 976 | 866 | 355 | 163 | 0.033 | 0.260 |
| 115-2 | 0.45 | 978 | 870 | 355 | 160 | 0.033 | 0.260 |
| 115-3 | 0.40 | 978 | 891 | 355 | 142 | 0.072 | 0.260 |
| 116-1 | 0.45 | 970 | 889 | 352 | 159 | 0.007 | 0.319 |
| 116-2 | 0.40 | 979 | 944 | 356 | 142 | 0.003 | 0.260 |
| 116-3 | 0.45 | 980 | 898 | 356 | 160 | 0.008 | 0.260 |
| 117-1 | 0.50 | 979 | 825 | 356 | 178 | 0.023 | 0.260 |
| 117-2 | 0.50 | 978 | 850 | 355 | 178 | 0.002 | 0.260 |
| 117-3 | 0.45 | 975 | 854 | 355 | 160 | 0.046 | 0.260 |
| 117-4 | 0.45 | 976 | 869 | 355 | 160 | 0.028 | 0.260 |
| 118-1 | 0.50 | 978 | 797 | 355 | 178 | 0.043 | 0.260 |
| 118-2 | 0.45 | 978 | 870 | 355 | 160 | 0.023 | 0.260 |
| 118-3 | 0.40 | 981 | 920 | 357 | 143 | 0.036 | 0.260 |
* Actual as-batched w/c was 0.46 for this mix.
† WRA—water reducing admixture
The fresh concrete properties for each mix are shown in table 3.
Slumps were quite low at w/c of 0.40 and 0.45 (13 mm or less) but increased to 50 mm or more at w/c=0.50. Slump also increased slightly with air content at w/c=0.50.
The mean 28-day strengths (21-day strengths for mixes 115-1, 115-2, and 115-3) and standard deviations are shown in table 4.
| Mix ID | W/C | Slump (mm) | Total air content (%) | Unit weight (kg/m3) |
|---|---|---|---|---|
| 115-1 | 0.46 | 0 | 3.6 | 2361 |
| 115-2 | 0.45 | 5 | 3.6 | 2368 |
| 115-3 | 0.40 | 0 | 4.6 | 2374 |
| 116-1 | 0.45 | 15 | 3.4 | 2379 |
| 116-2 | 0.40 | 0 | 2.5 | 2401 |
| 116-3 | 0.45 | 15 | 2.4 | 2416 |
| 117-1 | 0.50 | 65 | 3.5 | 2390 |
| 117-2 | 0.50 | 50 | 2.7 | 2366 |
| 117-3 | 0.45 | 0 | 4.4 | 2371 |
| 117-4 | 0.45 | 15 | 3.8 | 2358 |
| 118-1 | 0.50 | 70 | 4.6 | 2352 |
| 118-2 | 0.45 | 5 | 3.6 | 2377 |
| 118-3 | 0.40 | 0 | 3.3 | 2387 |
| Mix ID | W/C | Total fresh air content (%) |
Mean 28-day strength* (megapascals (MPa)) |
Std. dev. (MPa) |
|---|---|---|---|---|
| 115–1* | 0.46 | 3.6 | 39.9 | 0.3 |
| 115–2* | 0.45 | 3.6 | 43.1 | 1.6 |
| 115–3* | 0.40 | 4.6 | 43.1 | 1.7 |
| 116–1 | 0.45 | 3.4 | 50.3 | 1.4 |
| 116–2 | 0.40 | 2.5 | 53.2 | 0.2 |
| 116–3 | 0.45 | 2.4 | 50.3 | 0.8 |
| 117–1 | 0.50 | 3.5 | 38.6 | 5.8 |
| 117–2 | 0.50 | 2.7 | 40.8 | 1.0 |
| 117–3 | 0.45 | 4.4 | 44.3 | 1.5 |
| 117–4 | 0.45 | 3.8 | 46.3 | 4.8 |
| 118–1 | 0.50 | 4.6 | 41.0 | 1.3 |
| 118–2 | 0.45 | 3.6 | 49.0 | 0.8 |
| 118–3 | 0.40 | 3.3 | 49.3 | 0.0 |
* 21-day strengths are reported for 115-1, 115-2, and 115-3. All results based on 2 tests of 100- by 200-mm cylinders.
The results of freeze-thaw testing are summarized in table 5. DF ranged from 3.3 to 94.8 percent. With one exception (mix 116-1), mixes with greater than 3.0 percent fresh air content performed well (DF > 80) through more than 300 cycles of freezing and thawing. All specimens suffered some mass change (loss) during testing. Mass losses ranged from 0.61 to 3.66 percent. The mass loss can be attributed to surface scaling, which occurred on all beams. Any mass gain resulting from water entering the concrete through cracks was obscured by the losses due to scaling.
| Mix ID | W/C | Fresh air (%) | Cycles | Final RDM (%) | DF (%) | Mass change (%) |
|---|---|---|---|---|---|---|
| 115-1 | 0.46 | 3.6 | 300 | 84.2 | 84.2 | –3.66 |
| 115-2 | 0.45 | 3.6 | 300 | 80.3 | 80.3 | –3.28 |
| 115-3 | 0.40 | 4.6 | 300 | 85.7 | 85.7 | –2.63 |
| 116-1† | 0.45 | 3.4 | 103 | 51.5 | 17.7 | –0.66 |
| 116-2 | 0.40 | 2.5 | 132 | 48.0 | 21.1 | –0.61 |
| 116-3 | 0.45 | 2.4 | 191 | 57.7 | 36.7 | –2.60 |
| 117-1 | 0.50 | 3.5 | 303* | 89.6 | 90.5 | –3.53 |
| 117-2 | 0.50 | 2.7 | 38 | 26.4 | 3.3 | 0.13 |
| 117-3 | 0.45 | 4.4 | 303* | 90.9 | 91.8 | –3.39 |
| 117-4 | 0.45 | 3.8 | 303* | 90.3 | 91.2 | –1.88 |
| 118-1 | 0.50 | 4.6 | 300 | 94.8 | 94.8 | –1.73 |
| 118-2 | 0.45 | 3.6 | 300 | 92.7 | 92.7 | –1.18 |
| 118-3 | 0.40 | 3.3 | 300 | 92.4 | 92.4 | –0.92 |
* The values of DF are corrected to 300 cycles. The actual relative dynamic modulus is shown in final RDM column.
† Not included when averaging center mixes.
Tables 6 and 7 summarize the results of ASTM C457(18) modified point count (MPC) and linear traverse (LT) evaluations on polished surfaces cut axially from 100- by 200-mm cylinders.
The significantly different freeze-thaw resistance of mix 116-1, when compared to the other center mixes, and its low durability factor can be explained by its air void system. It seems that the fresh air content of mix 116-1 was not properly determined, so although the percentage of fresh air showed to be within the target range, both modified point count and linear traverse results show a different scenario. Not only was the air content much lower than the other center mixes, but also the specific surface was much lower and the spacing factor was much higher. As a result, when averaging center mixes, mix 116-1 is disregarded.
| Mix ID | Fresh air (%) |
Air (%) |
Paste (%) |
Voids counted |
MCL (mm) |
Voids per m | Specific surface (mm-1) |
Spacing factor (mm) |
|---|---|---|---|---|---|---|---|---|
| 115-1 | 3.6 | 4.0 | 28.0 | 313 | 0.302 | 138 | 13.6 | 0.406 |
| 115-2 | 3.6 | 3.7 | 25.5 | 219 | 0.385 | 96 | 10.6 | 0.521 |
| 115-3 | 4.6 | 4.1 | 27.0 | 321 | 0.286 | 142 | 14.5 | 0.381 |
| 116-1 | 3.4 | 2.5 | 28.5 | 109 | 0.525 | 49 | 7.6 | 0.876 |
| 116-2 | 2.5 | 3.7 | 28.4 | 127 | 0.660 | 55 | 6.1 | 0.940 |
| 116-3 | 2.4 | 2.4 | 28.1 | 132 | 0.404 | 59 | 10.0 | 0.686 |
| 117-1 | 3.5 | 6.2 | 25.4 | 400 | 0.353 | 175 | 11.3 | 0.368 |
| 117-2 | 2.7 | 3.8 | 26.8 | 105 | 0.822 | 47 | 4.9 | 1.118 |
| 117-3 | 4.4 | 4.6 | 30.7 | 394 | 0.264 | 173 | 15.2 | 0.343 |
| 117-4 | 3.8 | 5.0 | 29.5 | 300 | 0.386 | 132 | 10.7 | 0.483 |
| 118-1 | 4.6 | 7.2 | 26.2 | 658 | 0.249 | 289 | 16.2 | 0.229 |
| 118-2 | 3.6 | 3.9 | 27.1 | 264 | 0.330 | 116 | 12.5 | 0.445 |
| 118-3 | 3.3 | 3.9 | 26.6 | 243 | 0.364 | 106 | 10.5 | 0.483 |
Notes: All results are averages of two tests on two different polished surfaces.
MCL=Mean chord length
| Mix ID | Fresh air (%) |
Air (%) |
Voids counted |
MCL (mm) |
Voids per m | Specific surface (mm-1) |
Spacing factor (mm) |
|---|---|---|---|---|---|---|---|
| 115-1 | 3.6 | 4.8 | 386 | 0.282 | 169 | 14.1 | 0.363 |
| 115-2 | 3.6 | 6.1 | 300 | 0.465 | 130 | 8.6 | 0.533 |
| 115-3 | 4.6 | 5.3 | 463 | 0.262 | 201 | 15.3 | 0.320 |
| 116-1 | 3.4 | 3.8 | 140 | 0.612 | 63 | 6.5 | 0.879 |
| 116-2 | 2.5 | 4.9 | 192 | 0.587 | 83 | 6.8 | 0.744 |
| 116-3 | 2.4 | 3.6 | 178 | 0.460 | 79 | 8.7 | 0.673 |
| 117-1 | 3.5 | 5.4 | 393 | 0.315 | 173 | 12.7 | 0.381 |
| 117-2 | 2.7 | 4.1 | 127 | 0.732 | 55 | 5.5 | 1.011 |
| 117-3 | 4.4 | 5.3 | 473 | 0.257 | 209 | 15.6 | 0.315 |
| 117-4 | 3.8 | 4.9 | 327 | 0.345 | 142 | 11.6 | 0.437 |
| 118-1 | 4.6 | 5.6 | 581 | 0.221 | 256 | 18.1 | 0.264 |
| 118-2 | 3.6 | 4.2 | 276 | 0.345 | 122 | 11.5 | 0.472 |
| 118-3 | 3.3 | 3.9 | 221 | 0.399 | 98 | 10.0 | 0.564 |
Notes: All results are based on one test.
Spacing factors were calculated using paste content from MPC.
MCL=Mean chord length
Figures 16–18 show the influence of the air content (based on fresh air content) on durability. It can be observed that the mixes with fresh air content in the levels of 3.5 percent and 4.5 percent present similar freeze-thaw resistance. They last at least 300 cycles and their durability factors are higher than 80 percent, except for mix 116-1. On the other hand, the mixes with air content around 2.5 percent present much lower freeze-thaw resistance. A correlation of 0.78 was obtained between fresh air content and durability factor. The legends in the figures indicate the mix ID for the plotted points, and text boxes in the figure provide a summary of air content, and DF for each mix. The center mixes are represented by their average RDM (mix 116-1 was not included).
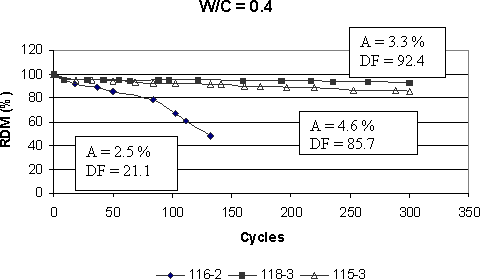
Figure 16. Graph. Relative dynamic modulus versus cycles for mixes with water-cement ratio=0.40.
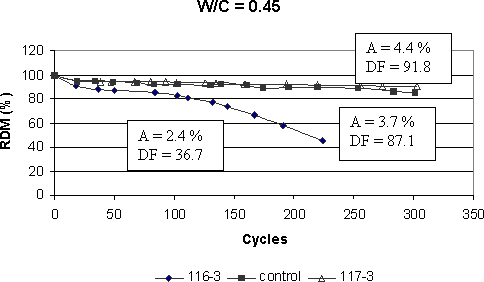
Figure 17. Graph. Relative dynamic modulus versus cycles for mixes with water-cement ratio=0.45.
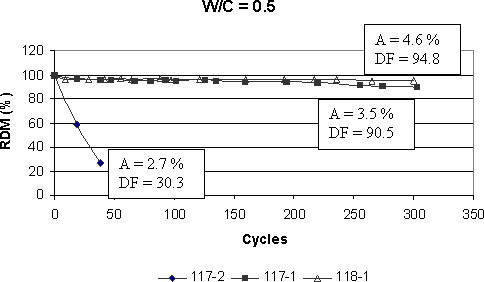
Figure 18. Graph. Relative dynamic modulus versus cycles for mixes with water-cement ratio=0.50.
The water-cement ratio (within the range tested) does not appear to play a significant role on the freeze-thaw resistance (figures 19 and 20). The correlation between water-cement ratio and durability factor was 0.04. Only for mixes with designed air content of 2.5 percent (figure 21), the mix with w/c=0.5 (117-2) shows a much lower freeze-thaw resistance. Nevertheless, this difference in performance seems to be much more related to the air void system (low specific surface and high spacing factor) than to the w/c ratio. It is confirmed if mixes 116-2 and 116-3 are compared, where the latter presents higher specific surface, lower spacing factor, and as a result, better freeze-thaw resistance.
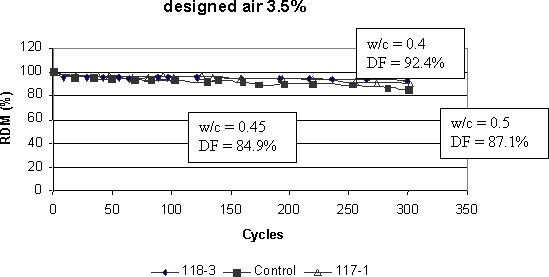
Figure 19. Graph. Relative dynamic modulus versus cycles for mixes with designed air void content of 3.5 percent.
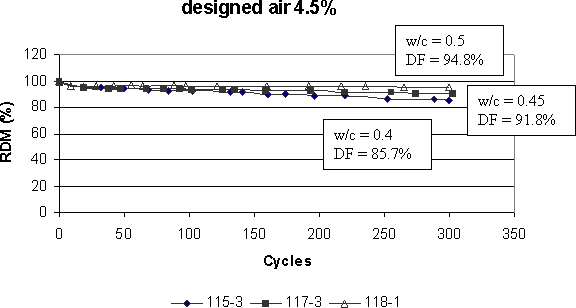
Figure 20. Graph. Relative dynamic modulus versus cycles for mixes with designed air void content of 4.5 percent.
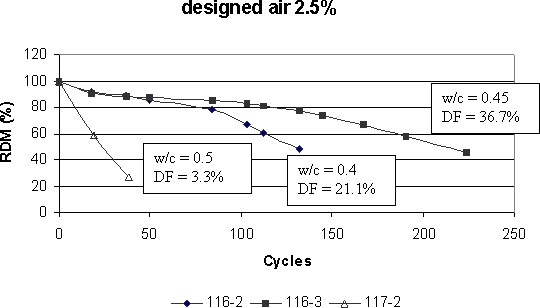
Figure 21. Graph. Relative dynamic modulus versus cycles for mixes with designed air void content of 2.5 percent.
The mass change over cycles can be associated with concrete deterioration. A mass gain can be an indication of cracking formation and water absorption through the cracks. On the other hand, the mass loss can also be related to concrete deterioration in the case where concrete specimens scale significantly during testing. This set of mixes (115–118) did not show any mass gain. Also, the mass loss did not present any trend in relation to air void system parameters (figures 22–24).
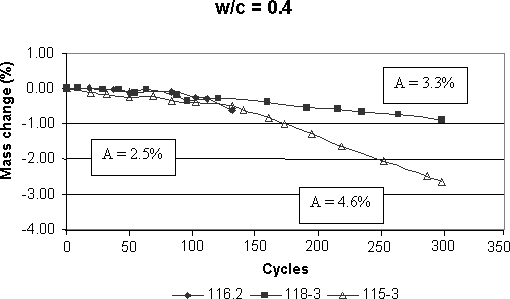
Figure 22. Graph. Mass change versus cycles for mixes with water-cement ratio=0.40.
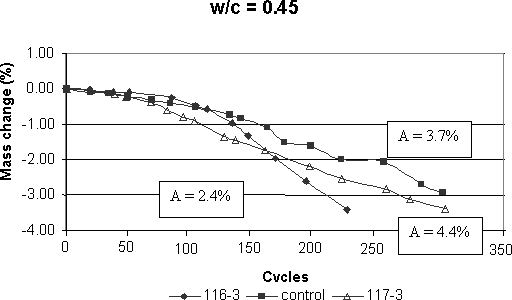
Figure 23. Graph. Mass change versus cycles for mixes with water-cement ratio=0.45.
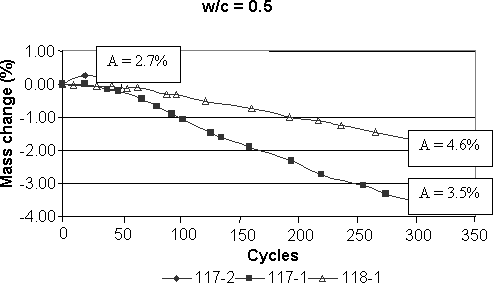
Figure 24. Graph. Mass change versus cycles for mixes with water-cement ratio=0.50.
In terms of air measurement, the fresh air void content, when measured according to ASTM C 231,(14) was always lower than the linear traverse air volume (measured according to ASTM C 457(18)) and, in most of the cases, lower than the modified point count, as well (figure 25).
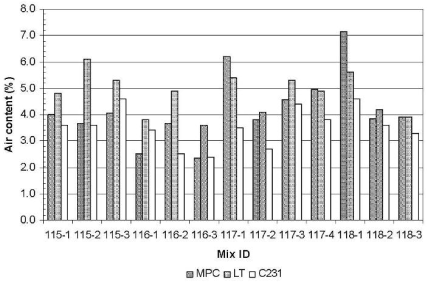
Figure 25. Graph. Comparison among modified point count test, linear traverse test, and fresh air content.
The spacing factor versus the relative dynamic modulus (figure 26) shows a clear trend (with correlation of 0.91): the higher the spacing factor, the lower the RDM. The specific surface shows the same trend (figure 27) but with a lower correlation (0.77).
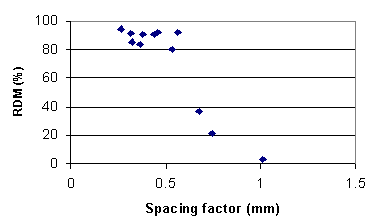
Figure 26. Graph. Relation between spacing factor and relative dynamic modulus.
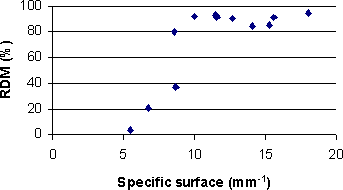
Figure 27. Graph. Relation between specific surface and relative dynamic modulus.

