U.S. Department of Transportation
Federal Highway Administration
1200 New Jersey Avenue, SE
Washington, DC 20590
202-366-4000
Federal Highway Administration Research and Technology
Coordinating, Developing, and Delivering Highway Transportation Innovations
 |
| This report is an archived publication and may contain dated technical, contact, and link information |
|
Publication Number: FHWA-HRT-06-117 Date: December 2006 |
Previous | Table of Contents | Next
The scarcity of Vinsol resin admixture is responsible for the increasing use of synthetic admixtures. The freeze-thaw performance of marginal air mixes containing synthetic admixtures was investigated in a comparison with Vinsol resin. This experiment was made up of concretes with a wide range of air contents, batched with two different air-entraining admixtures (AEA), Vinsol and a synthetic. Freeze-thaw testing was performed using ASTM C 666(21)), Procedure A. Specimens were monitored for changes in resonant frequency (ASTM C 215(22)) and mass at regular intervals. ASTM C457(18) air void system evaluations (both modified point count and linear traverse) were conducted on hardened specimens from each mix.
Two sets of tests were performed—one for each of the two air-entraining admixtures: set 1 containing Vinsol resin air-entraining admixture and set 2 containing synthetic air-entraining admixture. The mix proportion of the two sets was the same. Each set consisted of five concrete mixtures proportioned with w/c ratios of 0.45 and target fresh air contents of 2.5 to 4.5 percent, in increments of 0.5 percent. In set 1, an additional non-air-entrained concrete mixture was also proportioned. The materials used are shown in table 8.
| Component | Set 1 (223–302—VR AEA)) | Set 2 (346–350—SYN AEA)) | |
|---|---|---|---|
| Water | Municipal tap water | Municipal tap water | |
| Cement | Type I | Type I | |
| Fine aggregate | Natural sand | Natural sand | |
| Coarse aggregate | #57 Crushed limestone | #57 Crushed limestone | |
| AEA type | Vinsol resin | Synthetic | |
| WRA | ASTM C 494 Type A*(42) | ASTM C 494 Type A*(42) | |
* The water reducer admixture used in both sets was the same and meet the requirements of ASTM C 494(42) Type A, water-reducing, Type B, retarding, and Type D, water-reducing and retarding, admixtures.
The mixture proportions used for sets 1 and 2 are shown in tables 9 and 10.
| Mix ID | Target air (%) |
Coarse agg (SSD) kg/m3 |
Fine agg (SSD) kg/m3 |
Cement kg/m3 |
Water kg/m3 |
Vinsol AEA L/100kg |
WRA L/100kg |
|---|---|---|---|---|---|---|---|
| 223 | 4.0 | 1015 | 836 | 356 | 160 | 0.033 | 0.210 |
| 224 | 3.5 | 1015 | 836 | 356 | 160 | 0.026 | 0.210 |
| 225 | 3.0 | 1015 | 836 | 356 | 160 | 0.035 | 0.210 |
| 226 | 4.5 | 1015 | 836 | 356 | 160 | 0.048 | 0.210 |
| 227 | 2.5 | 1015 | 836 | 356 | 160 | 0.013 | 0.210 |
| 302 | — | 1015 | 876 | 356 | 160 | 0.000 | 0.415 |
| Mix ID | Target air (%) |
Coarse agg (SSD) kg/m3 |
Fine agg (SSD) kg/m3 |
Cement kg/m3 |
Water kg/m3 |
Synthetic AEA L/100kg |
WRA L/100kg |
|---|---|---|---|---|---|---|---|
| 348 | 2.5 | 1015 | 857 | 356 | 160 | 0.028 | 0.266 |
| 346 | 3.0 | 1015 | 861 | 356 | 160 | 0.039 | 0.266 |
| 347 | 3.5 | 1015 | 857 | 356 | 160 | 0.016 | 0.266 |
| 349 | 4.0 | 1015 | 805 | 356 | 160 | 0.079 | 0.266 |
| 350 | 4.5 | 1015 | 805 | 356 | 160 | 0.138 | 0.266 |
The concrete was mixed in batches of 0.042 m3 in a drum mixer with 0.125 m3 capacity. From each mix in set 1 (223–302), three 100- by 200-mm cylinders for compressive strength and five 75- by 100- by 400-mm beams for freeze-thaw testing were cast. Two cylinders 150- by 300- mm were cast for air void system analysis (ASTM C 457(18)). From each mix in set 2, the same number and type of cylinders were cast along with four beams (same size as set 1).
For set 1, using the Vinsol resin AEA, the mix sequence was as follows:
For set 2, using the synthetic AEA, various trial mix sequences were carried out until the target air content was achieved. The final mix sequence used was quite different from the regular mix procedures used, including the use of warm water and the addition of the two admixtures at the same time:
In set 1, the admixtures were added to the mix separately (AEA first, then WRA); the water was at room temperature. In set 2, however, both admixtures were added at the same time (in accordance with the manufacturer’s recommendations), and the mixing water was warm (around 38 °C), in order to reduce the amount of air entrained. This procedure was necessary because, even when very small amounts of AEA were used, the air content produced exceeded the target values. In both sets of mixes, the coarse aggregates were batched dry, while the sand was batched moist. For each mix, the mixing water contents were adjusted accordingly.
All test specimens were cured in saturated limewater at 23±2 ºC. Compressive strength cylinders were cured for 28 days and freeze-thaw specimens for 14 days. The cylinder ends were ground in a concrete end grinder prior to strength testing per ASTM C 39.(43)
The specimens were tested in accordance with ASTM C666, Procedure A.(21) The specimens were monitored for changes in resonant frequency in accordance with ASTM C 215(22) and for mass changes (to the nearest 1 g) at regular intervals. ASTM C457(18) air void system evaluations (both modified point count and linear traverse) were conducted on hardened specimens from each mix.
The fresh concrete properties for sets 1 and 2 are shown in tables 11 and 12, respectively. A tolerance of 0.2 percent (deviation from target value) for fresh air content was considered acceptable.
| Mix ID | Slump (mm) | Air content (%) | Unit weight (kg/m3) |
|---|---|---|---|
| 223 | 44 | 4.0 | 2368 |
| 224 | 51 | 3.6 | 2379 |
| 225 | 44 | 3.1 | 2397 |
| 226 | 25 | 4.7 | 2349 |
| 227 | 44 | 2.7 | 2393 |
| 302 | 25 | 2.0 | 2400 |
| Mix ID | Slump (mm) | Air content (%) | Unit weight (kg/m3) |
|---|---|---|---|
| 346 | 25 | 3.2 | 2363 |
| 347 | 19 | 3.5 | 2360 |
| 348 | 19 | 2.3 | 2390 |
| 349 | 25 | 4.0 | 2345 |
| 350 | 25 | 4.3 | 2339 |
The strength test results are shown in tables 13 and 14.
| Mix ID | W/C | Fresh air content (%) | Mean 28-day strength (MPa) | Std. dev. (MPa) |
|---|---|---|---|---|
| 223 | 0.45 | 4.0 | 36.4 | 2.0 |
| 224 | 0.45 | 3.2 | 39.4 | 1.6 |
| 225 | 0.45 | 3.1 | 38.5 | 1.8 |
| 226 | 0.45 | 4.7 | 38.1 | 1.3 |
| 227 | 0.45 | 2.7 | 43.2 | 0.1 |
| 302 | 0.45 | 2.0 (Non-air-entrained) | 49.5 | 4.1 |
All results based on 3 tests of 100- by 200-mm cylinders.
| Mix ID | W/C | Fresh air content (%) | Mean 28-day strength (MPa) | Std. dev. (MPa) |
|---|---|---|---|---|
| 346 | 0.45 | 3.2 | 44.8 | 1.0 |
| 347 | 0.45 | 3.5 | 35.0 | 1.2 |
| 348 | 0.45 | 2.3 | 42.5 | 1.0 |
| 349 | 0.45 | 4.0 | 38.1 | 0.4 |
| 350 | 0.45 | 4.3 | 32.6 | 1.8 |
All results based on 3 tests of 100- by 200-mm cylinders
Table 15 presents the air void system for set 1 (223–227). The air void parameters were determined according to ASTM C 457(18) (linear traverse) and represent the average of two measurements. The combined linear traverse and point count results can be found in appendix B. The air system of mix 302 (set 1) (non-entrained-air concrete) was not determined.
| Mix | Fresh air (ASTM C 231) | Air (%) ASTM C 457 | Chord length (mm) |
Voids counted | Mean chord length (mm) | Voids per m | Specific surface (mm2/mm3) | Spacing factor (mm) |
|---|---|---|---|---|---|---|---|---|
| 223 | 4 | 2.4 | 55 | 276 | 0.22 | 120 | 19.9 | 0.38 |
| 224 | 3.6 | 2.8 | 64 | 215 | 0.30 | 93 | 13.5 | 0.49 |
| 225 | 3.1 | 4.2 | 94 | 288 | 0.33 | 126 | 12.2 | 0.45 |
| 226 | 4.7 | 4.7 | 106 | 495 | 0.21 | 215 | 18.7 | 0.28 |
| 227 | 2.7 | 3.3 | 74 | 212 | 0.35 | 93 | 11.5 | 0.54 |
All mixes of set 1 presented marginal air void contents. The spacing factors were higher than the maximum value (0.2 mm) normally required for a good freeze-thaw resistance (most of them were above 0.36 mm) and the specific surface areas were lower than the normally desired (24 mm-1) for the total air volume in the range of the mixes for this study. Some of the mixes had specific surface area half of that, for example mix 227.
One could expect that the freeze-thaw performance of those mixes would not be adequate. Nevertheless, table 16 shows that DFs were above 80 percent, excepting for the non-air-entrained mix 302, which could be considered a satisfactory performance. All the air-entrained mixes withstood at least 300 cycles, excluding beam 224-A5 that suffered some damage during the handling of the specimen not related to testing. The tables and the graphs of the RDM over cycles can be found in appendix B.
| Mix | Fresh air (%) | Durability factor | |||||||
|---|---|---|---|---|---|---|---|---|---|
| A1 | A2 | A3 | A4 | A5 | Proc A avg | Proc A std dev | |||
| 302 | 2.0 non A/E | 14.4 | 14.5 | 16.7 | 12.1 | 15.4 | 14.4 | 1.9 | |
| 227 | 2.7 | 86.7 | 88.1 | 86.8 | 89.9 | 76.8 | 87.9 | 1.5 | |
| 225 | 3.1 | 89.4 | 90.5 | 90.0 | 90.8 | 88.2 | 90.2 | 0.6 | |
| 224 | 3.6 | 85.7 | 87.2 | 85.4 | 84.4 | 00.0* | 85.7 | 1.2 | |
| 223 | 4.0 | 89.6 | 88.5 | 89.7 | 84.4 | 92.0 | 88.9 | 2.8 | |
| 226 | 4.7 | 92.1 | 94.0 | 93.0 | 95.0 | 95.3 | 93.5 | 1.3 | |
* The DF for 224-A5 was not included when calculating averages and standard deviations
Figure 28 shows the RDM versus cycles for one of the air entrained concretes (mix 225), which is representative of the mixes of set 1, excepting mix 302 (figure 29).
Figure 28. Graph. Relative dynamic modulus versus cycles for mix 225
(VR AEA—3.1 percent fresh air content). Individual specimens are shown.
“A” stands for specimens tested according to Procedure A.
Figure 29. Graph. Relative dynamic modulus versus cycles for mix 302 (non-air-entrained). Individual specimens are shown. “A” stands for specimens tested according to Procedure A.
Set 2 presented a much better air system, with respect to spacing factor and specific surface area, but most of the mixes remained in the range of marginal air void parameters (table 17). The air void parameters were determined according to ASTM C 457(18) (linear traverse) and represented the average of two measurements. Figures 30 and 31 show the differences in the air void chord size distributions from linear traverse results for the two different admixture types, sets 1 and 2, respectively. It is important to mention that the air was well distributed and no clustering was observed.
| Mix | Fresh air (ASTM C 231) | Air (%) ASTM C 457 | Accum. chord length (mm) | Accum. voids counted | Mean chord length (mm) | Voids per m | Specific surface (mm2/mm3) | Spacing factor (mm) |
|---|---|---|---|---|---|---|---|---|
| 346 | 3.2 | 4.4 | 101 | 632 | 0.16 | 280 | 25.2 | 0.21 |
| 347 | 3.5 | 4.6 | 104 | 642 | 0.16 | 280 | 25.0 | 0.22 |
| 348 | 2.3 | 4.2 | 95 | 352 | 0.27 | 154 | 15.0 | 0.37 |
| 349 | 4 | 4.5 | 101 | 887 | 0.11 | 388 | 35.3 | 0.15 |
| 350 | 4.3 | 5.0 | 114 | 966 | 0.12 | 423 | 33.8 | 0.15 |
Figure 30. Graph. Bubble size distribution by C 457 (linear traverse) of set 1 with Vinsol resin admixture.
Figure 31. Graph. Bubble size distribution by C 457 (linear traverse) of set 2 with synthetic air-entraining admixture.
However, the freeze-thaw performance of set 2 was worse than that of set 1 (table18 and figures 32–35). Only mix 350 (the highest air volume, lowest spacing factor, and highest specific surface) had a DF above 80 percent. The tables of the RDM over cycles and the combined linear traverse and point count results can be found in appendix B.
| Mix | Fresh air (%) | A1 | A2 | A3 | A4 | Proc A avg | Proc A std dev |
|---|---|---|---|---|---|---|---|
| 348 | 2.3 | 38.3 | 22.2 | 29.4 | 24.9 | 28.7 | 7.1 |
| 346 | 3.2 | 66.2 | 46.0 | 56.9 | 53.4 | 55.6 | 8.4 |
| 347 | 3.5 | 68.0 | 78.3 | 77.1 | 78.8 | 75.6 | 5.1 |
| 349 | 4.0 | 82.4 | 62.5 | 50.6 | 66.9 | 65.6 | 13.2 |
| 350 | 4.3 | 76.6 | 86.2 | 83.1 | 83.5 | 82.3 | 4.1 |
Figure 32. Graph. Comparison between mixes prepared with Vinsol resin air-entrained admixture (set 1) and synthetic air-entrained admixture (set 2).
Figure 33. Graph. Relation between durability factor and spacing factor of mixes with Vinsol resin admixture (set 1) or synthetic admixture (set 2).
Figure 34. Graph. Relation between durability factor and specific surface of mixes with Vinsol resin admixture (set 1) or synthetic admixture (set 2).
Figure 35. Graph. Relation between durability factor and hardened air content of mixes with Vinsol resin admixture (set 1) or synthetic admixture (set 2).
Figure 36 shows the DF versus fresh air for sets 1 and 2. For set 1, it can be observed that the marginal air void concretes had similar freeze-thaw resistance, but if no air entrainment is provided, the freeze-thaw resistance of the concrete is much poorer.For set 2, the higher the fresh air content (ASTM C 231(14)), the higher the DF.
Figure 36. Graph. Relation between durability factor and fresh air content of mixes with Vinsol resin admixture (set 1) or synthetic admixture (set 2).
All specimens suffered some mass change (loss) during testing. The mass loss is a good indication of the scaling of the specimen (figure 37). Mass losses ranged from 0.32 to 4.03 percent (figure 38). Any mass gain due to water entering the concrete through cracks was obscured by the losses due to scaling. No correlation was observed between mass loss and the freeze-thaw performance of sets 1 and 2. The mass change versus cycles can be found in appendix B.
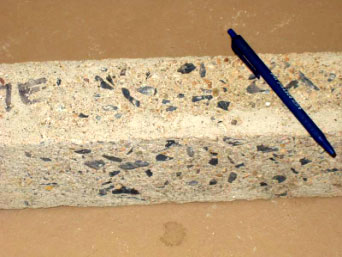
Figure 37. Photo. Scaling of typical specimen. The specimens tended to scale toward the center region of the beam specimens corresponding to the area where the metal containers bulged due to ice formation between the concrete and the container.
Figure 38. Graph. Mass change of mixes with Vinsol resin admixture (set 1) or synthetic admixture (set 2).
It must be pointed out that set 1 and set 2 differ only in the type of air-entraining admixture—set 1 has Vinsol resin and set 2, synthetic. For the mixes prepared in this study and for the specific admixtures used, the Vinsol resin mixes exhibited better freeze-thaw resistance although they had a worse air void system.
The reasons for this unexpected observation are not known. It is possible that the water reducer or the cement used had an influence in the efficiency of the air void system. Another possibility is that the air-entraining admixture contains nonionic surfactants, which could result in a lack of a hydrophobic “tail” oriented towards the interior of the air bubbles, preventing water intrusion as pressure develops during freezing.(26) A previous study(44) showed that the cement-alkali level may have a negative impact on the air void system, and as a consequence for the freeze-thaw performance, on concretes with synthetic air-entraining admixture.
There are well-established thresholds for the air void parameters, which date from the time when only Vinsol resin admixtures were available. Experience shows that these limits (> 6 ± 1 percent air, specific surface ≥ 24 mm2/mm3, and spacing factor ≤ 0.20 mm) would be expected to give good concrete freeze-thaw resistance. The test data presented in this chapter suggest these limits may not be adequate to assure durability for some air entrained concrete containing synthetic admixtures.
There is insufficient data in this study to generalize this finding for all Vinsol resin and synthetic admixtures and all levels of air content. More research is needed in order to confirm this finding.

