U.S. Department of Transportation
Federal Highway Administration
1200 New Jersey Avenue, SE
Washington, DC 20590
202-366-4000
Federal Highway Administration Research and Technology
Coordinating, Developing, and Delivering Highway Transportation Innovations
 |
| This report is an archived publication and may contain dated technical, contact, and link information |
| breadcrumb |
Publication Number: FHWA-HRT-04-042
Date: July 2004 |
||
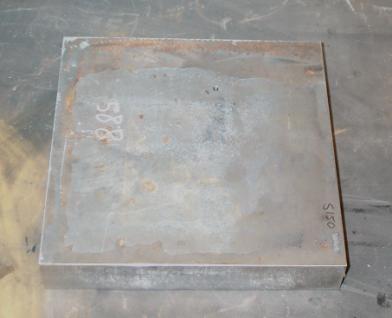
Guidelines for Ultrasonic Inspection of Hanger Pins3. EXPERIMENTAL PROGRAM3.1. INTRODUCTION A laboratory experimental program was initiated to gain an understanding of some of the key issues presented previously. The experimental program included testing of a steel block to illustrate the principles of beam diffraction and distance amplitude correction. Also, pins with manufactured cracks were tested to study angle and straight beam sensitivity to cracks, defect sizing, and the acoustic coupling phenomenon. 3.2. INSPECTION SPECIMENS To accomplish the experimental program described here, 7 specimens were used. This consisted of a test block with a side-drilled hole, 5 pins with implanted cracks, and a pin/hanger mockup. Each specimen is described briefly below. 3.2.1. Side-Drilled Hole Test Block The side-drilled hole test block (SDHTB) is shown in figures 21 and 22. The test block is a 305-mm x 305-mm x 51-mm (12-inch x 12-inch x 2-inch) steel plate with a 6-mm (0.2-inch) hole drilled through the thickness.
Figure 22. Photograph of the SDHTB. 3.2.2. Manufactured Cracked Pins Five pins, removed from service in 1999, had a total of 7 cracks implanted at various locations. The typical geometry of the pins is shown in figure 23. All cracks were surface breaking and were oriented such that the defect was perpendicular to the length of the pin. Figures 24 through 28 illustrate the location and approximate size and shape of the cracks. As can be seen from these figures, the cracks represent a wide cross section of defect sizes and shapes. Further, these defects are representative of the range of defects one might expect to exist in actual pin and hanger connections.
1 inch = 25.4 mm Figure 23. Typical pin geometry.
1 inch = 25.4 mm Figure 24. Pin 1 defect details.
1 inch = 25.4 mm Figure 25. Pin 2 defect details.
1 inch = 25.4 mm Figure 26. Pin 3 defect details.
1 inch = 25.4 mm Figure 27. Pin 4 defect details.
1 inch = 25.4 mm Figure 28. Pin 5 defect details. 3.2.3. Pin/Hanger Mockup As was discussed previously, the phenomenon known as acoustic coupling has recently been a topic of significant debate. The ability to generate acoustic coupling in a pin/hanger connection requires two elements: a realistic connection geometry, and realistic load levels. To simulate these conditions, a pin/hanger connection mockup based on actual field geometry was developed. The mockup is shown schematically in figure 29. The pin used in the mockup has the same geometrical characteristics as the other pins used in this study. The rest of the mockup consists of three plates and two load platens. The three plates represent the suspended span web and two hanger plates found in a typical connection.
1 inch = 25.4 mm Figure 29. Pin/hanger mockup details. 3.3. TESTING PROGRAM The specific details of the testing program are described in the following five sections. For each test type, the number of tests conducted and the specimens used are described. In addition, where applicable, details about the specific transducers used are presented. 3.3.1. Beam Diffraction Beam diffraction testing was completed on the SDHTB specimen. Six different transducers were used with angles of 0.00, 8.02, 10.89, and 13.15 degrees and frequencies of 2.25 and 5 MHz. During this testing, each transducer was translated along each edge of the SDHTB in 3-mm (0.1-inch) increments with the return signal level for 80 percent screen height from the side-drill hole noted at each location. From this, a profile of return signal strength was generated. This type of test illustrates the amount of beam spread present in each transducer and how the depth of penetration influences the beam spread. 3.3.2. Distance Amplitude Correction Similar to the beam diffraction testing, the distance amplitude correction testing was also completed with the SDHTB. For this testing, the transducer was placed on each edge of the SDHTB such that the return signal was maximized. Four different signal amplitudes with accompanying sound path distances could be generated with this setup. With these four data points for each transducer, the DAC curve could be generated. 3.3.3. Angle and Straight Beam Sensitivity to Cracks To investigate the sensitivity levels for angle and straight beam transducers with respect to cracks, "normal" pin inspections were completed on the manufactured cracked pin samples described previously. This means that each pin was inspected following the general procedures outlined previously with the goal of locating any defects. A single angle beam transducer, which had been optimized for the shear plane location, was used for the angle beam testing. For the subject cracked pin specimens, the selected transducer had an incident angle of 13.15 degrees with a frequency of 5 MHz with a 13-mm (0.5-inch) diameter beam. The straight beam transducer was 13 mm (0.5 inch) in diameter with a frequency of 5 MHz. Through this type of testing, one can study, qualitatively, the ability of each transducer to detect cracks of various sizes. 3.3.4. Defect Sizing For this testing, each defect in the manufactured cracked pin specimens was sized using ultrasonic contact and immersion tank techniques. The manual ultrasonic sizing utilized a combination of straight and angle beam transducers. The technique used was most similar to the 6-dB drop method described previously. The immersion tank sizing was completed solely with a straight beam transducer and varying gain levels. The immersion tank testing was completed following established techniques for these types of inspections. 3.3.5. Acoustic Coupling To verify the presence of acoustic coupling, the pin/hanger connection mockup described previously was used in combination with a hydraulic load frame. During this testing, various combinations of transducers were used to verify the presence of acoustic coupling under varying load conditions. The hydraulic load frame had the capability of applying 20 kips (1 kip is equal to 1,000 pounds) compression to the pin/hanger connection mockup which is equivalent to the load level experienced in a lightly loaded bridge. This type of setup allowed the presence of acoustic coupling to be verified in both the pitch-catch and pulse-echo formats; it will be described later. Previous | Table of Contents | Next
|