Guidelines for Ultrasonic Inspection of Hanger Pins, 4. Experimental Results
4.4. DEFECT SIZING
To study the ability of manual ultrasonic testing to evaluate crack sizes, the five previously described manufactured pins, with known defect sizes, were used. Further, immersion tank ultrasonic testing was also completed to provide additional data for evaluating the conventional ultrasonic test results. The results included in table 1 summarize the depth of the crack into the pin and the width of the crack around the circumference. Tables 2 and 3 give the error and the
absolute value of the error, based on the as-built dimensions, for each technique. As can be seen from this data, the manual ultrasonic sizing tended to overestimate the crack size. On the other hand, the immersion tank
ultrasonic sizing tended to overestimate the size of smaller cracks but underestimated the size of larger cracks. The overestimation that occurred in the immersion tank testing was most
likely the result of the calibration techniques used and various geometrical constraints. The underestimation of large defects can most likely be attributed to cotter pin effects. Regardless of the technique used, for
defects of similar size and shape, the sizing results are relatively consistent indicating the repeatability of the two techniques.
Table 1. Defect size data.
Specimen |
Flaw Number |
As-built |
Immersion tank UT |
Manual UT |
Depth, inches |
Width, inches |
Depth, inches |
Width, inches |
Depth, inches |
Width, inches |
| Pin 1 |
1 |
0.125 |
0.249 |
0.150 |
0.280 |
0.094 |
0.380 |
| Pin 2 |
1 |
0.250 |
0.514 |
0.320 |
0.170 |
0.380 |
0.690 |
Pin 2 |
2 |
0.250 |
0.514 |
0.325 |
0.269 |
0.310 |
0.690 |
Pin 3 |
1 |
0.500 |
1.000 |
0.486 |
0.372 |
0.780 |
1.250 |
Pin 3 |
2 |
0.500 |
1.000 |
0.458 |
0.469 |
0.750 |
0.880 |
Pin 4 |
1 |
0.750 |
0.748 |
0.620 |
0.321 |
0.750 |
0.660 |
Pin 5 |
1 |
1.000 |
0.993 |
0.880 |
0.910 |
0.930 |
0.875 |
1 inch = 25.4 mm
Table
2. Defect sizing error.
Specimen |
Flaw Number |
Immersion tank UT |
Manual UT |
Depth, % |
Width, % |
Depth, % |
Width, % |
Pin 1 |
1 |
20.0 |
12.0 |
-25.0 |
53.0 |
Pin 2 |
1 |
28.0 |
-67.0 |
52.0 |
34.0 |
Pin 2 |
2 |
30.0 |
-48.0 |
24.0 |
34.0 |
Pin 3 |
1 |
-2.8 |
-63.0 |
56.0 |
25.0 |
| Pin 3 |
2 |
-8.4 |
-53.0 |
50.0 |
-12.0 |
Pin 4 |
1 |
-17.0 |
-57.0 |
0.0 |
-12.0 |
Pin 5 |
1 |
-12.0 |
-80.0 |
-7.0 |
-12.0 |
Table 3. Absolute value of defect sizing error.
| Specimen |
Flaw Number |
Immersion tank UT |
Manual UT |
Depth, % |
Width, % |
Depth % |
Width % |
Pin 1 |
1 |
20.0 |
12.0 |
25.0 |
53.0 |
Pin 2 |
1 |
28.0 |
67.0 |
52.0 |
34.0 |
Pin 2 |
2 |
30.0 |
48.0 |
24.0 |
34.0 |
Pin 3 |
1 |
2.8 |
63.0 |
56.0 |
25.0 |
Pin 3 |
2 |
8.4 |
53.0 |
50.0 |
12.0 |
Pin 4 |
1 |
17.0 |
57.0 |
0.0 |
12.0 |
Pin 5 |
1 |
12.0 |
8.4 |
7.0 |
12.0 |
Average |
17.0 |
44.0 |
31.0 |
26.0 |
Standard deviation |
10.0 |
24.0 |
23.0 |
16.0 |
4.5. ACOUSTIC COUPLING
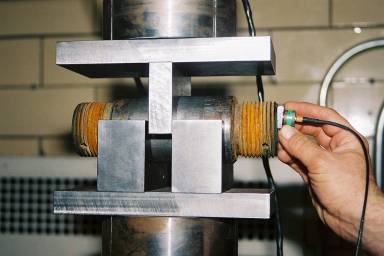
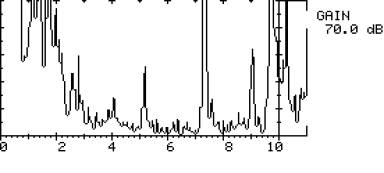
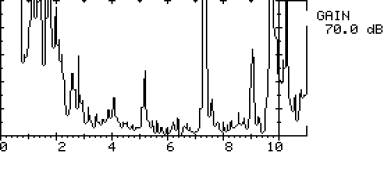
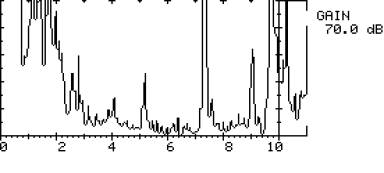
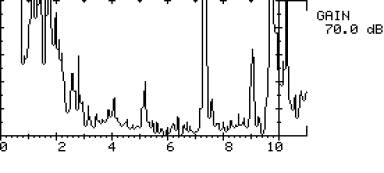
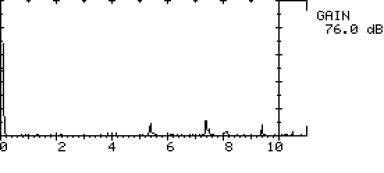
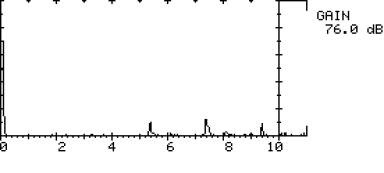
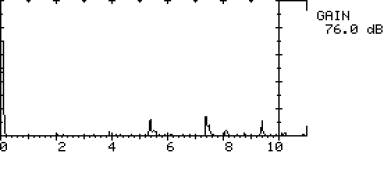
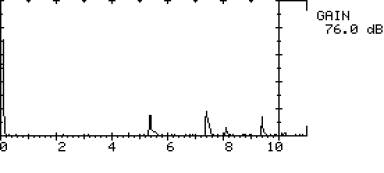
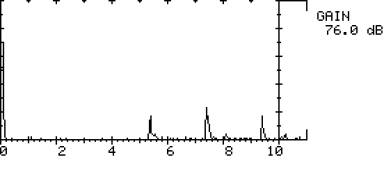
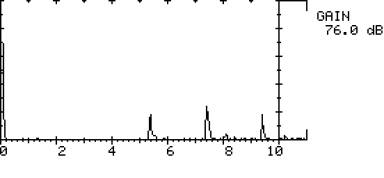
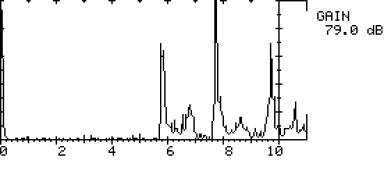
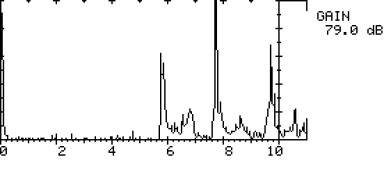
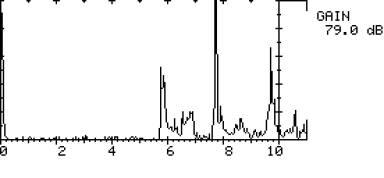
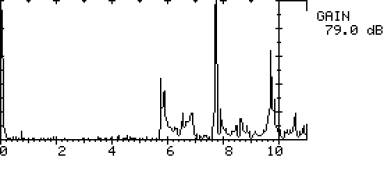
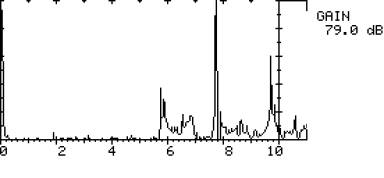
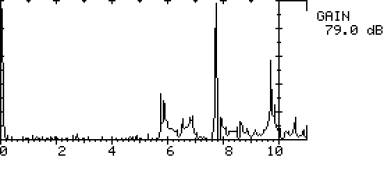
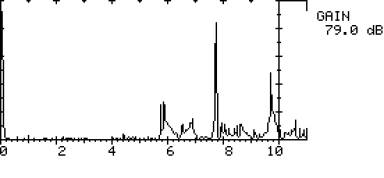
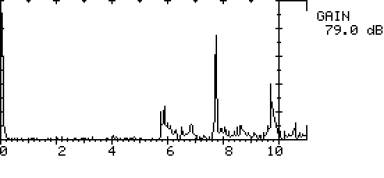
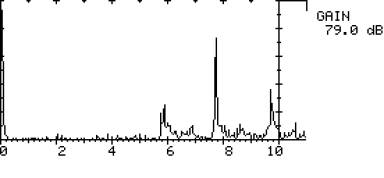
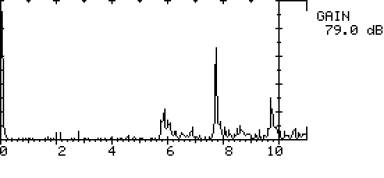
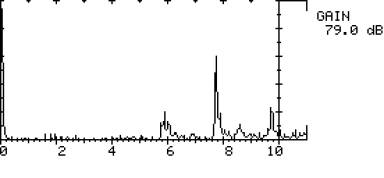
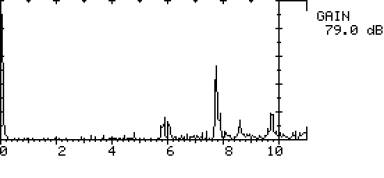
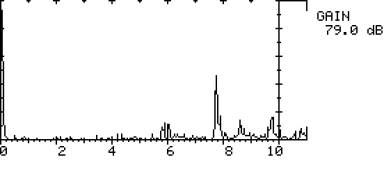
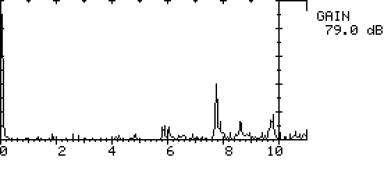
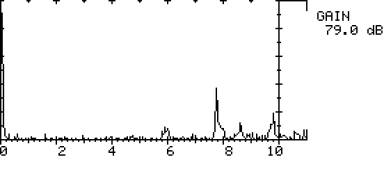
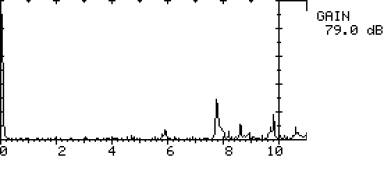
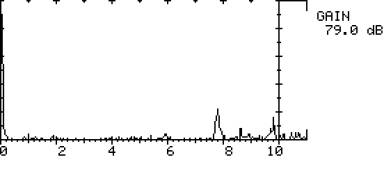
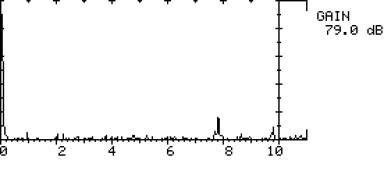
Photographs of the setups used during the acoustic coupling testing are shown in figures 47, 49, and 51 with the corresponding results given in figures 48, 50, and 52. As can be seen in figure 47, a 14-degree
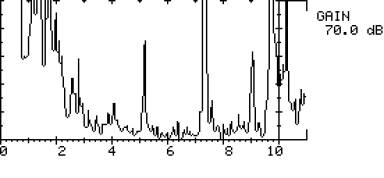
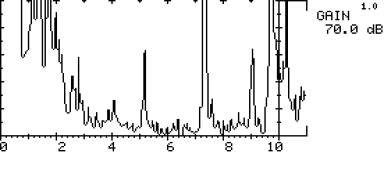
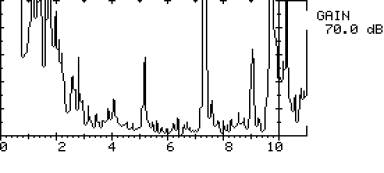
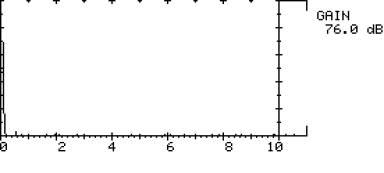
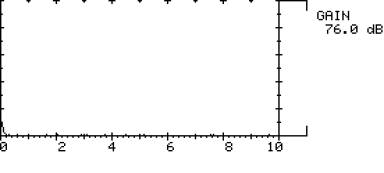
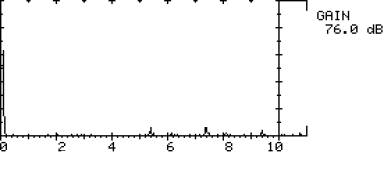
transducer in the pulse-echo format was first used to investigate the presence of acoustic coupling. Note in figure 48 the indication near the "5" gradation along the horizontal scale. As can be seen in the series of scans, as
the load decreases, the intensity of the signal decreases; suggesting that the indication is load dependent. In short, the amount of sound transmitted across the interface between the pin and the
test frame is dependent upon the magnitude of the applied load.
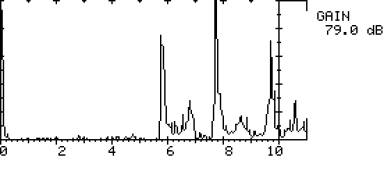
As can be seen in figure 49, the second test investigating acoustic coupling utilized two 0-degree transducers in the pitch-catch format. For this testing, if the receiving transducer picks up a signal, then it is clear that a signal from the transmitter is crossing the interface between the pin and the test frame. As can be seen in figure 50, this is the case and is, as before, load dependent. Similarly, the setup shown in figure 51 with corresponding data in figure 52 further illustrates the presence of acoustic coupling under a decreasing load.
 1 KN = 225 pounds
 |
| Figure 47. Photograph of pulse-echo setup using 14-degree transducer. |
 1 KN = 225 pounds
 |
a. Load step 1: 88.96 Kilonewton (KN). |
 1 KN = 225 pounds
 |
|
b. Load step 2: 84.51 KN. |
Figure 48. UT scan utilizing pulse-echo technique with a 14-degree transducer.
 1 KN = 225 pounds
 |
c. Load step 3: 80.07 KN. |
 1 KN = 225 pounds
 |
d. Load step 4: 75.62 KN. |
 1 KN = 225 pounds
 |
e. Load step 5: 71.17 KN. |
 1 KN = 225 pounds 1 KN = 225 pounds |
f. Load step 6: 66.72 KN. |
Figure 48. (Continued) UT scan utilizing pulse-echo technique with a 14-degree transducer.
 1 KN = 225 pounds
 |
g. Load step 7: 62.28 KN. |
 1 KN = 225 pounds
 |
h. Load step 8: 57.83. |
 1 KN = 225 pounds
 |
i. Load step 9: 53.38 KN. |
 1 KN = 225 pounds
 |
j. Load step 10: 48.93 KN. |
Figure 48. (Continued) UT scan utilizing pulse-echo technique with a 14-degree transducer.
 1 KN = 225 pounds
 |
k. Load step 11: 44.48 KN. |
Figure 48. (Continued) UT scan utilizing pulse-echo technique with a 14-degree transducer.
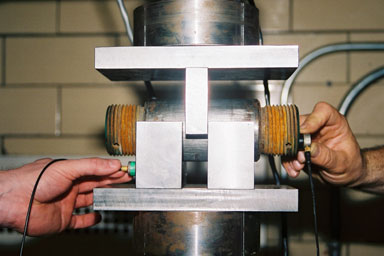 |
Figure 49. Photograph of pitch-catch setup using 0-degree transducers. |
 1 KN = 225 pounds
 |
a. Load step 1: 0.00 KN. |
Figure 50. UT scan utilizing pitch-catch technique using 0-degree transducers.
 1 KN = 225 pounds
 |
b. Load step 2: 8.89 KN. |
 1 KN = 225 pounds
 |
c. Load step 3: 13.34 KN. |
 1 KN = 225 pounds
 |
d. Load step 4: 17.79 KN. |
 1 KN = 225 pounds
 |
e. Load step 5: 22.24 KN. |
Figure
50. (Continued) UT scan utilizing pitch-catch technique using 0-degree transducers.
 1 KN = 225 pounds
 |
f. Load step 6: 26.69 KN. |
 1 KN = 225 pounds
 |
g. Load step 7: 31.14 KN. |
 1 KN = 225 pounds
 |
h. Load step 8: 35.59 KN. |
 1 KN = 225 pounds
 |
i. Load step 9: 40.03 KN. |
Figure 50. (Continued) UT scan utilizing pitch-catch technique using 0-degree transducers.
 1 KN = 225 pounds
 |
j. Load step 10: 44.48 KN. |
 1 KN = 225 pounds
 |
k. Load step 11: 48.93 KN. |
 1 KN = 225 pounds 1 KN = 225 pounds |
l. Load step 12: 53.38 KN. |
 1 KN = 225 pounds
 |
m. Load step 13: 57.82 KN. |
Figure
50. (Continued) UT scan utilizing pitch-catch technique using 0-degree transducers.
 1 KN = 225 pounds
 |
n. Load step 14: 62.28 KN. |
 1 KN = 225 pounds
 |
o. Load step 15: 66.72 KN. |
 1 KN = 225 pounds
 |
p. Load step 16: 71.17 KN. |
 1 KN = 225 pounds
 |
|
q. Load step 17: 75.62 KN. |
Figure 50. (Continued) UT scan utilizing pitch-catch technique using 0-degree transducers.
 1 KN = 225 pounds
 |
r. Load step 18: 80.07 KN. |
 1 KN = 225 pounds
 |
s. Load step 19: 84.52 KN. |
 1 KN = 225 pounds
 |
t. Load step 20: 88.96 KN. |
Figure 50. (Continued) UT scan utilizing pitch-catch technique using 0-degree transducers.
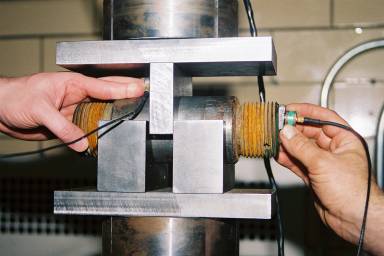 |
Figure 51. Photograph of pitch-catch setup using 0-degree receiving and 14-degree transmitting transducers. |
 1 KN = 225 pounds
 |
a. Load step 1: 88.96 KN. |
 1 KN = 225 pounds
 |
b. Load step 2: 84.52 KN. |
Figure 52. UT scan utilizing pitch-catch technique using 0-degree and 14-degree transducers.
 1 KN = 225 pounds
 |
c. Load step 3: 80.07 KN. |
 1 KN = 225 pounds
 |
d. Load step 4: 75.62 KN. |
 1 KN = 225 pounds
 |
e. Load step 5: 71.17 KN. |
Figure 52. (Continued) UT scan utilizing pitch-catch technique using 0-degree and 14-degree transducers.
 1 KN = 225 pounds
 |
f. Load step 6: 66.72 KN. |
 1 KN = 225 pounds
 |
g. Load step 7: 62.28 KN. |
 1 KN = 225 pounds
 |
h. Load step 8: 57.83 KN. |
Figure 52. (Continued) UT scan utilizing pitch-catch technique using 0-degree and 14-degree transducers.
 1 KN = 225 pounds
 |
i. Load step 9: 53.38 KN. |
 1 KN = 225 pounds
 |
j. Load step 10: 48.93 KN. |
 1 KN = 225 pounds
 |
k. Load step 11: 44.48 KN. |
Figure
52. (Continued) UT scan utilizing pitch-catch technique using 0-degree and 14-degree transducers.
 1 KN = 225 pounds
 |
l. Load step 12: 40.03 KN. |
 1 KN = 225 pounds
 |
m. Load step 13: 35.59 KN. |
 1 KN = 225 pounds
 |
n. Load step 14: 31.14 KN. |
Figure
52. (Continued) UT scan utilizing pitch-catch technique using 0-degree and 14-degree transducers.
 1 KN = 225 pounds
 |
o. Load step 15: 26.69 KN. |
 1 KN = 225 pounds
 |
p. Load step 16: 22.24 KN. |
 1 KN = 225 pounds
 |
q. Load step 17: 17.79 KN. |
Figure 52. (Continued) UT scan utilizing pitch-catch technique using 0-degree and14-degree transducers.
 1 KN = 225 pounds
 |
r. Load step 18: 13.34 KN. |
 1 KN = 225 pounds
 |
s. Load step 19: 8.90 KN. |
 1 KN = 225 pounds
 |
t. Load step 20: 4.45 KN. |
Figure 52. (Continued) UT scan utilizing pitch-catch technique using 0-degree and 14-degree transducers.
 1 KN = 225 pounds
 |
u. Load step 21: 0.00 KN. |
Figure 52. (Continued) UT scan utilizing pitch-catch technique using 0-degree and 14-degree transducers.
5.
CONCLUDING REMARKS
The information presented herein should be useful for State departments of transportation and organizations providing ultrasonic testing services. Although not all-inclusive, this document summarizes the important aspects of ultrasonic testing of pins and can enhance the more effective use of inspection resources and inspection results. In addition, the laboratory testing completed as part of this study should be useful in understanding the mechanics of ultrasonic testing. Further, the concrete and indisputable evidence of acoustic coupling should allow ultrasonic testing results to be interpreted more accurately.
Previous | Table of Contents
|


