Guidelines for Ultrasonic Inspection of Hanger Pins, 4 Experimental Results
4.3. ANGLE AND STRAIGHT BEAM SENSITIVITY TO CRACKS
As mentioned previously, to study the sensitivity of angle and straight beam transducers to cracks, "normal" pin inspection procedures were completed on each of the pins with manufactured cracks. From these results one can infer the relative sensitivity of each transducer to the cracks found in these specimens. The data for each of the pins are summarized in figures 42 through 46. Each figure gives the raw inspection data
and a graphical representation of the scan results. Parts B and E of each figure show the centerline path of the ultrasonic beam as it traveled from the transducer to the indication. Parts C and F of each figure summarize the location of peak signal strength (indicated by the large dot) and the range about the circumference over which the typical signal was observed. Note that in parts B and E of each figure,
the dotted line represents the known location of the cracks. As can be seen from the data, regardless of the transducer used, the inspector was relying on the beam spread to identify each crack. This may not always be the case in a typical pin inspection. Also of interest is the fact that for the smallest defect, the straight beam
transducer was not able to reliably detect the crack. Further, the crack could only be identified when the inspector was aware that a crack existed. This finding illustrates the importance of selecting the correct transducer for each inspection.
| |
Note |
Scan angle, deg |
Indication level, dB |
Reference level, dB |
Reading location, hh:mm |
Beginning of signal location, hh:mm |
End of signal location, h:mm |
Distance to index, inches |
Sound path distance, inches |
Axial distance, inches |
Radial distance, inches |
Red |
1 |
0 |
73 |
47 |
7:30 |
7:30 |
7:30 |
1 |
3.9 |
3.9 |
1.00 |
Green |
2 |
11 |
57 |
47 |
7:30 |
7:00 |
8:00 |
5/8 |
3.9 |
3.83 |
1.37 |
Unit conversion: 1 inch = 25.4 mm |
a. Raw inspection data for end 1 scanning.
b. Pin elevation for end 1 scanning.
c. Pin cross section for end 1 scanning.
Figure 42. Pin 1 testing results.
| |
Note |
Scan angle, deg |
Indication level, dB |
Reference level, dB |
Reading location, hh:mm |
Beginning of signal location, hh:mm |
End of signal location, hh:mm |
Distance to index, inches |
Sound path distance, inches |
Axial distance, inches |
Radial distance, inches |
Red  |
1 |
11 |
63 |
47 |
5:00 |
5:00 |
5:00 |
5/8 |
5.15 |
5.06 |
1.61 |
Green |
2 |
14 |
59 |
43 |
5:00 |
5:00 |
5:00 |
9/16 |
5.15 |
5.00 |
1.81 |
Unit conversion: 1 inch = 25.4 mm |
d. Raw inspection data for end 2 scanning.

e. Pin elevation for end 2 scanning.
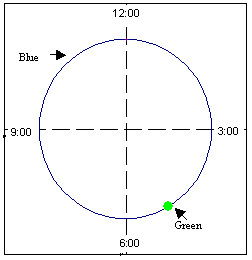
f. Pin cross section for end 2 scanning.
Figure 42. (Continued) Pin 1 testing results.
| |
Note |
Scan angle, deg |
Indication level, dB |
Reference level, dB |
Reading location, hh:mm |
Beginning of signal location, hh:mm |
End of signal location, hh:mm |
Distance to index, inches |
Sound path distance, inches |
Axial distance, inches |
Radial distance, inches |
Red  |
1 |
0 |
58 |
47 |
1:30 |
1:00 |
2:00 |
1 |
3.80 |
3.80 |
1.00 |
Orange |
2 |
0 |
58 |
47 |
5:00 |
5:00 |
5:00 |
1 |
5.95 |
5.95 |
1.00 |
Blue |
3 |
14 |
43 |
43 |
1:00 |
1:00 |
2:30 |
7/16 |
3.95 |
3.83 |
1.39 |
Green |
4 |
14 |
51 |
43 |
5:00 |
5:00 |
6:00 |
11/16 |
6.00 |
5.80 |
2.14 |
Unit conversion: 1 inch = 25.4 mm |
a. Raw inspection data for end 1 scanning.

b. Pin elevation for end 1 scanning.
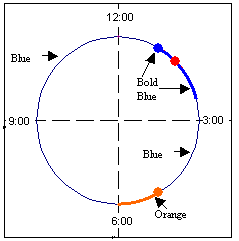
c. Pin cross section for end 1 scanning.
Figure
43. Pin 2 testing results.
| |
Note |
Scan angle, deg |
Indication level, dB |
Reference level, dB |
Reading location, hh:mm |
Beginning of signal location, hh:mm |
End of signal location, hh:mm |
Distance to index, inches |
Sound path distance, inches |
Axial distance, inches |
Radial distance, inches |
Red  |
1 |
0 |
57 |
47 |
10:30 |
9:30 |
11:00 |
1 |
5.00 |
5.00 |
1.00 |
Orange |
2 |
0 |
55 |
47 |
7:00 |
7:00 |
7:00 |
1 |
2.95 |
2.95 |
1.00 |
Blue |
3 |
14 |
39 |
43 |
6:30 |
6:30 |
7:00 |
1/2 |
3.05 |
2.96 |
1.24 |
Green |
4 |
14 |
49 |
43 |
10:00 |
9:00 |
11:00 |
5/8 |
5.10 |
4.95 |
1.86 |
Unit conversion: 1 inch = 25.4 mm |
d. Raw inspection data for end 2 scanning.
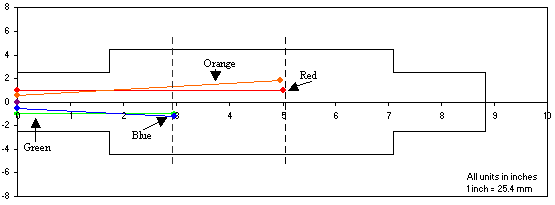
e. Pin elevation for end 2 scanning.
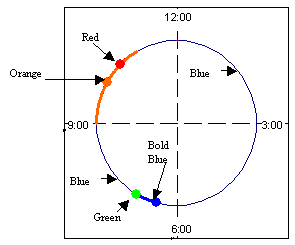
f. Pin cross section for end 2 scanning.
Figure 43. (Continued) Pin 2 testing results.
| |
Note |
Scan angle, deg |
Indication level, dB |
Reference level, dB |
Reading location, hh:mm |
Beginning of signal location, hh:mm |
End of signal location, hh:mm |
Distance to index, inches |
Sound path distance, inches |
Axial distance, inches |
Radial distance, inches |
Red  |
1 |
0 |
32 |
58 |
11:00 |
10:30 |
11:30 |
1 |
5.80 |
5.80 |
1.00 |
Green |
2 |
0 |
42 |
58 |
5:00 |
4:30 |
6:00 |
7/8 |
3.85 |
3.85 |
0.88 |
Orange |
3 |
14 |
38 |
43 |
10:30 |
10:00 |
11:30 |
5/8 |
5.85 |
5.68 |
2.04 |
Blue |
4 |
14 |
36 |
43 |
4:30 |
4:00 |
6:00 |
5/8 |
3.95 |
3.83 |
1.58 |
Unit conversion: 1 inch = 25.4 mm |
a. Raw inspection data for end 1 scanning.
b. Pin elevation for end 1 scanning.
c. Pin cross section for end 1 scanning.
Figure 44. Pin 3 testing results.
| |
Note |
Scan angle, deg |
Indication level, dB |
Reference level, dB |
Reading location, hh:mm |
Beginning of signal location, hh:mm |
End of signal location, hh:mm |
Distance to index, inches |
Sound path distance, inches |
Axial distance, inches |
Radial distance, inches |
Red  |
1 |
0 |
37 |
58 |
12:30 |
12:00 |
2:00 |
1 |
2.90 |
2.90 |
1.00 |
Green |
2 |
0 |
45 |
58 |
7:00 |
6:00 |
8:00 |
1 |
4.90 |
4.90 |
1.00 |
Blue |
3 |
14 |
34 |
43 |
1:00 |
12:15 |
2:00 |
1/2 |
3.05 |
2.96 |
1.24 |
Orange |
4 |
14 |
35 |
43 |
6:30 |
6:00 |
7:30 |
1/2 |
5.05 |
4.90 |
1.72 |
Unit conversion: 1 inch = 25.4 mm |
d. Raw inspection data for end 2 scanning.
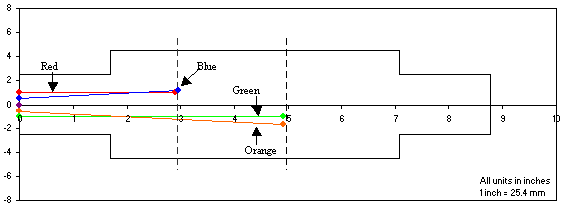
e. Pin elevation for end 2 scanning.
f. Pin cross section for end 2 scanning.
Figure 44. (Continued) Pin 3 testing results.
| |
Note |
Scan angle, deg |
Indication level, dB |
Reference level, dB |
Reading location, hh:mm |
Beginning of signal location, hh:mm |
End of signal location, hh:mm |
Distance to index, inches |
Sound path distance, inches |
Axial distance, inches |
Radial distance, inches |
Red  |
1 |
0 |
36 |
58 |
1:00 |
12:30 |
2:00 |
3/4 |
3.75 |
3.75 |
0.75 |
Green |
2 |
0 |
65 |
58 |
1:00 |
1:00 |
1:00 |
7/8 |
5.90 |
5.90 |
0.88 |
Blue |
3 |
14 |
40 |
43 |
12:30 |
12:00 |
12:30 |
5/8 |
3.95 |
3.83 |
1.58 |
Orange |
4 |
14 |
50 |
43 |
1:00 |
1:00 |
1:30 |
3/8 |
6.05 |
5.87 |
1.84 |
Unit conversion: 1 inch = 25.4 mm |
a. Raw inspection data for end 1 scanning.
b. Pin elevation for end 1 scanning.
c. Pin cross section for end 1 scanning.
Figure 45. Pin 4 testing results.
| |
Note |
Scan angle, deg |
Indication level, dB |
Reference level, dB |
Reading location, hh:mm |
Beginning of signal location, hh:mm |
End of signal location, hh:mm |
Distance to index, inches |
Sound path distance, inches |
Axial distance, inches |
Radial distance, inches |
Red  |
1 |
|
30 |
58 |
11:00 |
9:00 |
12:00 |
3/4 |
4.95 |
4.95 |
0.75 |
Green |
2 |
14 |
42 |
43 |
11:00 |
10:00 |
12:00 |
5/8 |
5.05 |
4.9 |
1.85 |
Unit conversion: 1
inch = 25.4 mm |
d. Raw inspection data for end 2 scanning.
e. Pin elevation for end 2 scanning.
f. Pin cross section for end 2 scanning.
Figure
45. (Continued) Pin 4 testing results.
| |
Note |
Scan angle, deg |
Indication level, dB |
Reference level, dB |
Reading location, hh:mm |
Beginning of signal location, hh:mm |
End of signal location, hh:mm |
Distance to index, inches |
Sound path distance, inches |
Axial distance, inches |
Radial distance, inches |
Red  |
1 |
0 |
24 |
56 |
6:30 |
5:45 |
7:00 |
3/4 |
3.90 |
3.90 |
0.75 |
Green |
2 |
14 |
39 |
43 |
6:00 |
5:30 |
6:30 |
9/16 |
4.00 |
3.85 |
1.53 |
Blue |
3 |
14 |
36 |
43 |
7:00 |
7:00 |
7:00 |
1/2 |
3.90 |
3.78 |
1.44 |
Unit conversion: 1 inch = 25.4 mm |
a. Raw inspection data for end 1 scanning.
b. Pin elevation for end 1 scanning.
c. Pin cross section for end 1 scanning.
Figure 46. Pin 5 testing results.
| |
Note |
Scan angle, deg |
Indication level, dB |
Reference level, dB |
Reading location, hh:mm |
Beginning of signal location, hh:mm |
End of signal location, hh:mm |
Distance to index, inches |
Sound path distance, inches |
Axial distance, inches |
Radial distance, inches |
Red  |
1 |
0 |
29 |
58 |
5:45 |
5:30 |
7:00 |
5/8 |
4.95 |
4.95 |
0.63 |
Green |
2 |
14 |
40 |
43 |
6:00 |
5:30 |
7:00 |
5/8 |
5 |
4.85 |
1.83 |
Unit conversion: 1 inch = 25.4 mm |
d. Raw inspection data for end 2 scanning.
e. Pin elevation for end 2 scanning.
f. Pin cross section for end 2 scanning.
Figure 46. (Continued) Pin 5 testing results.
Previous | Table of Contents | Next
|
