U.S. Department of Transportation
Federal Highway Administration
1200 New Jersey Avenue, SE
Washington, DC 20590
202-366-4000
Federal Highway Administration Research and Technology
Coordinating, Developing, and Delivering Highway Transportation Innovations
 |
| This report is an archived publication and may contain dated technical, contact, and link information |
|
Federal Highway Administration > Publications > Research > Structures > A Laboratory and Field Study of Composite Piles for Bridge Substructures |
Publication Number: FHWA-HRT-04-043 |
Previous | Table of Contents | Next
In 2000, the Virginia Department of Transportation (VDOT) employed concrete-filled FRP composite piles for an entire bent of the new Route 40 Bridge over the Nottoway River in Sussex County, VA. As part of this project, a test pile program was performed at the bridge site to investigate and compare the driveability, axial load capacity, and lateral load response of a composite pile and a standard prestressed concrete pile. The same type of composite pile was used in the test pile program as was used in the bridge bent. This project is believed to be the first to use this type of composite pile in a long-term, load-bearing application such as a bridge. Previously, these piles have been primarily used in marine fendering projects, in light load applications, or for experimental research. A summary of the overall project and the main findings of the field load test program are presented in this chapter. Results from this project have also been published by Pando, et al. (2000), and Fam, et al. (2003).
VDOT decided to replace the existing Route 40 Bridge (Structure No. 1006) over the Nottoway River in Sussex County, VA, at the location shown in figure 77. The old bridge, which consisted of a steel truss supported by concrete piers as shown in figure 78, suffered from excessive deterioration in both superstructure and substructure. Full-height vertical cracks existed in the concrete columns of the piers, as shown in figure 79(a). Spalling and cracking of the concrete bearing seats were observed, as shown in figure 79(b). Map cracking, up to 1.6 mm (1/16 inch) width, was also observed in the abutment bearing seats, as shown in figure 79(c). In addition to the deterioration of the substructure, excessive corrosion with large section losses was observed in the roller bearing devices of the truss supports. Additionally, the floor beams suffered from section losses up to 3.2 mm (1/8 inch) in both the web and bottom flanges. The bridge was functionally obsolete with a roadway clearance of only 7.3 m (24 ft) curb to curb, and was rated as scour critical.
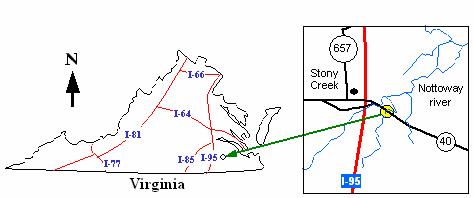
Figure 77. Map. Location map of the Route 40 Bridge project
in Sussex County, VA (Fam, et al., 2003).
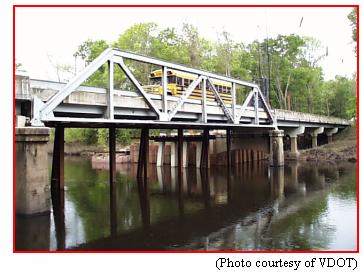
Figure 78. Photo. Former Route 40 Bridge.
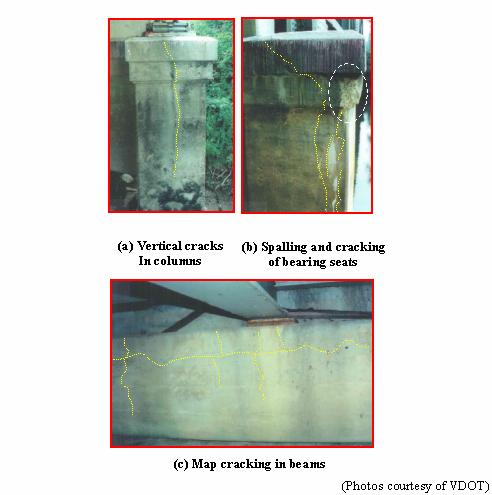
Figure 79. Photos. Signs of deterioration of the former
Route 40 Bridge (Fam, et al., 2003).
The new bridge is 85.3 m (280 ft) long and 15.2 m (50 ft) wide, and consists of a five- span slab-type superstructure supported by four piers and two end abutments, as shown in figure 80. Each pier consists of a reinforced concrete beam-type elevated pile cap supported by ten piles. Based on the design requirements, VDOT specified a 508 mm (20-inch) prestressed solid square pile, as shown in figure 83. The design axial load of each pile was 667 kN (150 kips). As a part of the composite piles study sponsored by the Federal Highway Administration (FHWA), VDOT took the initiative to use an alternative composite pile system consisting of concrete-filled FRP tubes for the entire group of piles supporting Pier No. 2 (see figure 80). The objectives of the VDOT initiative were to examine the feasibility of using composite piles for bridge substructures, particularly to examine the driveability of the piles using conventional pile drivers, to assess performance under axial and lateral loading conditions using full-scale field tests, and to compare composite piles to conventional prestressed concrete piles. The following section provides a brief description of both the prestressed concrete test pile and the precast composite test pile.
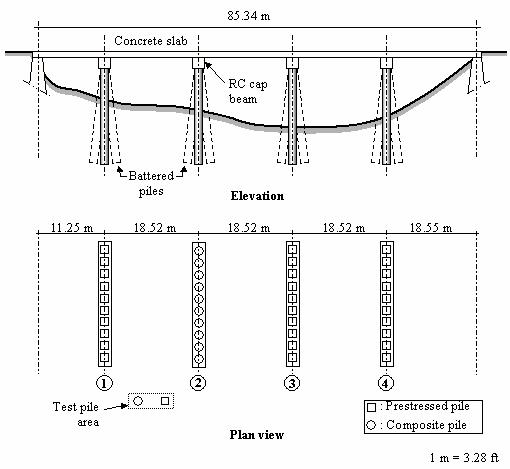
Figure 80. Illustration. Schematic of the new Route 40
Bridge.
The composite test pile used for this project consists of a concrete-filled tubular FRP pile, in which the FRP tube serves as both a permanent lightweight noncorrosive formwork for the concrete and a reinforcement element. Figure 81(a) is a photograph of the composite piles installed at bridge bent No. 2. The FRP tube is composed of several layers of fibers embedded in a polymeric resin. The layers of fibers are oriented in several different directions with respect to the longitudinal axis of the tube in order to provide strength and stiffness in both the axial and circumferential directions. The circumferential stiffness and strength of the FRP tube provides confinement to the concrete core under axial stress. This confinement increases the strength and ductility of the pile. The axial strength of the FRP tube contributes to the flexural strength of the pile.
A 13.1 m (43 ft) long GFRP tube, type CP40, was fabricated using
a filament-winding technique wherein E-glass continuous fiber
rovings were impregnated with polyester resin and wound over a
rotating steel mandrel, following a predetermined winding pattern.
The average measured fiber volume fraction of the FRP tube was 51.2
percent. The FRP tube has an average outer diameter of 625 mm (24.6
inches) and a total wall thickness of 7.35 mm (0.289 inches). The
tube has a 1.68-mm- (0.066-inch-) thick liner at the inner surface,
which results in a net structural wall thickness of 5.67 mm (0.223
inches). The wall structure of the tube consists of five layers,
each 1.13 mm (0.044 inches) thick. The two inner and outer layers
contain fibers oriented at ![]() = ±35 degrees, where
= ±35 degrees, where ![]() is the inclination of the fibers with respect
to the longitudinal axis of the tube. The middle layer, which is
sandwiched between the inner and outer layers, contains fibers
oriented at
is the inclination of the fibers with respect
to the longitudinal axis of the tube. The middle layer, which is
sandwiched between the inner and outer layers, contains fibers
oriented at ![]() = 85 degrees, which means
that the middle fibers are oriented nearly circumferentially. The
laminate structure of the FRP tube is shown in figure 81(b). The
mechanical properties of the FRP tube are provided in table 27.
= 85 degrees, which means
that the middle fibers are oriented nearly circumferentially. The
laminate structure of the FRP tube is shown in figure 81(b). The
mechanical properties of the FRP tube are provided in table 27.
The FRP tube was filled with a concrete mix that includes an expansive additive to reduce the effect of shrinkage and thereby enhance the bond between the concrete and the FRP tube. The specified compressive strength of the concrete fill at 28 days is 41.4 MPa (6 ksi). Compressive strength tests carried out on concrete core samples from the composite test pile are shown in figure 82. The measured compressive strength is about 60 MPa. The measured modulus of elasticity is about 15 GPa, which is smaller than the typical values expected for normal concrete of the same compressive strength. The reason for the small modulus of elasticity value for the concrete in the composite pile was not investigated, but it could be related to the expansive additive.
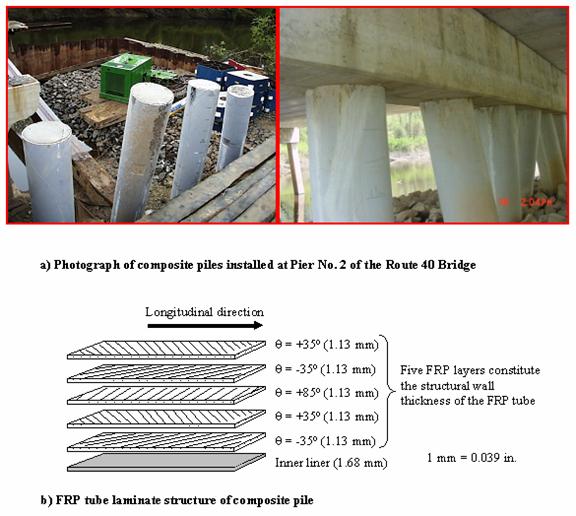
Figure 81. Photo and Illustration. Concrete-filled tubular
piles.
|
Mechanical Property* |
Longitudinal Axial Direction |
Hoop Direction |
|---|---|---|
|
Tensile strength |
113 MPa |
138 MPa |
|
Tensile modulus** |
15 GPa |
22.1 GPa |
|
Strain to failure |
1-1.4% |
1.25% |
Notes: * From coupon tests (see chapter 4 for more details on
mechanical properties of FRP shell)
** Elastic modulus for the strain range between 0 to 4,000
microstrains.
1 MPa = 145 lbf/inch2; 1 GPa = 145,000
lbf/inch2
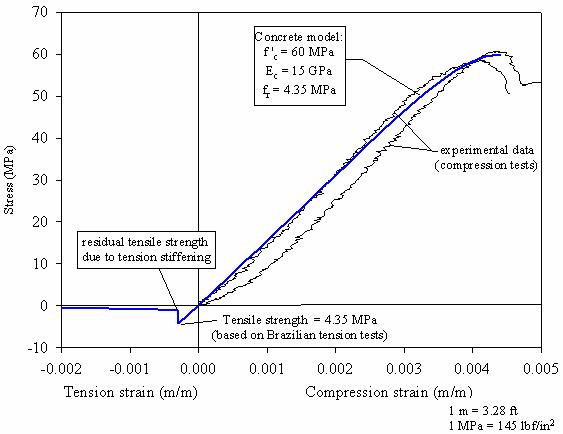
Figure 82. Graph. Stress-strain response of concrete used
in the composite pile.
The performance of the composite test pile was compared with that of a prestressed concrete test pile, which is the pile type commonly used in VDOT bridge projects. The prestressed concrete test pile is a 508-mm (20-inch) square pile with a length of about
13.1 m (43 ft). Figure 83 shows the pile details. The pile is prestressed using a total of fourteen, 12.7-mm (0.5-inch) diameter, 7-wire strands of 1861 MPa (270 ksi) ultimate strength, pretensioned to produce a prestress level of 5.6 MPa (0.809 ksi) in accordance with VDOT standards. The specified concrete compressive strength at 28 days is 40 MPa (5.8 ksi). The ties consist of No. 16M (No. 5) gage spiral wire, as shown in figure 83. Concrete test results indicated a 28-day compressive strength of about 43 MPa (6.2 ksi) for this pile.
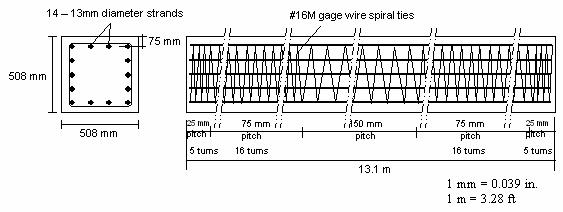
Figure 83. Illustration. Reinforcement details of
prestressed concrete pile.
In general, the soil conditions in the vicinity of the test piles consist of about 7.9 m (25.9 ft) of loose to medium-dense silty sand with some gravel, underlain by very stiff to hard silty clay, as shown in figure 84. The clay was encountered to the maximum depth investigated, which was 15.7 m (51.5 ft). The ground water level was observed at a depth of about 8.1 m (26.6 ft).
The sand in the upper 4 m (13.1 ft) was brown, medium fine, with some fine gravel and traces of silt. Standard penetration resistance (SPT) blow counts (N-values) in the upper sand were five blows per 0.3 m (0.98 ft), which is indicative of a loose relative density. The sand below 4 m (13.1 ft) and extending to a depth of 7.9 m (25.9 ft) was brown to gray, fine-grained, silty with some gravel. SPT blow counts in the lower sand ranged from 17 to 25 blows per 0.3 m (0.98 ft), which corresponds to a medium density. Underlying the sand was green, very stiff to hard, silty clay, with SPT blow counts ranging from 41 to 88. The average SPT N-value below 10 m (32.8 ft) depth was 75 blows per 0.3 m (0.98 ft). The near-surface stratum of loose sand comprises the soil of most significance to the lateral response of the piles.
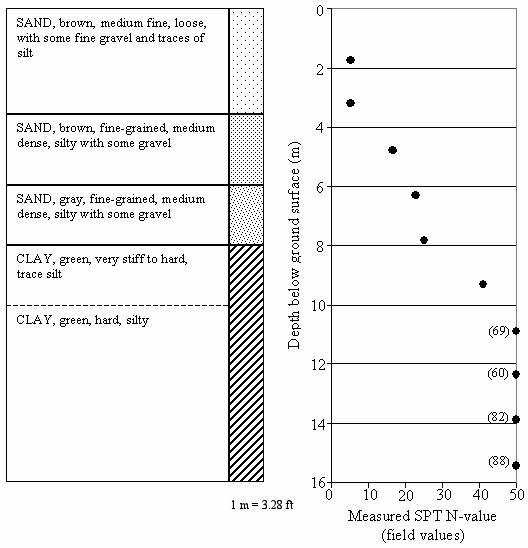
Figure 84. Illustration. Simplified soil stratigraphy near
test pile area.
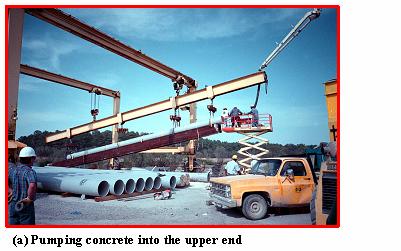
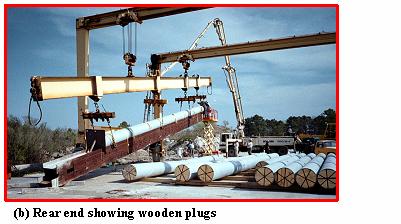
The prestressed concrete piles were fabricated at the precasting plant in accordance with VDOT standards, as shown in figure 85. After fabricating and curing, the piles were shipped to the bridge site. The FRP tubes for the composite piles were shipped to the precast plant and filled with concrete while held in an inclined position and supported by a steel beam along the full length of the tubes, as shown in figure 86(a and b). Wooden end plugs were used to seal both ends of the tube. The plugs were secured in position using metal straps connected to both the plug and the composite tube in radial directions, as shown in figure 86(b). Concrete was pumped into the upper end through a hole in the wooden plug. The concrete-filled composite tubes were handled using eight-point lifting devices along the length of the pile, as shown in figure 86(c).
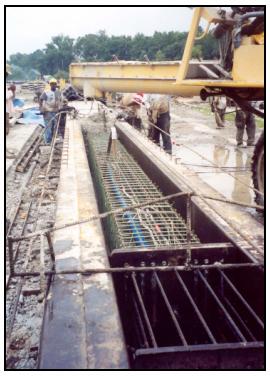
Figure 85. Photo. Fabrication of prestressed concrete
pile.
 |
 |
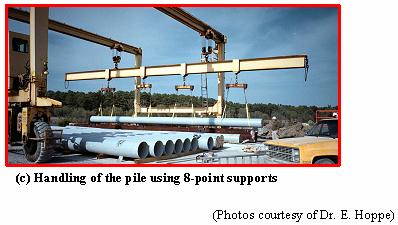 |
Figure 86. Photos. Fabrication of concrete-filled FRP Piles.
Both the composite and prestressed test piles were driven using a hydraulic impact hammer, type ICE model 160S, which was also used to drive the production piles for the Route 40 Bridge. The ram weight is 71.2 kN (16,000 lbs), and the manufacturer's rated energy at the maximum stroke of 1.2 m (3.9 ft) is 85.4 kN-m (63,025 lbf-ft). A 190-mm- (7.5-inch-) thick plywood pile cushion was used during pile driving. Figure 87(a and b) shows the composite pile during and after driving, as well as the prestressed pile during driving.
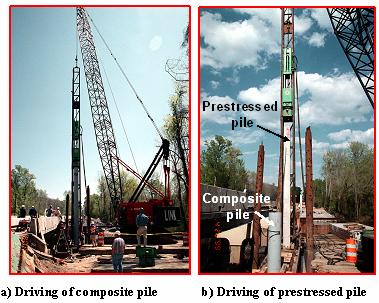
Figure 87. Photos. Driving of test piles.
First, the composite pile was driven to a depth of about 8.5 m (27.9 ft), which was slightly above the originally planned embedment depth. The composite pile driving was stopped sooner than planned based on the driving monitoring information, which suggested that the 4,000 kN Statnamic device might not have been sufficient to test the pile if the pile were driven deeper. Next, the prestressed pile was driven to a 9.4 m (30.8 ft) depth. This depth produced the same pile tip elevation for both test piles. Figure 88 shows the driving records for both piles expressed in terms of number of blows per 0.25 m (0.82 ft) versus the depth of the pile tip below the driving template. At the end of driving, the blow count was 6 blows per 25 mm (1 inch) of pile penetration for the composite pile and 4 blows per 25 mm (1 inch) for the prestressed concrete pile.
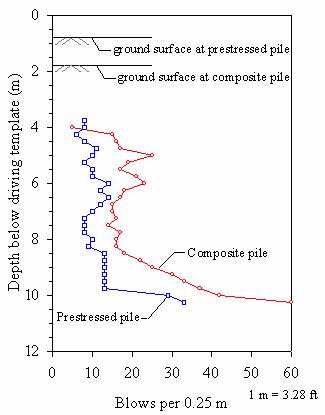
Figure 88. Graph. Driving records for test
piles.
During pile driving, two sets of independent dynamic measurements were taken: Pile Driving Analyzer (PDA) measurements recorded by Federal Highway Administration (FHWA) personnel, and Foundation Pile Diagnostic System (FPDS) measurements. A summary of the most relevant dynamic testing results is presented herein, and a more detailed discussion can be found in Muchard, et al. (1999). Dynamic testing was accomplished by attaching strain transducers and accelerometers at about 2 diameters from the top of the piles in pairs spaced 180 degrees apart. To attach the transducers to the composite pile, small windows were cut out of the FRP shell, which allowed the instrumentation to be directly attached to the concrete infill. PDA records for both types of piles at the end of initial driving are shown in figure 89. Both pile types show similar dynamic behavior. The PDA records for both piles show two force peaks: the first at about 0 and the second at about L/c (where L is the pile length, and c the wave speed). This type of response is produced by the natural frequency of the hammer and driving train used. A velocity peak can also be seen at about 2L/c. This peak is characteristic of reflected tensile waves from the toe. The recorded driving tensile stresses were relatively small. This is partly explained by the relatively heavy hammer, which generates larger compressive waves than the reflected tensile waves coming up from the toe. Table 28 provides some of the measurements obtained during pile driving. It can be seen that the wave speeds, maximum compressive stresses, and maximum tensile stresses are each similar in the different pile types. The measured stress levels are lower than the allowable stresses recommended for prestressed piles (Hannigan, et al., 1996). No standards are currently available for allowable driving stresses of composite piles. Estimates of pile capacity from the dynamic strain and acceleration measurements were obtained using the Case method (Muchard, et al., 1999). Using a Case damping value of 0.4, Muchard, et al., (1999) estimated end-of-driving pile capacities of 3390 kN (762 kips) and 3160 kN (710 kips) for the composite and prestressed test piles, respectively.
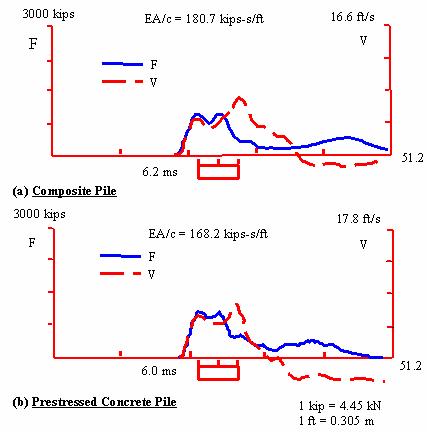
Figure 89. Graphs. End-of-driving PDA
recordings.
|
Measurement |
Pile Type |
|
|---|---|---|
|
Prestressed |
Composite |
|
|
Wave speed |
3705 m/s |
3612 m/s |
|
Maximum compression stress measured during driving |
17.6 MPa |
19.2 MPa |
|
Maximum tensile stress measured during driving |
4.8 MPa |
2.9 MPa |
|
Allowable stresses |
Tension < 7 MPa |
No standards available |
1 m = 3.28 ft; 1 MPa = 145 lbf/inch2
Using the TNOWAVE wave equation software, Muchard, et al. (1999), performed signal-matching analyses on strain and acceleration data for selected blows near the end of each pile driving. The signal matching was performed using a two-layer soil model consisting of a 7.5 m (24.6 ft) sand layer overlaying stiff clay. The predicted capacities from signal-matching analyses are summarized in table 29.
|
Pile Type |
Signal-Matching Analyses Predicted Capacity |
||
|---|---|---|---|
|
Total |
Skin |
End Bearing |
|
|
Prestressed |
3070 kN |
1780 kN |
1290 kN |
|
Composite |
3140 kN |
1750 kN |
1390 kN |
1 kN = 225 lbf
The signal-matching analyses predictions suggest that about 57 percent of both pile capacities is due to skin friction contribution. When comparing the pile capacities described above, it is important to keep in mind the differences in end bearing and skin friction areas of the piles. Due to differences in cross section and embedment depths, the composite pile has a skin area 12.6 percent smaller, and a tip area 18.9 percent larger, than the prestressed pile.
Prior to installation of the production piles for the new Route 40 Bridge, the two test piles were subjected to axial and lateral loading using a Statnamic testing device. The Statnamic testing system is a patented system. This system applies the load to the pile by combustion of fuel within a closed chamber, in which gas pressure builds and "launches" a heavy reaction mass upward (or laterally) at a very high acceleration close to 20 g's. When the reaction mass is launched, an equal and opposite reaction force acts on the test pile. The Statnamic setup is such that the load is applied in a somewhat gradual manner, as opposed to an impact load like the one produced by a driving hammer. The applied force is a time-dependent load with a duration typically between 0.2 to 0.3 seconds. From the recorded Statnamic force, one can estimate the equivalent static load by subtracting the inertia and damping forces. This equivalent static force can be derived by using the Unloading Point Method (UPM) proposed by Middendrop, et al. (1992). The Statnamic test methodology and data reduction procedure have been described by Middendrop, et al. (1992), and Brown (1994).
The following sections provide a description of the instrumentation used for Statnamic testing, and a summary of the most relevant Statnamic test results carried out at the Route 40 Bridge. The main goal of this discussion is to provide some insight on the relative performance of the composite pile compared to a prestressed concrete pile. Detailed coverage and discussion of the Statnamic load test results carried out for this project are presented in Muchard, et al. (1999).
Both the composite and the prestressed concrete test piles were instrumented with strain gages in the axial direction at three levels along the length of the piles. At each level, two strain gages were placed near the two opposite faces of the pile, as shown in figure 90. The strain gages were mounted on 914-mm- (36-inch-) long No. 13M steel bars, embedded in the concrete core. After completion of axial load testing, each test pile was also instrumented with a string of eight lateral motion sensors to measure the lateral displacement profile of the pile during lateral Statnamic load testing. The sensors were lowered inside a slope inclinometer casing embedded in the test piles. The locations of the lateral motion sensors are shown in figure 90. One embedded accelerometer was installed near the pile toe to measure the pile toe movement during Statnamic axial load tests.
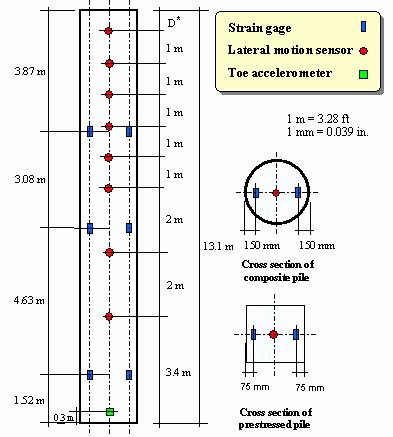
Figure 90. Illustration. Test Pile
Instrumentation.
Axial Statnamic load tests were carried out on both test piles seven days after pile driving. The axial load setup using the Statnamic testing system is shown in figure 91. During the Statnamic test, several measurements are taken, including the applied load, the pile head displacement, the toe accelerometer readings, and strains. Pile head displacement is measured using a laser beam device shown in figure 91. A detailed description of the Statnamic technique can be found in Brown (1994). Each test pile was subjected to three loading cycles with an increasing magnitude of applied load.
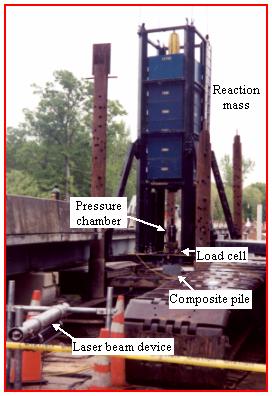
Figure 91. Photo. Axial load test using the Statnamic
device.
The equivalent static load versus pile head axial displacement for the prestressed concrete and composite piles for the three cycles are shown in figure 92. In both piles, the behavior during the last cycle showed that the geotechnical capacity of the piles was fully mobilized, as evident from the rapid increase of the pile displacement near the end of the test. Davisson's failure criterion (Davisson 1972) was applied considering the failure envelope encompassed by all three load cycles. Based on this criterion, the composite pile has an ultimate load capacity of 4,359 kN (980 kips) at a head displacement of about 18 mm (0.70 inch). The Davisson criterion was not satisfied for the prestressed concrete pile. However, the maximum load applied was 4,190 kN (942 kips) at a displacement of about 13 mm (0.51 inch). Both piles exhibited similar axial capacities, even though their shaft areas and end areas are slightly different.
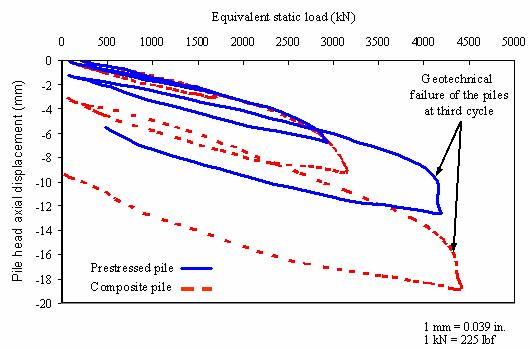
Figure 92. Graph. Pile head displacement versus equivalent
axial static load.
SHAPE Figure 93 shows the equivalent axial static load versus axial strain behavior of both the composite and prestressed piles based on the peak load and corresponding strain during each of the three load cycles. The axial strain is based on the average strain of the two uppermost strain gages (closest to the loading end), since they measured the maximum axial strain induced in the pile. Figure 93 shows that the behavior of the two piles was relatively similar, with the composite pile being slightly stiffer than the prestressed pile. The figure also shows that the design load of the piles, 667 kN (150 kips), is significantly lower than the ultimate load.
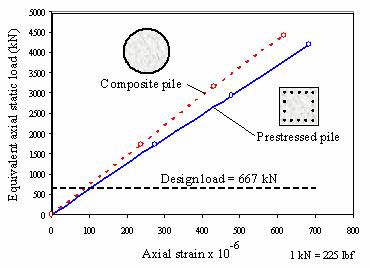
Figure 93. Graph. Axial load-axial strain behavior of test
piles.
The variation of the axial strains along the length of both the prestressed and composite piles is shown in figure 94. It can be seen that the measured strains along the depth are similar in both piles. The figure also shows that the strain level is reduced with increasing depth; this is attributed to the gradual transfer of axial load from the pile to the soil through skin friction along the pile shaft.
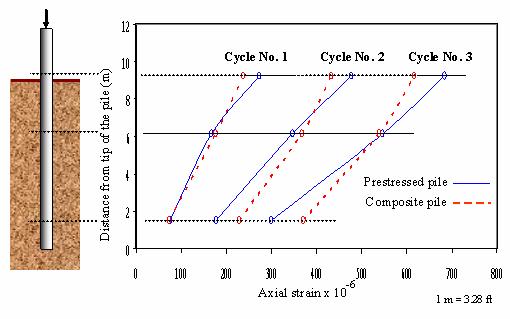
Figure 94. Illustration and Graph. Variation of axial
strain along pile length for three Statnamic loads.
Following the axial load tests, lateral load tests were conducted on both the composite and prestressed piles using the Statnamic Testing System shown in figure 95. The loading system is similar to that used for the axial load test; however, the setup was placed horizontally in order to produce a lateral load. The thrust against the pile is transferred through a calibrated load cell and hemispherical bearing. During lateral Statnamic testing, several measurements are taken, including the applied load and the lateral displacement of the pile at different depths. The two test piles were subjected to four progressively increasing cycles of load, with measured peak forces ranging up to about 290 kN (65,250 lbf) for the composite pile and about 350 kN (78,750 lbf) for the prestressed concrete pile. The Statnamic device operated on a sled resting upon falsework, which supported the device so that the loading was applied at the same elevation for both piles. Based on the falsework elevation, the point of lateral load application was approximately 3 m (9.84 ft) and 2 m (6.56 ft) above the ground surface for the composite and prestressed pile, respectively. As noted earlier, the ground surface elevation at the prestressed concrete pile is about 1 m (3.28 ft) higher than at the composite pile.
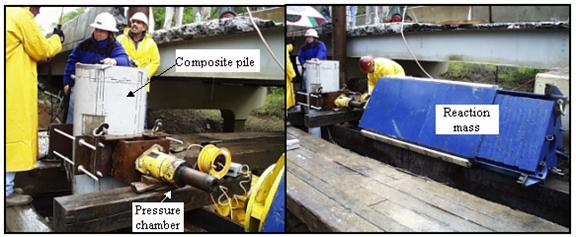
Figure 95. Photos. Lateral Statnamic setup at the Route 40
project.
The responses of the test piles were measured using multiple displacement transducers and subsurface accelerometers. Redundant measurements of displacement at the point of loading were made using both types of instruments. For subsurface displacements, eight down-hole lateral motion accelerometers were used to track the lateral movement profiles of the piles (see figure 90). The accelerometers were placed inside inclinometer casings at depths ranging from near the top of the pile to 8.8 m (28.9 ft) below the loading point. The time-dependent displacement at the location of each accelerometer was derived by double integration of the recorded acceleration versus time record. All of the data were monitored using a data acquisition system with a sampling rate of 5,000 samples per second for each channel. Data were recorded with a pretrigger of about 0.3 seconds prior to firing the Statnamic device and a duration after trigger of 1 to 2 seconds.
The plots in figure 96(a and b) are the displacement versus time records at the loading point for each of the four loads applied to the prestressed concrete pile and the composite pile, respectively. It can be seen that the period of oscillation increased with increasing displacement amplitude, indicating nonlinearity in the pile response. Compared to the prestressed concrete pile, the larger displacement amplitude (at a smaller maximum load) and lower frequency (longer period) of the composite pile indicates a less stiff lateral response.
The peak lateral displacements obtained from the string of subsurface lateral motion accelerometers provide the displaced shapes shown in figure 97 for each of the four cycles of Statnamic load applied to each pile. Both piles appeared to form a hinge at a depth of about 5 m (16.4 ft) below the point of loading. For the last two load cycles, the deflection profile along the depth of the piles was almost bilinear, with a sudden change in slope occurring at a depth of about 4.8 m (16 ft) measured from the loading point. This suggests that failure may have been initiated in both piles at the location of the sudden change in slope during the last two cycles.

Figure 96. Graphs. Displacement time histories at the
loading point for both piles (Pando, et al., 2004).
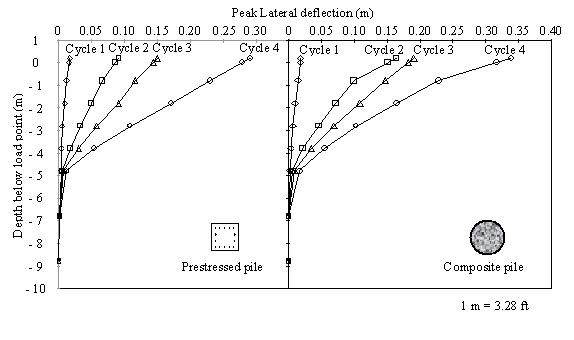
Figure 97. Graphs. Peak lateral displacement profiles for
both test piles at different cycles of Statnamic load.
A simple, single-degree-of-freedom system model, as described by Brown (unpublished paper), can be used to derive the equivalent static pile response from the Statnamic lateral test measurements. Interpretation of the Route 40 lateral Statnamic data was originally presented by Muchard, et al. (1999). More recently, Pando, et al. (2004), reanalyzed the data incorporating the composite pile nonlinearity. A summary of the methodology for lateral Statnamic data reduction is presented below.
The single-degree-of-freedom model includes inertia of the pile rotating about a hinge point below the groundline, a viscous damping component, and a nonlinear static spring resistance.
![]() (9)
(9)
where
Fstatnamic = measured force on the Statnamic load cell
Finertia = inertial resistance from effective mass of the foundation
Fdamping = effective viscous damping resistance
Fstatic = effective static soil resistance
The inertial resistance is approximated as that of a cylinder rotating about its base, with a diameter equal to that of the pile and a height taken as approximately 5.5 meters (18.0 ft). The height is based on the observed depth of about 5 m (16.4 ft) to a hinge, as shown in figure 97, plus the 0.5 m (1.6 ft) of pile that extends above the loading point. For a round pile of radius (r), height (h), and mass (m), the mass moment of inertia about the base (Iy), is
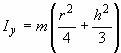 (10)
(10)
and for a square pile of width b, Iy is
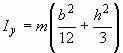 (11)
(11)
The rotational acceleration of such a cylinder in relation to a
displacement x at the loading point z (approximately 5 m (16.4 ft)
above the base of the rotating cylinder in this case) would be
![]() /z. Equating expressions for the inertial moment
about the base,
/z. Equating expressions for the inertial moment
about the base,
![]() (12)
(12)
Therefore,
![]() (13)
(13)
where me = Iy/z2.
The effective mass (me) may be thought of as a lumped mass, which if placed at the loading point z, would produce the same inertial reaction as the rotating cylinder. For the tests at the Route 40 site, me is calculated to be 1.36 kN-s2/m (93.3 lbf-s2/ft) for the prestressed concrete pile and 1.6 kN-s2/m (109.8 lbf-s2/ft) for the composite pile. In order to include the effect of some accelerating mass from the soil surrounding the piles, this effective mass is increased slightly and is estimated as approximately 1.5 and 1.75 kN-s2/m (102.9 and 120.1 lbf-s2/ft)for the prestressed concrete and composite piles, respectively.
The damping resistance is represented by a viscous damper in
which the force Fdamping is proportional to the
velocity, ![]() , by a constant, c (which is in units of
force-time/length). In order to relate this more meaningfully to a
system damping parameter, the damping constant, D, is expressed as
a percentage of the critical damping, cc, by
, by a constant, c (which is in units of
force-time/length). In order to relate this more meaningfully to a
system damping parameter, the damping constant, D, is expressed as
a percentage of the critical damping, cc, by
![]() (14)
(14)
where k is the static stiffness. Thus,
![]() (15)
(15)
The static resistance, Fstatic, is modeled as a function of displacement, x, using a spring with stiffness, k, that varies with each load level. The spring stiffness, k, represents the effect of the entire lateral soil reaction along the length of the pile. The soil response for lateral loading at large strains is known to be highly nonlinear. Pando, et al. (2004), took into account the nonlinear stiffness of the soil by using a linear stiffness for each load, but decreasing the value of k as the load magnitude increases.
The model uses equations 9, 13, and 15, and the parameters are me, D, and k. Because me was evaluated as described above for the test piles, the only unknown parameters are D and k. Values of D and k were obtained by fitting the model to the data shown in figure 96. The parameter values that produced the best fit with the data for the prestressed concrete pile model are: an effective mass, me, of 1.5 kN-s2/m (102.9 lbf-s2/ft) an effective damping ratio, D, ranging from 25 percent at small loads to 18 percent at the largest load; and a stiffness, k, that varies from 2,000 kN/m (137,200 lbf/ft) at small displacements (less than 20 mm (0.78 inch)) to 500 kN/m (34,300 lbf/ft) at the maximum displacement. The parameter values that produced the best fit for the composite pile model are an effective mass (me) of 1.75 kN-s2/m (120.1 lbf-s2/ft); an effective damping ratio (D) ranging from 25 percent at small loads to 18 percent at the largest load; and a stiffness (k) that varies from 2,000 kN/m (137,200 lbf/ft) at small displacements (less than 20 mm (0.78 inch)) to 360 kN/m (24,696 lbf/ft) at the maximum displacement. The lower stiffness of both piles at large amplitudes, and of the composite pile relative to the prestressed pile, are indicated by the lower frequencies of motion.
Using these parameter values, both the static soil resistance, Fstatic, and the total soil resistance, Fstatic + Fdamping, can be calculated. The peak values of Fstatic and Fstatic + Fdamping versus displacement at the loading point for each cycle of Statnamic loading are plotted in figure 98. It can be seen that the resistance contributed by damping is not large. The figure also demonstrates that there is a pronounced change in the slope of the load versus deflection curve for the composite pile at a lateral load of about 50 kN (11,250 lbf), indicating that first cracking of the composite pile may have occurred at this load. However, the composite pile exhibits a continuing capacity to sustain additional lateral load, albeit at substantially larger displacements. The prestressed concrete pile, on the other hand, exhibits a change in slope of its load versus deflection curve at a lateral load of about 125 kN (28,125 lbf), with comparatively little ability to sustain additional load beyond that point.
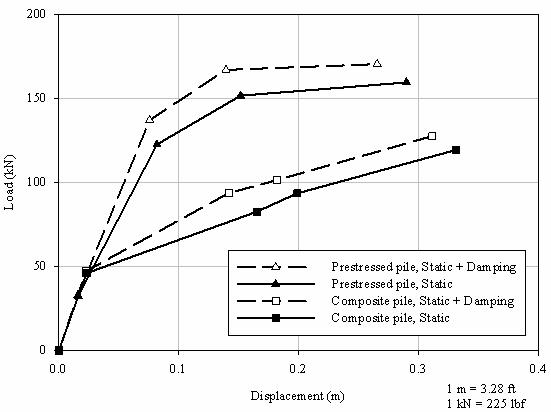
Figure 98. Graph. Calculated static and dynamic (static +
damping) resistances for both test piles.
Pando, et al. (2004), performed p-y lateral pile analyses to predict the lateral load-deflection behavior of the Route 40 test piles. The analyses were carried out using the program LPILE (Reese, et al., 2000) and incorporated nonlinearity of both the soil resistance, P, and the pile flexural stiffness, EI.
The nonlinear flexural stiffness was obtained from the moment-curvature relationship derived for both piles. For the concrete-filled FRP tubes, the moment-curvature relationship was estimated using a sectional analysis as described by Mirmiran, et al. (2000), and Fam and Rizkalla (2002). This methodology assumes that sections normal to the neutral axis remain plane after bending, and that the FRP shell is perfectly bonded to the concrete interior (i.e., a linear strain distribution through the entire cross section). The method consists of discretizing the pile cross section into a series of strip elements so that the normal stresses can be integrated over the cross-sectional area. The discretization results in strip elements that include both FRP and concrete components. The stress integration is done by assigning the appropriate constitutive model for each material. The FRP shell can be modeled accurately as linear elastic within the limiting tensile and compressive strains. The concrete can be modeled using relationships of the type shown in figure 82. This analysis methodology can be easily programmed and can be used to generate moment-curvature and interaction diagrams. This methodology was used by Fam (2000) to calculate the moment-curvature response of two concrete-filled FRP tubes of the same type as used at the Route 40 Bridge, except that the concrete strength was lower. The good agreement between the measured and calculated moment-curvature behavior for the two piles tested by Fam (2000) is shown in figure 99.
Using the procedure described above, the moment-curvature relationships were calculated for the composite piles used at the Route 40 Bridge project, and the results are shown in figure 99. It can be seen that the response is initially stiff until a moment of about 110 kN-m (80,850 lbf-ft) is reached, at which point the first cracking of the concrete occurs. Beyond this point, the composite pile can sustain additional moment, although the response is much less stiff than initially. Failure is predicted to occur at a bending moment of about 630 kN-m (463,050 lbf-ft), when the FRP shell ruptures in tension.
The moment-curvature behavior of the prestressed concrete piles was predicted analytically using equilibrium and strain compatibility. A modified Ramberg-Osgood function was used to model the stress-strain relationship of the prestressing steel strands. A generalized expression, given by Popovics, was used to model the nonlinear stress-strain relationship of concrete (Collins and Mitchell, 1997). The moment-curvature response based on the analysis of the prestressed concrete pile is shown in figure 99. The moment-curvature calculations were terminated when the compressive strain in the concrete reached 0.003.
It can be seen that the derived static load versus displacement curves from figure 98 have a similar nature to the moment-curvature response shown in figure 99, for both the prestressed concrete and composite piles. For the composite pile, the sudden change in stiffness at a lateral load of 48.9 kN (11 kips) reflects the cracking point. For the prestressed pile, the initial stiffness is high due to the prestressing effect, as well as the higher elastic modulus of steel.
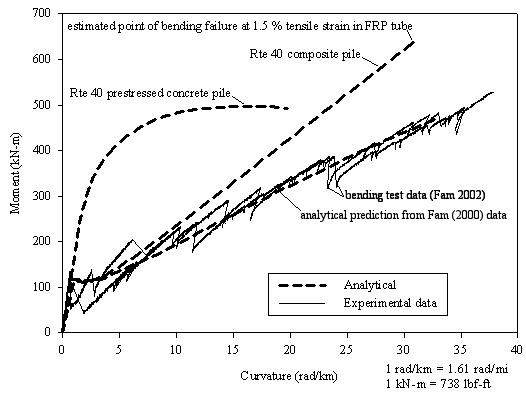
Figure 99. Graph. Moment-curvature responses for composite
and pretressed concrete piles.
Using the moment-curvature relationships in figure 99 and the soil property values proposed in the standard Reese, et al. (1974), p-y formulation, the predicted lateral response for the test piles is shown in comparison to the measured response in figure 100. It can be seen that the calculated and measured responses for the composite pile are in good agreement. For the prestressed concrete pile, the calculated and measured stiffnesses are in good agreement initially, but the calculated minimum load is less than the measured maximum load.
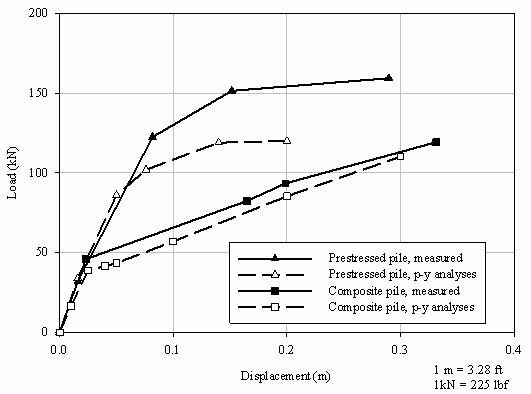
Figure 100. Graph. Computed and measured lateral
loan-displacement response for both test piles (Pando, et al.,
2004).
Pier No. 2 (see figure 80) of the Route 40 Bridge consists of a reinforced concrete cap beam supported by 10 composite piles. The composite production piles are identical to the composite test pile in terms of size, laminate structure of the tube, and the methods of construction and driving. The installed composite piles of Pier No.2 are shown in figure 81(a).
After driving both the prestressed concrete and composite piles, and prior to casting the cap beams, special preparation of the pile heads was necessary to facilitate connecting the piles to the cap beams. Eight, 25-mm- (1-inch-) diameter holes were drilled through the top flat surface of each pile, using a regular rock drill. The holes were 460 mm (18 inches) deep, parallel to the longitudinal axis of the piles. In the prestressed concrete piles, the holes were equally spaced in a 330-by-330-mm (13-by-13-inch) square pattern. In the composite pile, the holes were equally spaced in a 447-mm (17.6-inch) diameter circular pattern as shown in figure 101. These arrangements allow for a 76 mm (3-inch) concrete cover for each hole. Eight, 1,219-mm (48-inch) long, No. 22M (No. 7) steel rebars were inserted in the holes and epoxy resin was used to secure the bars inside the concrete. Figure 101(a and b) shows the details of the pile head and the steel dowels in both the prestressed concrete and composite piles. The formwork arrangement of the cap beams were placed such that the bottom surface of the cap beam is 152 mm (6 inches) below the upper surfaces of the piles to allow for embedment of the piles inside the cap beam. Figure 102(a) shows elevation views of Pier No. 2 through and in between the composite piles. Figure 102(b) shows the No. 22M (No. 7) steel bars, which are embedded 762 mm (30 inches) inside the cap beam. Figure 103 shows closeup views of Pier No. 2 and the connection between the composite pile and cap beam. A general view of the new completed bridge is shown in figure 104. The bridge was opened for traffic in the year 2000.
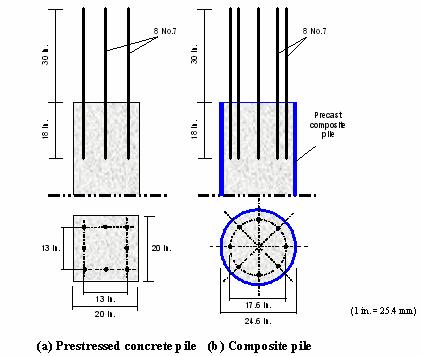
Figure 101. Illustration. Details of pile head showing the
bars used to connect the pile to cap beam.
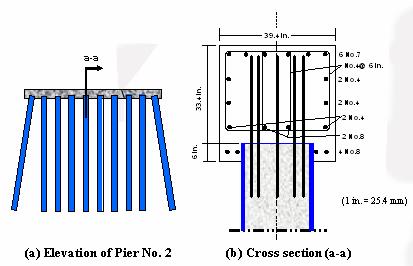
Figure 102. Ilustration. Connection of composite piles to
cap beam at Pier No. 2.
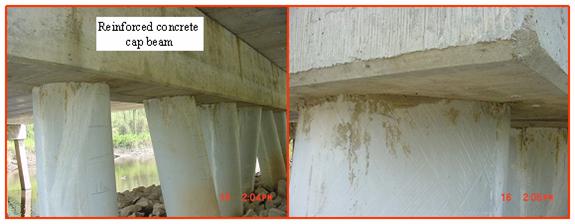
Figure 103. Photos. Pier No. 2 including the composite
piles and reinforced concrete cap beam.
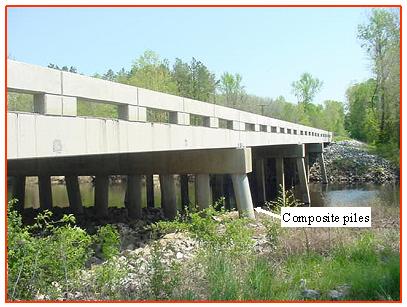
Figure 104. Photo. The new Route 40 Bridge over the
Nottoway River in Virginia.
In 2000, VDOT replaced the old Route 40 Bridge (Structure No. 1006) over the Nottoway River. New precast composite piles, consisting of concrete-filled GFRP tubes, were used to support one of the cast-in-place reinforced concrete cap beams that directly support the superstructure. Prior to construction, full-scale field tests were undertaken to investigate the feasibility of construction, handling, and driveability, as well as the structural performance of the new composite piles in comparison to conventional prestressed concrete piles. Based on the testing, analysis, and construction experience, the following conclusions can be drawn.

