U.S. Department of Transportation
Federal Highway Administration
1200 New Jersey Avenue, SE
Washington, DC 20590
202-366-4000
Federal Highway Administration Research and Technology
Coordinating, Developing, and Delivering Highway Transportation Innovations
 |
| This report is an archived publication and may contain dated technical, contact, and link information |
|
Federal Highway Administration > Publications > Research > Structures > A Laboratory and Field Study of Composite Piles for Bridge Substructures |
Publication Number: FHWA-HRT-04-043 |
Previous | Table of Contents | Next
This chapter summarizes the results and findings of field load tests carried out at the Route 351 Bridge project in Hampton, VA. The test pile program described here involved one prestressed concrete pile and two different types of composite piles that were subjected to axial and lateral load testing. One of the composite piles consisted of an FRP tube that was filled with concrete and reinforced with steel bars. The other composite pile was formed of polyethylene with steel reinforcing bars. In addition to the test pile program, two instrumented piles, consisting of a prestressed concrete pile and an FRP pile, have been installed in the bridge to study long-term performance and load-transfer behavior. The focus of this chapter is the test pile program, including descriptions of the test piles, subsurface conditions, pile driving, dynamic testing, static axial load testing, and static lateral load testing. The instrumented production piles and the long-term performance study are described in chapter 9. Results from the Route 351 tests also have been published by Pando et al. (2003).
In 2001, VDOT started a bridge replacement project at the Route 351 Bridge crossing of the Hampton River in Hampton, VA. A general location map and an aerial view of the original bridge are shown in figures 105 and 106, respectively. Wide-angle photographic views of the original bridge are shown in figure 107. The original bridge, built in the early 1940s, was 228.45 m (749.5 ft) long and had a roadway 10.35 m (34 ft) wide. The rated capacity of the bridge was for 133.5-kN (15-ton) trucks. The bridge was composed of 16 equal spans supported on steel beams. The superstructure was supported by 15 piers and 2 end abutments. The foundations of the piers and abutments consisted of groups of timber piles with reinforced concrete pile cap beams.
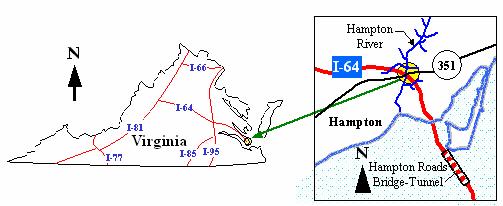
Figure 105. Map. Location map of the Route 351 Bridge in
Hampton, VA.
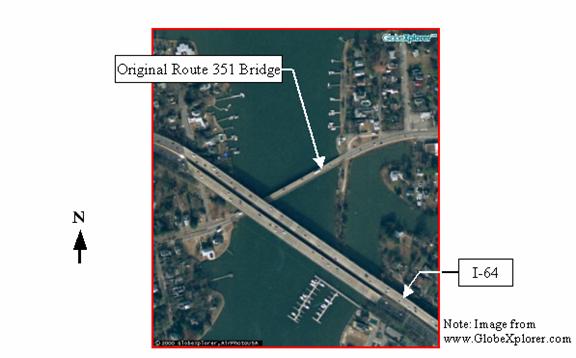
Figure 106. Photo. Aerial view of the Route 351 Bridge in
Hampton, VA.
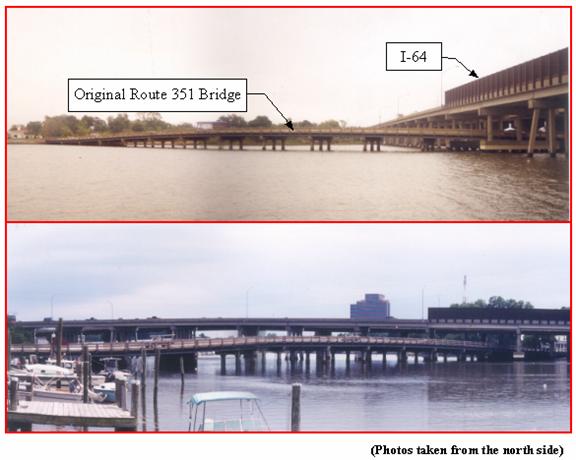
Figure 107. Photos. Wide-angle views of the original Route
351 Bridge.
The bridge suffered from excessive deterioration in the superstructure and substructure, which led to the decision of replacement. Some signs of deterioration in the original bridge can be seen in figure 108.
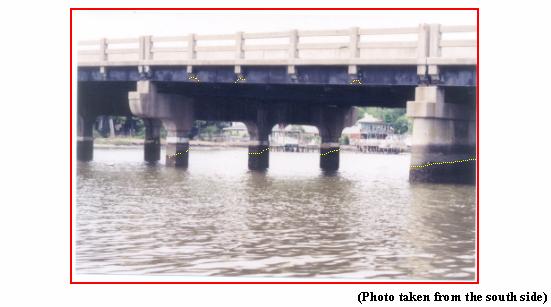
Figure 108. Photo. Signs of deterioration of the original
Route 351 Bridge.
The new bridge is 228.5 m (749.7 ft) long and 12.8 m (42 ft) wide, and consists of a 13-span superstructure supported by 12 piers and 2 end abutments, as shown in figure 109. The bridge deck is supported on American Association of State Highway and Transportation Officials (AASHTO) Type II prestressed concrete beams for most of the bridge; however, on the first four spans on the west side of the bridge, the deck is supported on steel plate girders. The steel plate girders are used in the portion of the bridge underneath the Highway I-64 overpass. As shown in figure 109, this area corresponds to Piers 1, 2, and 3. These spans are longer than on the east side of the bridge and the orientation of the piers had to be aligned with Highway I-64 due to workspace limitations imposed by the I-64 overpass. The bridge piers, except for Pier 2 located under highway I-64, consist of an elevated reinforced concrete beam-type pile cap supported by a group of seven prestressed concrete piles. The bridge rated capacity is for MS18 loading and alternate military loading. Based on the design requirements, VDOT specified use of 610-mm (24-inch) prestressed solid square piles for the pier foundations. The design axial load for the piles in the piers is 890 kN (200 kips). The new bridge was completed and opened to traffic in 2003.
As part of this study, an instrumented FRP composite pile was installed at the center of the group of piles supporting Pier 11 (see figure 109), and an instrumented prestressed concrete pile was installed in the center of Pier 10. Through monitoring of these piles, the long-term performance and durability of the two pile types can be assessed and compared. The long-term study is described in chapter 9.
The following sections provide a brief description of both the conventional prestressed piles and the composite piles.
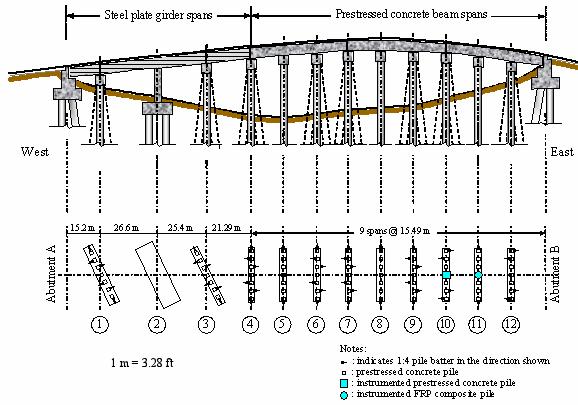
Figure 109. Illustration. Schematic of the new Route 351
Bridge.
The three test piles, whose cross sections are shown in figure 110, are described in the following subsections.
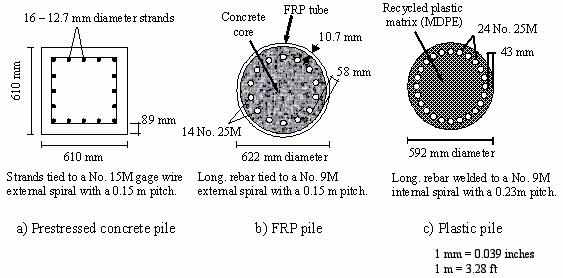
Figure 110. Illustration. Test pile cross section
details.
The prestressed concrete pile is a 610 mm (24 inch) square pile, 18 m (59.1 ft) long. The pile is prestressed with 16, 12.7 mm (0.5 inch)-diameter, 7-wire strands of 1.86 GPa (270 ksi) yield strength steel. The strands were strained to produce an effective prestress of 5.5 MPa (0.803 ksi) after losses. The spiral ties consist of No. 16M (No. 5) wire with a pitch of 150 mm (6 inches). The 28-day strength of the concrete was specified to be at least 35 MPa (5,080 psi), and the test results show that the strength of concrete was 55 MPa (7,980 psi) at the time of the load tests.
Figure 111(a) shows the stress-strain diagrams for the concrete and steel components of the prestressed concrete pile. The concrete stress-strain diagrams were obtained from laboratory tests, and the steel diagram shows the minimum yield strength specified for 1.86 GPa steel strands. Based on these stress-strain diagrams, the calculated axial stiffness, EA (where E is the Young's modulus and A is the cross-sectional area) of the pile is 8.2 x 10⁶ kN (1.84 x 10⁶ kips), as shown in figure 112. Figure 113 shows the moment-curvature and flexural stiffness diagrams calculated using the procedures described in Collins and Mitchell (1997).
The FRP composite test pile consists of an 18.3-m (60-ft) long FRP tube filled with concrete and reinforced with steel bars prior to driving. The FRP tube consists of a tube with an outside diameter of 622 mm (24.3 inch) and a wall thickness of 10.7 mm (0.417 inch). The polymer used is Dow vinyl ester Derakane resin, and the fiber reinforcing consists of four plies of stitch-bonded glass fiber fabric. Each ply includes four layers of fibers oriented at 0, +45, -45, and 90 degrees with respect to the longitudinal axis of the tube. The average ply thickness is 1.93 mm (0.0753 inch). The minimum fiber volume fraction is 50 percent.
Prior to driving, the tube was filled with nonshrink concrete with 19 mm (0.75 inch) aggregate and Sika Viscocrete additive to produce a fluid, self-compacting concrete. The 7-day strength of the concrete was 27.4 MPa (3,970 psi), and the strength at the time of driving was about 34 MPa (4,930 psi). The pile is reinforced with 14 No. 25M steel bars, grade 420 (No. 8 steel bars, grade 60). The spiral ties consist of No. 10M (No.3) gage wire with a pitch of 150 mm (6 inches).
Figure 111(b) shows the stress-strain diagrams for the FRP, concrete, and steel components of the FRP pile. The FRP and concrete stress-strain diagrams were obtained from laboratory tests, and the steel diagram shows the minimum yield strength specified for Grade 420 steel. Based on these stress-strain diagrams, the calculated axial stiffness, EA, of the pile is 7.36 x 10⁶ kN (1.65 x 10⁶ kips), as shown in figure 112. Figure 113 shows the moment-curvature and flexural stiffness diagrams calculated using the procedures described in Fam 2000.
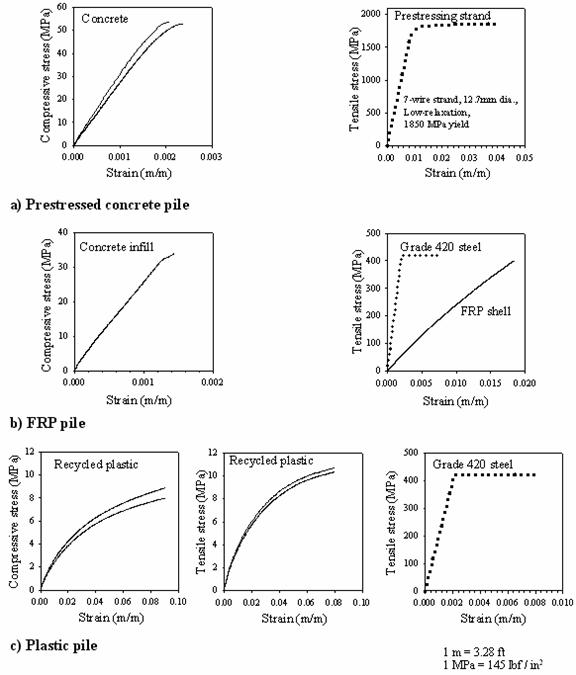
Figure 111. Graphs. Test pile material
properties.
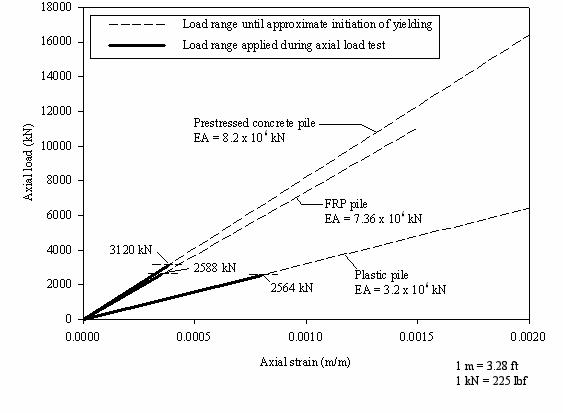
Figure 112. Graph. Axial load-axial strain behavior of test
piles.
The polyethylene composite pile consists of a plastic matrix and a steel reinforcing cage. The plastic matrix is a proprietary mixture of recycled postconsumer and/or postindustrial polyethylene thermoplastics, with added colorants, UV inhibitors, and antioxidants. The final density of the plastic ranges from 7.1 to 9.4 kN/m3 (45 to 60 pcf). The Young's modulus of the plastic is specified by the manufacturer to be at least 275 MPa (40 ksi). The pile is reinforced with 24 No. 25M steel bars, grade 420 (No. 8 steel bars, grade 60). The spiral ties, which consist of No. 10M (No. 3) gage wire with a pitch of 230 mm (9 inches), were welded to the longitudinal bars. The pile is fabricated by forcing molten plastic into a mold under a 3.4 MPa (500 psi) pressure at 260 °C (500 °F). The plastic pile is 592 mm (23 inches) in diameter and 18.3 m (60 ft) long. A steel pipe with an outside diameter of 141 mm (5.5 inches) and a wall thickness of 6.35 mm (0.25 inches) was cast in the plastic pile to provide a place for installing an inclinometer casing after the pile was cast. The steel pipe was used because of concerns that standard inclinometer casings might not survive the high temperature and high pressure of the plastic molding process.
Figure 111(c) shows the stress-strain diagrams for the polyethylene and steel components of the polyethylene pile. The polyethylene stress-strain diagrams were obtained from laboratory tests, and the steel diagram shows the minimum yield strength specified for Grade 420 steel. Based on these stress-strain diagrams, the calculated axial stiffness, EA, of the pile is 3.2 x 10⁶ kN (720 x 106 poundforce), as shown in figure 112. Figure 113 shows the moment-curvature and flexural stiffness diagrams calculated using the same equilibrium and strain compatibility concepts used for the other two piles (Collins and Mitchell 1997, Fam 2000).
Figure 113. Graphs. Flexural characteristics for the three
test piles.
The test pile program was conducted on a spit of land projecting into the Hampton River near the Route 351 crossing of the Hampton River in the Chesapeake Bay area of Virginia. The location of the test pile program is shown in figure 114.
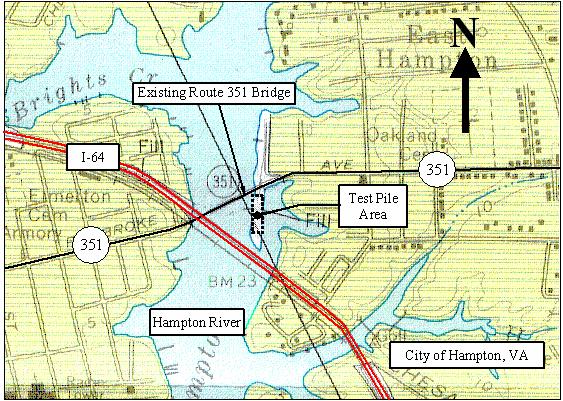
Figure 114. Map. Location of test pile site at the Route 351
Bridge.
The test site is located in the area of Chesapeake Bay that falls in the Coastal Plain geologic province of Virginia. The Chesapeake Bay is about 10,000 years old, and originated during the early Pleistocene epoch when the rising of the Atlantic Ocean sea level resulted in flooding and deposition of marine sediments. This flooding and deposition alternated with sea level lowering and erosion of older sedimentary deposits (Frye 1986, Meadors 1977). The numerous transgressions and regressions of the Atlantic Ocean created the present-day stratigraphy in this area (Martin, et al., 1987).
The east and west banks of the Hampton River consist of Tabb Formation deposits underlain by the Yorktown Formation (Johnson 1976, Frye 1986). The Tabb Formation deposits generally consist of near shore marine clayey and silty sands with occasional gravels (Johnson 1976). The Yorktown Formation has experienced numerous cycles of erosion, desiccation, and deposition. Soils from this formation are generally silty sands containing varying amounts of minor shell fragments (Martin, et al., 1987, Johnson 1976).
The soil stratigraphy at the test site is shown in figure 115. The uppermost layer at the test pile site is silty fine sand fill, approximately 1.0 m (3 ft) thick. The fill is underlain by loose to medium dense silty fine sand to a depth of 13.0 m (42.5 ft). The silty fine sand is underlain by stiff sandy clay to a depth of 15.5 m (51 ft). Beneath the clay, medium dense to dense silty and clayey sand was encountered to the bottom of the borings at a depth of 30.6 m (100 ft). The ground water level, which is controlled by the adjacent Hampton River, is at 0.9 to 1.5 m (3 to 5 ft) below the ground surface.
The test site was investigated with two hollow stem auger borings, four cone penetrometer probes, and one dilatometer probe. The locations of the borings and probes are shown in relation to the test pile layout in figure 116. The borings were advanced using hollow-stem auger techniques, and standard penetration tests (SPT) were performed in the borings using a safety hammer. The field SPT N-values are shown in figure 115, together with descriptions of the materials encountered in the borings. Figure 115 also shows the tip resistance and the sleeve friction from the four cone penetrometer test (CPT) probes. Additional subsurface investigation information for the pile load test area is included in appendix C.
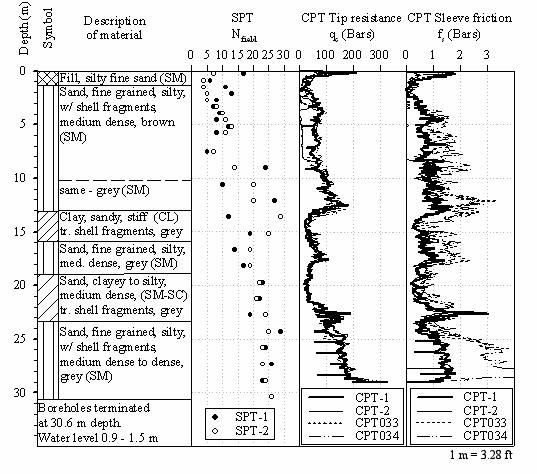
Figure 115. Charts. Simplified soil stratigraphy near test
pile area.
The water from the Hampton River is salty or brackish. Water samples taken from the bridge site were tested at Virginia Tech. Anion tests showed concentrations of chloride, bromide, and sulfate of 11,720, 28.3, and 1,498 mg/L (1.56, 0.00376, and 0.199 oz/gal), respectively. Cation tests showed concentrations of sodium, potassium, magnesium, and calcium of 6,151, 226, 558, and 259 mg/L (0.818, 0.030, 0.0742, and 0.0344 oz/gal), respectively.
The water level of this river is tidal. The mean low and high water level are -0.4 m (-1.3 ft) and +0.5 m (1.6 ft) with respect to mean sea level, respectively. The extreme high water level event for this area was recorded in 1932 at +2.180 m (7 ft) above mean sea level.
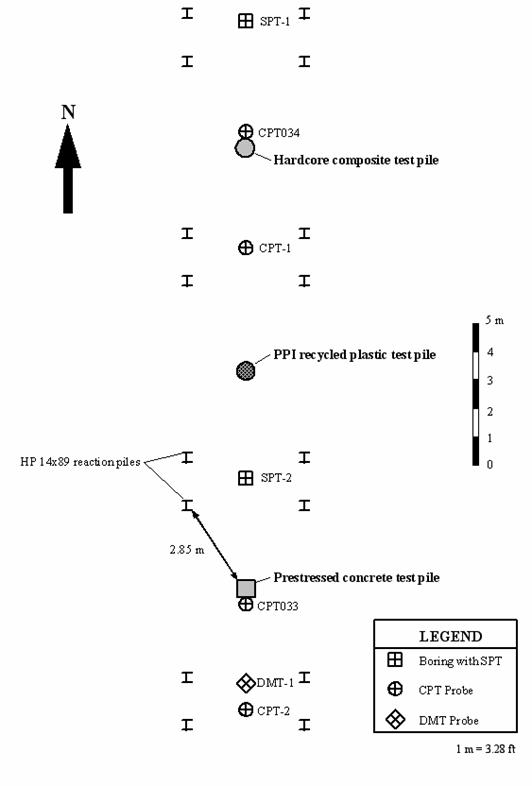
Figure 116. Illustration. Pile load test
layout.
All three test piles were instrumented with 16 sister bar strain gages located at 6 levels. A pair of gages was located at each level to provide gages on opposite sides of the pile. Two extra gages were installed at the uppermost and lowermost levels for redundancy. Each strain gage consisted of a No. 12M, grade 420 steel bar (No. 4 steel bar, grade 60), 0.9 m (2.9 ft) long, with four foil resistance strain gages that were precision mounted on each bar. The foil gages were mounted and wired to configure a full Wheatstone bridge that would cancel out any bending strains induced in the steel bar. For the polyethylene plastic pile, the foil gages and lead wires were made of materials capable of withstanding the high temperatures involved in manufacturing this pile. The sister bar strain gage survival rates, after pile manufacturing, driving, and restrike, were 50 percent, 56 percent, and 81 percent for the prestressed concrete, FRP, and plastic piles, respectively. An inclinometer casing was also installed in each test pile to permit better resolution of the deflected shapes during lateral load testing.
The as-built instrumentation layout for the prestressed concrete test pile is shown in figure 117.
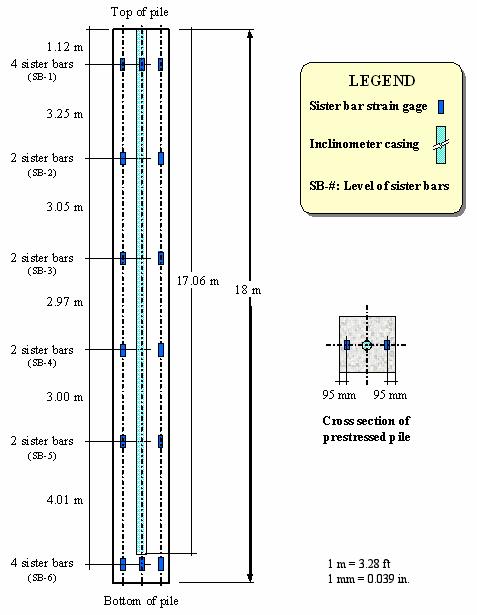
Figure 117. Illustration. Instrumentation layout for
prestressed concrete test pile.
In addition to the 16 sister bar gages, the FRP test pile had the following instrumentation to monitor strains in the FRP tube:
The as-built instrumentation layout for the FRP test pile is shown in figure 118.
The instrumentation of the plastic composite pile was similar to that used for the prestressed concrete pile. The as-built instrumentation layout for the plastic composite test pile is shown in figure 119.
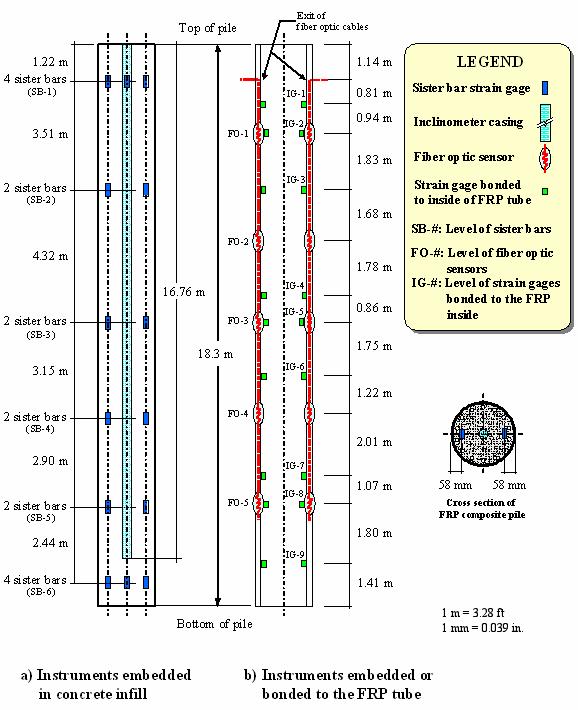
Figure 118. Illustration. Instrumentation layout for FRP
composite test pile.
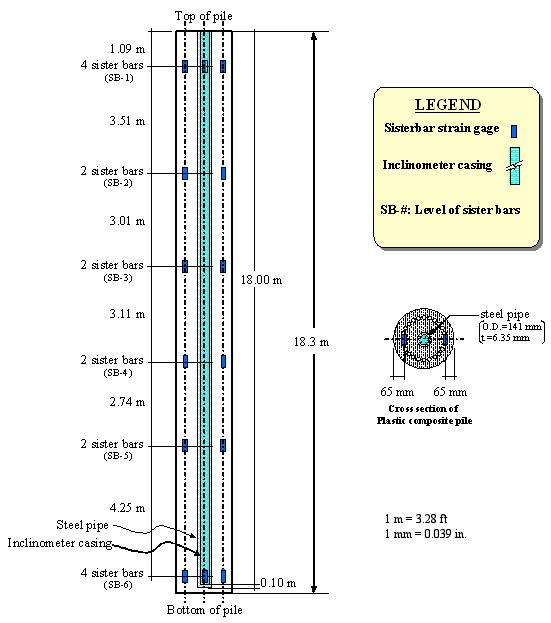
Figure 119. Illustration. Instrumentation layout for
plastic composite test pile.
On August 14, 2001, the prestressed concrete test pile was fabricated in general accordance with VDOT standards. Photos of test pile fabrication are shown in figure 120. After fabricating and curing, the piles were shipped to the bridge site.
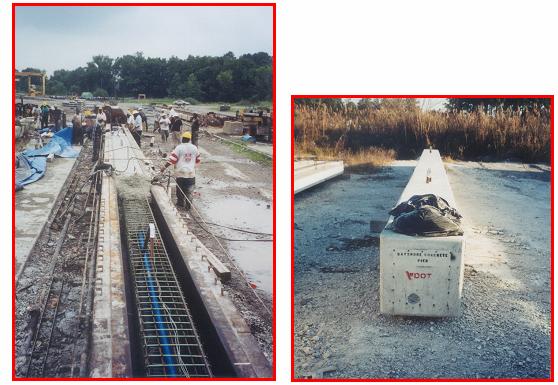
Figure 120. Photos. Fabrication of prestressed concrete
test pile.
In January 2002, two FRP tubes were shipped to a casting yard in Virginia Beach, VA. The two FRP tubes were 18.3 m (60 ft) and 21.3 m (70 ft) long for the test pile and production pile, respectively. The tubes are shown in figure 121(a). The instrumentation of the FRP piles was carried out prior to concrete pouring between January 24 and February 2, 2002. Figure 121(b) shows installation of the foil gages to the inside wall of the FRP tube.
Prior to concrete pouring, the steel rebar cage was inserted into the FRP tubes as shown in figure 121(c). The piles were then raised with a crane and secured in a vertical position with the aid of steel sheet piles and steel bracing as shown in figures 122(a) and (b). The bottoms of the FRP tubes were fitted into 76-mm (3-inch) grooves in a concrete slab. The bottoms of the FRP tubes were also bolted to the concrete slab by means of L-shaped angles, as shown in figure 122(c). An elephant trunk, shown in figure 122(d), was lowered into the pile with a hopper located at the top of the pile. The concrete was then poured through the hopper using a 2-cubic-yard (1.53-cubic-meter) bucket and a crane. Photos of the concrete pour are shown in figure 123. Concrete filling of the FRP composite piles took place on February 6, 2002.
After fabrication, the piles were left in a vertical position for 2 weeks. The piles were shipped to the bridge site on February 20, 2002.
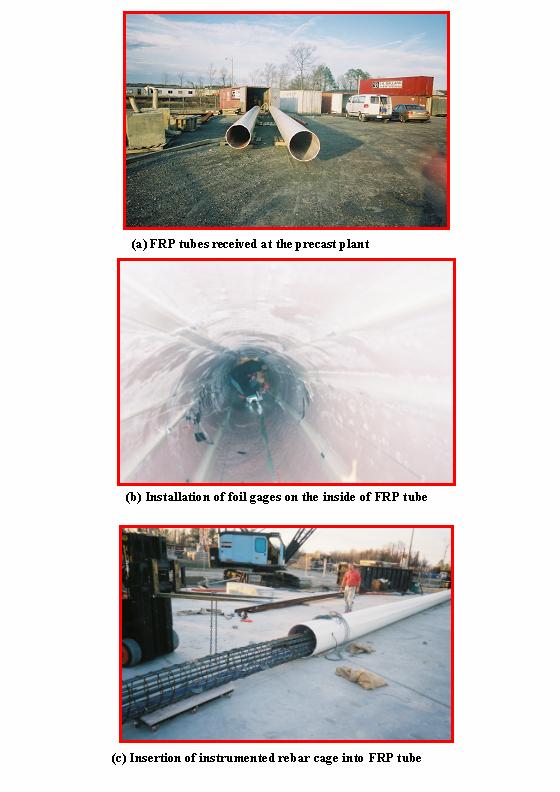
Figure 121. Photos. Fabrication of concrete-filled FRP
piles.
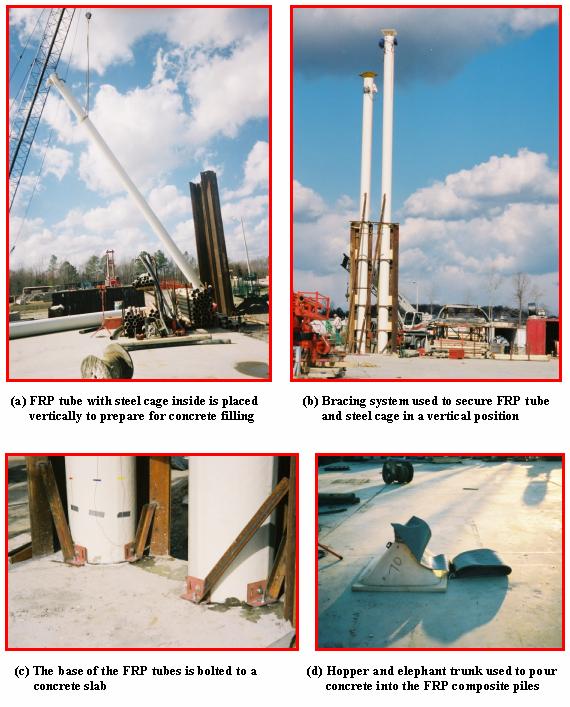
Figure 122. Photos. Setup used for concrete filling of FRP
composite piles.
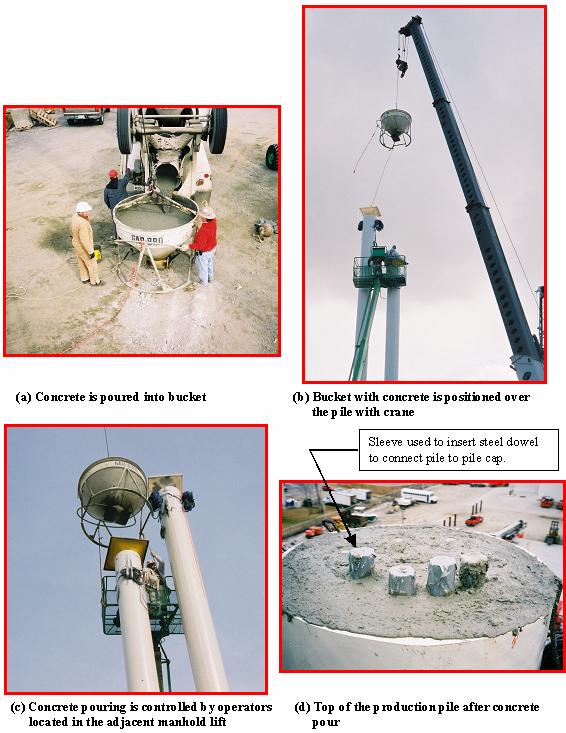
Figure 123. Photos. Concrete filling of FRP composite
piles.
The polyethylene composite test pile was instrumented with special sister bar strain gages made of materials capable of withstanding the high temperatures and pressures involved in manufacturing of the pile. The instrumentation was installed between August 20 and August 22, 2001.
Photos of test pile fabrication are shown in figures 124 and 125. After fabricating, the pile was shipped to the bridge site.
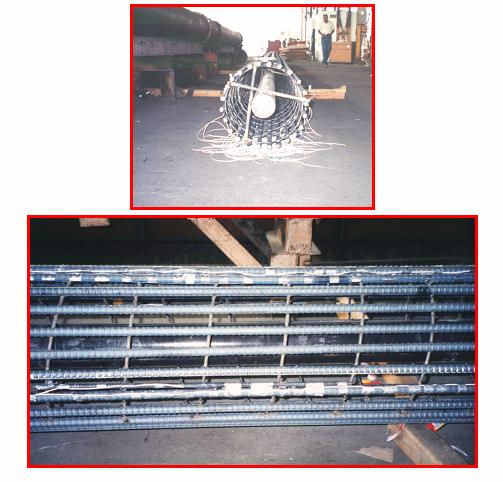
Figure 124. Photos. Rebar cage of the plastic composite
test pile.
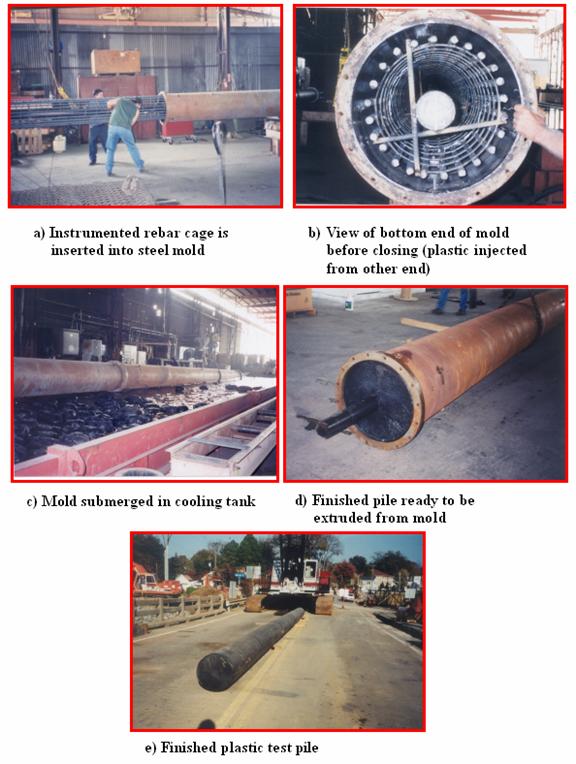
Figure
125. Photos. Manufacturing process for the plastic composite test
pile.
The test piles were driven at the locations shown in figure 116. Prior to driving, all three piles were placed in pits approximately 1.0 m (3 ft) deep, thus removing the man-made fill materials. An ICE model 80S single-acting diesel hammer was used to drive the piles. The maximum rated energy of the hammer is 108.6 kN-m (80,000 ft-lbs). All piles were driven with 230-mm- (9-inch-) thick plywood pile cushions. After driving, the pile cushions were about 140 mm (5.5 inches) thick. The prestressed concrete, FRP, and plastic piles were driven to depths of 16.76, 17.22, and 17.27 m (55.0, 56.5, and 56.6 ft), respectively, below the original ground surface. The pile-driving records are shown in figure 126. Pile installation photos for the prestressed concrete, FRP, and plastic piles are shown in figures 127 through 129, respectively.
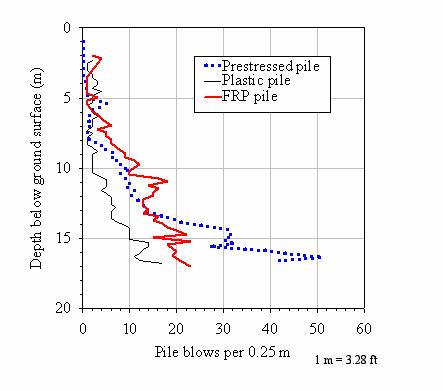
Figure 126. Graph. Driving records for test
piles.
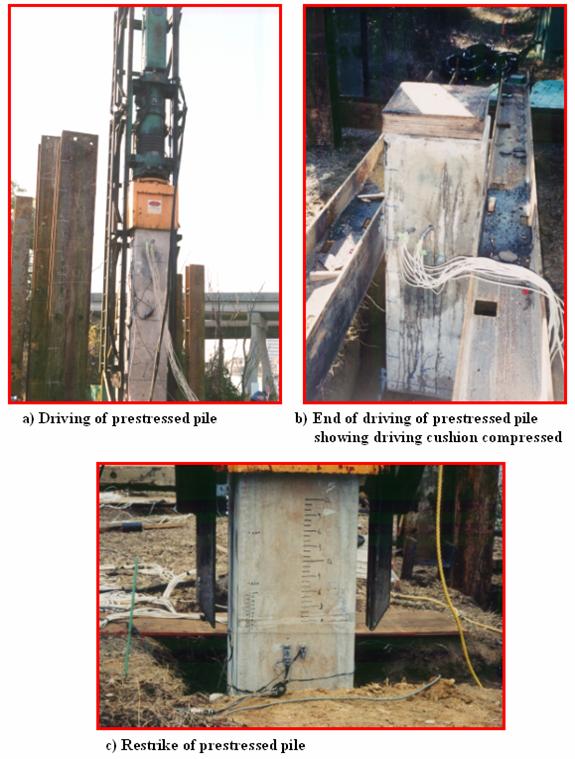
Figure 127. Photos. Installation of prestressed concrete
test pile.
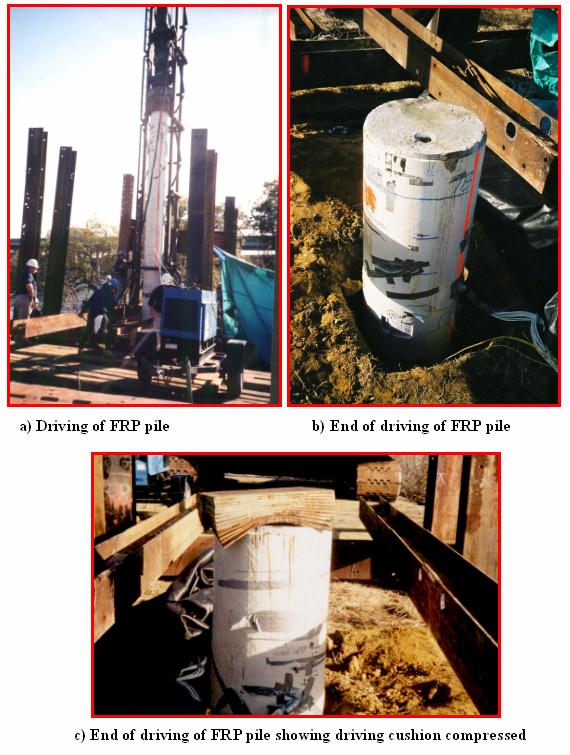
Figure 128. Photos. Installation of FRP composite test
pile.
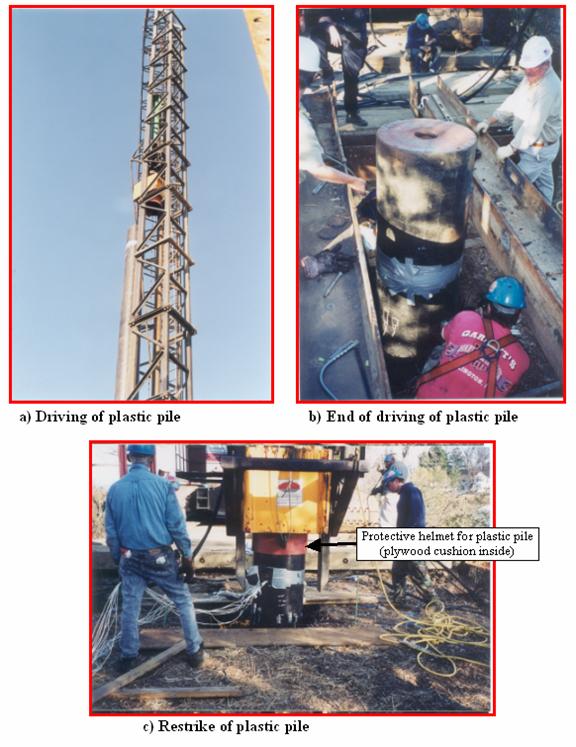
Figure 129. Photos. Installation of plastic composite test
pile.
Dynamic monitoring was performed using a Pile Driving Analyzer (PDA). Monitoring was performed during initial driving and during restrike, which occurred 5 days after initial driving. Dynamic testing was accomplished by attaching strain transducers and accelerometers at about 2 diameters from the top of the piles in pairs spaced 180 degrees apart. To attach the transducers to the FRP composite pile, small windows were cut out of the FRP shell, which allowed the instrumentation to be directly attached to the concrete infill. For the plastic pile, the transducers were bolted to the recycled plastic.
PDA records for the three types of piles at restrike are shown in figure 130. The PDA records show a force peak at about time 0 (measured with respect to the horizontal bars that are shown in figure 130, which represent the wave travel time for two pile lengths for each pile). A velocity peak can also be seen at about 2L/c (where L is the pile length, and c the wave speed). This peak is characteristic of a reflected tensile wave from the toe. The prestressed concrete and FRP composite piles show similar dynamic behavior. A large separation was observed between the force and velocity traces, beginning at about L/c for both of these piles. For the plastic pile, a gradual separation between the force and velocity traces starts to occur shortly after 0. Spiro and Pais (2002a and b) encountered problems during interpretation of the dynamic data from the plastic test pile. The stress-strain nonlinearity of the plastic (to which the transducers were attached), the strain rate dependency of the elastic properties, and the presence of voids in the plastic were all considered by the authors as possible reasons for poor quality of the dynamic data for the plastic pile. The velocity peak at 2L/c, which is due to tensile wave reflection at the toe, was not as pronounced for the plastic pile as for the other two piles.
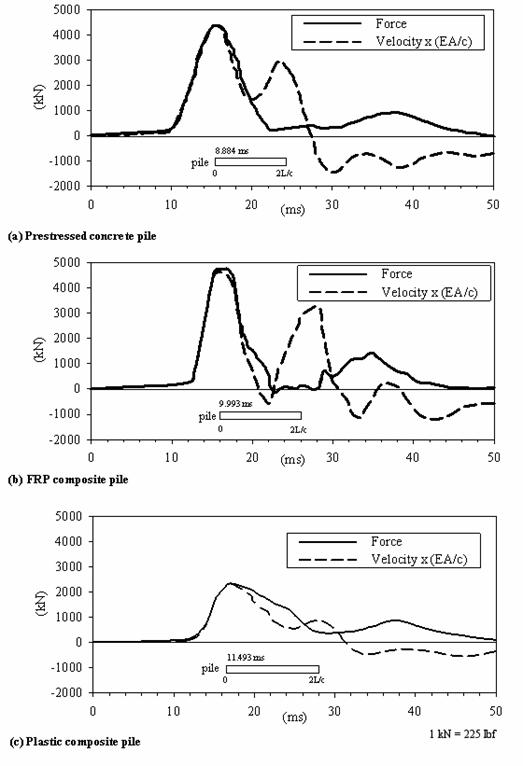
Figure 130. Graphs. PDA recordings during
restrike.
Table 30 provides some of the measurements obtained during pile driving. It can be seen that the prestressed and FRP piles had similar wave speeds, and the wave speed recorded in the plastic pile was about 18 percent lower than the prestressed pile. The maximum compressive and tensile stresses were lower than the allowable stresses recommended for prestressed piles (Hannigan, et al., 1996). The highest driving stresses were recorded in the FRP composite pile; however, no standards are currently available for allowable driving stresses for composite piles.
|
Measurement |
Pile Type |
||
|---|---|---|---|
|
Prestressed |
FRP |
Plastic |
|
|
Wave speed |
3,800 m/s |
3,782 m/s |
3,100 m/s |
|
Maximum compression stress measured during driving |
11.0 MPa |
16.2 MPa |
9.9 MPa |
|
Maximum tensile stress measured during driving |
5.6 MPa |
8.5 MPa |
3.3 MPa |
|
Allowable stresses |
Comp. < 24.5 MPa Tension < 6.7 MPa |
No standards available |
No standards available |
1 MPa = 145 lbf/inch2
Estimates of pile capacity from the dynamic strain and acceleration measurements were obtained using the Case method (Spiro and Pais 2002a and b). The strain and acceleration data from restrike were subjected to CAPWAP analyses (Spiro and Pais 2002a and b). Both the Case method and CAPWAP capacities are listed in table 31. For all three test piles, substantial increases in the Case method-derived capacity occurred between the end of initial driving and restrike 5 days later. According to the CAPWAP analyses, the prestressed concrete pile has the highest capacity at 1,960 kN (440 kips), and the FRP pile and the plastic pile have lower capacities equal to 96 percent and 77 percent, respectively, of the prestressed concrete pile capacity. The CAPWAP analyses also indicate that the shaft capacities, as percentages of the total capacities, are 46 percent, 43 percent, and 41 percent for the prestressed concrete, FRP, and plastic piles, respectively.
|
Method |
Capacity Component |
Prestressed Concrete Pile |
FRP Pile |
Plastic Pile |
|---|---|---|---|---|
|
Case (1) (end-of-driving) |
Total |
200 kN |
1,600 kN |
520 kN |
|
Case (1) (restrike (2)) |
Total |
1,800 kN |
2,300 kN |
1,300 kN |
|
CAPWAP (3) (restrike (2)) |
Shaft |
894 kN |
815 kN |
618 kN |
|
Toe |
1,066 kN |
1,069 kN |
894 kN |
|
|
Total |
1,960 kN |
1,884 kN |
1,512 kN |
Notes: (1) Case method using a Case damping coefficient of 0.60.
1 kN = 225 lbf
(2) Restrike of piles performed 5 days after initial driving.
(3) CAPWAP equivalent damping coefficient = 0.35.
Pile integrity tests (PIT) were performed on the test piles before and after pile installation. These tests consisted of applying a small impact load to the top of the pile with a hand-held hammer. The impact from the hammer generates a small downward compression wave (low strain) that travels along the pile with a wave speed, c. The PIT tests prior to installation were performed by tapping the piles while they were lying horizontally on the ground. Figure 131 shows selected photos of PIT tests before and after installation.
For a uniform pile, supported without any resistance to deformation and without any imperfections, voids, or damage, the compression wave will travel unchanged to the bottom of the pile and will be reflected upward as a tension wave. However, if the compression wave encounters a void or damage before reaching the bottom of the pile, a tension wave will be generated sooner than the reflection from the pile toe. Damage of the pile is assessed based on the velocity curve, which is investigated for wave reflections that may indicate change in pile properties due to defects. However, it is important to point out that reflections also occur due to soil resistance, particularly for piles with high shaft friction. For long piles with high shaft friction, the reflection from the toe may be very small. To help improve identification of the reflections, the records are amplified exponentially with time.
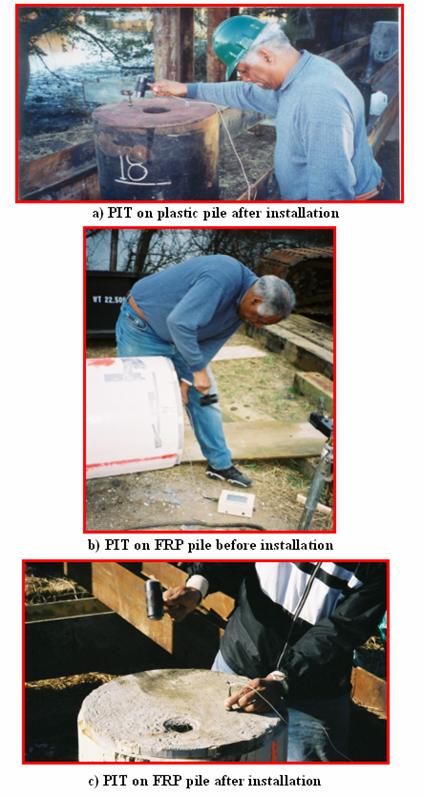
Figure 131. Photos. PIT tests on test piles.
PIT results for the prestressed concrete test pile before and after driving are shown in figures 132 and 133, respectively. No discernable damage was noted based on comparison of the pre- and postdriving PIT soundings. The soil resistance in the pile after installation results in a smaller toe reflection, as shown in figure 133.
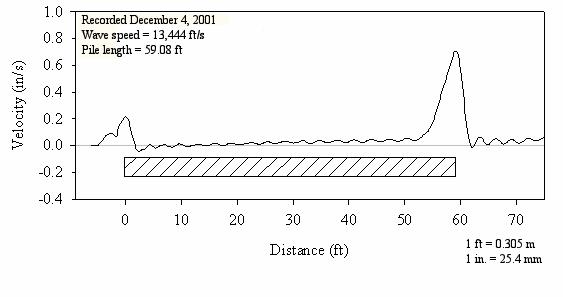
Figure 132. Graph. PIT sounding on the prestressed concrete
test pile before installation.
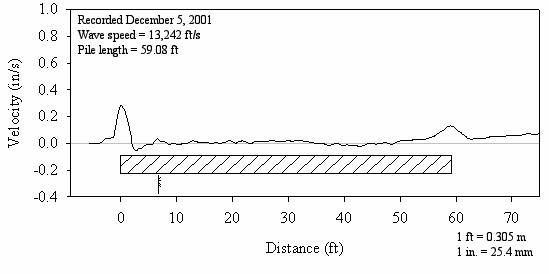
Figure 133. Graph. PIT sounding on the prestressed concrete
test pile after installation.
PIT results for the FRP test pile are shown in figures 134 and 135. No significant difference between the pre- and postdrive PIT traces was observed for the FRP pile, and similar velocity changes were noted at about 17 and 35 ft (5.19 and 10.7 m) from the pile top. Toe reflection in the postdrive PIT is almost not discernible, probably due to high soil resistance. No discernable damage was noted based on comparison of the pre- and postdriving PIT soundings.
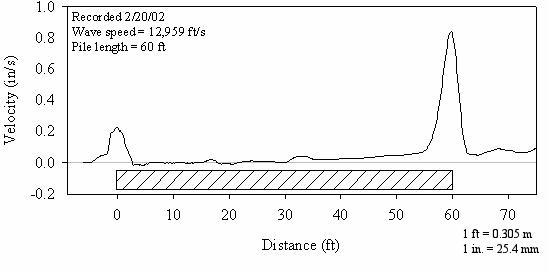
Figure 134. Graph. PIT sounding on the FRP composite test
pile before installation.
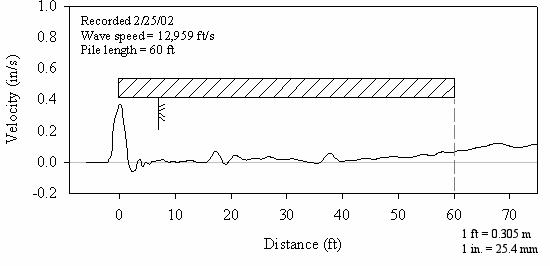
Figure 135. Graph. PIT sounding on the FRP composite test
pile after installation.
PIT results for the plastic composite test pile are shown in figures 136 and 137.
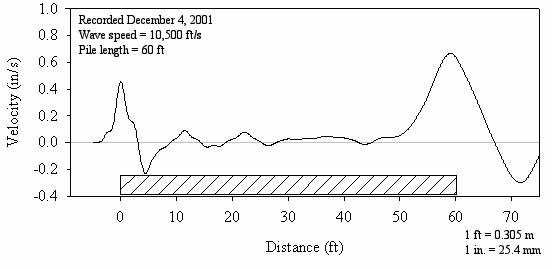
Figure 136. Graph. PIT sounding on the plastic composite
test pile before installation.
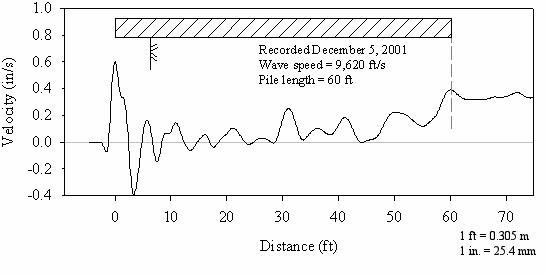
Figure 137. Graph. PIT sounding on the plastic composite
test pile after installation.
Differences can be seen between the pre- and postdrive PIT traces from the plastic pile. Some of the new velocity peaks observed in the postdriving PIT may be due to soil resistance. However, these peaks may also be related to damage that may have occurred in the pile during pile driving. The observed differences in PIT records are not conclusive to indicate whether the pile was damaged during pile installation.
The axial and lateral load test results for the three test piles are summarized in the following sections. Important date information for the Route 351 test pile program is summarized in table 32.
|
Pile Type |
Cross Section |
Length (m) |
Fabrication Date |
Driving Date |
Restrike Date |
Axial Load Test Date |
Lateral Load Test Date |
|---|---|---|---|---|---|---|---|
|
Prestressed concrete |
610 mm square |
18 |
8/14/01 |
12/5/01 |
12/10/01 |
12/17/01 |
12/17/01 |
|
Plastic |
592 mm circular |
18.3 |
8/23/01 |
12/5/01 |
12/10/01 |
12/21/01 |
12/21/01 |
|
FRP |
622 mm circular |
18.3 |
2/6/02 |
2/21/02 |
2/26/02 |
3/4/02 |
3/5/02 |
1 mm = 0.039 inches; 1 m = 3.28 ft
Static axial load tests were performed on the three test piles in accordance with ASTM D1143. The compressive test loads were applied by jacking against a steel frame anchored by eight, HP 14x89 reaction piles placed as shown in figure 116. The reaction system was designed for a maximum load of 4,448 kN (1,000 kips). The load was applied by three calibrated hydraulic jacks connected to a common manifold and pressure gage and operated by a single hydraulic pump. The load applied by this jacking system was measured using a 4,448 kN (1,000 kips) calibrated load cell. The deflections were monitored using dial gages, LVDTs (linear variable deformation transducers), and a wire and mirror system, with support provided by an isolated reference beam. Figure 138 show photos of the axial load test setup.
The axial load test was carried out by increasing the axial load using constant load increments of 89 kN (20 kips). After each load increment, the load was held constant for a time interval of 2.5 minutes. This type of loading sequence is called Quick Maintained-Load Test (Fellenius 1990) and is in general accordance with the Quick Load procedure included in ASTM D1143.
The data from the dial gages and wire and mirror system were collected by an FHWA contractor. The data from the LVTDs, sister bar strain gages, foil gages used in the FRP pile, and load were acquired using a MEGADAC® data acquisition system. FHWA operated the MEGADAC system.
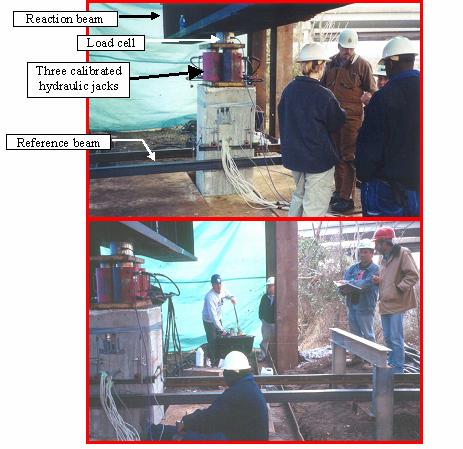
Figure 138. Photos. Axial load test of prestressed concrete
pile.
Figure 139 shows the measured axial load versus pile head displacement diagrams for all three test piles. It can be seen in figure 139 that the prestressed concrete pile and the FRP pile exhibit stiffer initial response than the plastic pile.
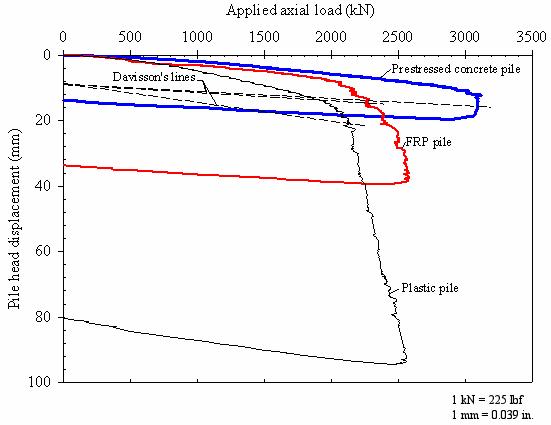
Figure 139. Graph. Axial load test results.
The pile capacities according to Davisson's criterion (Davisson 1972) are also shown in figure 139. The pile failure loads obtained using this criterion and other commonly used methods described by Fellenius (1990) are listed in table 33.
Based on Davisson's criterion, the prestressed concrete pile exhibited the highest capacity at 3,095 kN (696 kips), and the FRP pile and the plastic pile have lower capacities equal to 73 percent and 69 percent, respectively, of the prestressed concrete pile capacity.
|
Failure Criterion (1) |
Prestressed Pile Failure Load (kN) |
FRP Pile Failure Load (kN) |
Plastic Pile Failure Load (kN) |
|---|---|---|---|
|
De Beer's |
3,095 |
2,070 |
2,040 |
|
Vander Veen's |
3,180 |
2,600 |
2,250 |
|
Brinch-Hansen's (90% criterion) |
3,080 |
2,113 |
2,163 |
|
Chin's |
3,080 |
2,815 |
2,615 |
|
Brinch-Hansen's (80% criterion) |
3,103 |
2,576 |
2,459 |
|
Davisson's |
3,095 |
2,260 |
2,130 |
Note: (1) Description of failure criteria can be found in Fellenius (1990). 1 kN = 225 lbf
The strain gages that were installed in the test piles permitted calculation of the residual strains and stresses locked in the pile after pile driving.
The residual strains were calculated by comparing the strain gage readings before and after pile installation. The residual load distributions along the piles were then obtained by multiplying the recorded residual strains by the respective pile axial stiffness (EA). The residual load distributions are shown in figure 140.
The average residual stresses acting along the pile shaft can be estimated by considering the vertical equilibrium of the different pile segments between the levels of sister bar strain gages. Using this procedure, the estimated residual stress distributions for the three test piles are shown in figure 141. The residual stresses for the prestressed concrete and FRP piles are estimated to range between ±9 kPa (1.305 lbf/inch2). The estimated residual stresses for the plastic pile do not seem very realistic; nevertheless, their values ranged between +28 kPa (4.06 lbf/inch2) and -40 kPa (5.8 lbf/inch2).
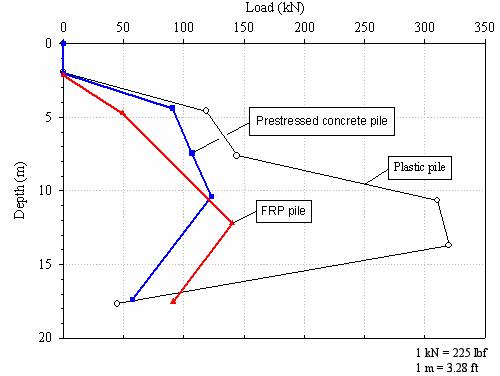
Figure 140. Graph. Distribution of residual
loads.
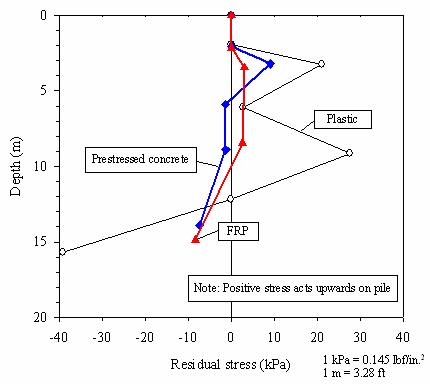
Figure 141. Graph. Distribution of residual
stresses.
The three test piles have different embedded shaft areas and different toe areas. Consequently, it is informative to separate the shaft and end resistances, and to normalize these resistances by the shaft and toe areas. The strain gages that were installed in the test piles permitted calculations of load transfer from the piles to the ground. These calculations were performed with consideration of residual stresses after driving, using the procedures described in Fellenius (2002). The resulting load transfer diagrams are shown in figure 142. From these diagrams, the shaft and toe components of pile capacities can be determined at the Davisson failure loads, and these are listed in table 34. The shaft capacities, as percentages of the total capacities, are 78 percent, 65 percent, and 70 percent for the prestressed concrete, FRP, and plastic piles, respectively.
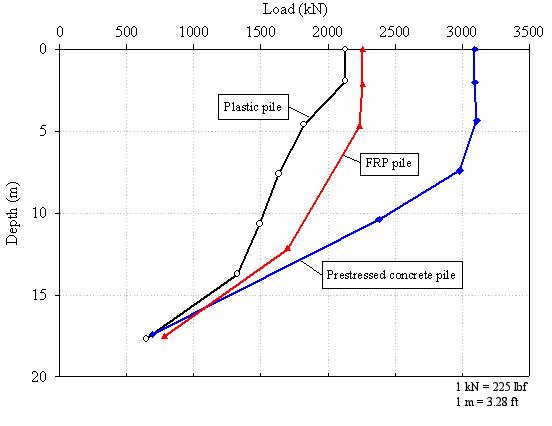
Figure 142. Graph. Load distribution for the three test
piles at the Davisson failure loads.
|
Capacity Component |
Prestressed Concrete Pile |
FRP Pile |
Plastic Pile |
|||
|---|---|---|---|---|---|---|
|
Capacity (kN) |
Days after EOID* |
Capacity (kN) |
Days after EOID |
Capacity (kN) |
Days after EOID |
|
|
Shaft |
2,406 |
12 |
1,480 |
11 |
1,487 |
16 |
|
Toe |
689 |
780 |
643 |
|||
|
Total |
3,095 |
2,260 |
2,130 |
|||
* EOID = the end of initial driving 1 kN = 225 lbf
Using the shaft and toe capacities from the static load tests, together with the embedded pile shaft areas and the pile end areas, the average unit shaft resistances (fs) and the unit toe resistances (qt) were determined for conditions at the Davisson failure loads. The resulting values are listed in table 35, which shows that the average unit shaft resistances decrease in order, from the prestressed concrete pile to the plastic pile to the FRP pile, and that the unit toe resistances increase in the same order from the prestressed concrete pile to the plastic pile to the FRP pile. The observed relationship between mobilized average shaft stress and toe stress for each of the three piles is shown in figure 143.
|
Pile Type |
Average Unit Shaft Resistance, fs (kPa) |
Unit Toe Resistance, qt (kPa) |
|---|---|---|
|
Prestressed concrete pile |
61.8 |
1,854 |
|
FRP pile |
46.9 |
2,564 |
|
Plastic pile |
48.9 |
2,339 |
Note: (1) Resistance values are for Davisson failure loads. 1 kPa = 0.145 lbf/inch2
There are notable differences between the results of the static load tests and the CAPWAP analyses on restrike hammer blows, as shown in table 31. The capacities from the static load tests are higher than the capacities from the CAPWAP analyses by 58 percent, 20 percent, and 41 percent for the prestressed concrete, FRP, and plastic piles, respectively. Strength gain during the 6 to 11 days that passed between restrike and the static load tests may be due to continued setup during this time period. This apparent strength gain versus elapsed time after end of initial driving (EOID) is illustrated in figure 144 by plotting the capacities determined using the Case method, CAPWAP analyses, and static load test results. It is also noted that the shaft capacities from the static load tests are much higher percentages of total capacity than are the shaft capacities from the CAPWAP analyses. Again, this may be due (at least in part) to changes in capacity distribution occurring during setup. It is also recognized that CAPWAP analyses and static load tests are different methods of determining pile capacity, and thus may produce different total capacities and different capacity distributions.
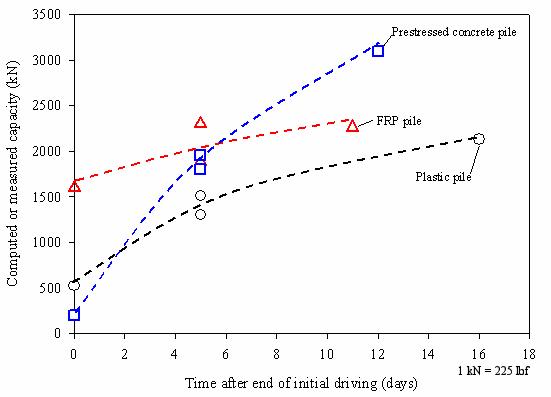
Figure 144. Graph. Apparent strength gain with time in the
three test piles.
For each test pile, a static lateral load test was performed on the same day as, or the first day following, the static axial load test. The lateral load tests were performed in accordance with ASTM D3966, using the same reaction system as used for the axial load tests. A calibrated jack and a calibrated load cell were used. Displacements near the pile head were monitored with dial gages and LVDTs, with support provided by an isolated reference beam.
Deformed shapes of the piles at several different lateral load magnitudes were obtained from standard inclinometer probe surveys along the installed casings. These shapes are shown in figure 145, together with the elevations of the original ground surface, the bottom of the pits at the test pile locations, and the points of load application. The piles exhibit negligible lateral deformation below depths of 6, 3.3, and 3.5 m (19.7, 10.8, and 11.5 ft) below the bottom of the pits at the test pile locations for the prestressed concrete, FRP, and plastic piles, respectively.
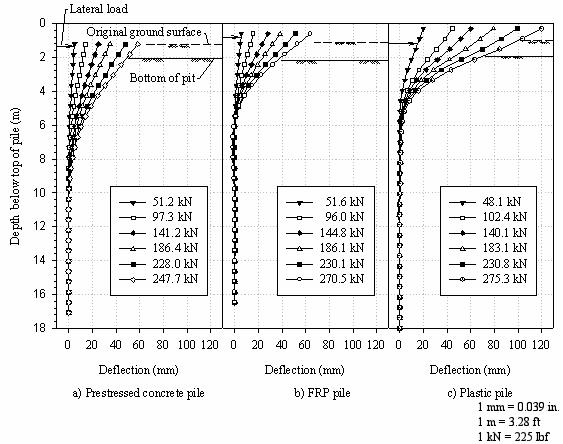
Figure 145. Graphs. Deformed shapes of piles at different
lateral loads.
The measured load is plotted against pile deflection at the original ground surface in figure 146, which shows that the prestressed concrete pile and the FRP pile exhibited similar load-deflection response and that the plastic pile deformed the most. At a lateral load of 200 kN (45 kips), the deflections were approximately 35, 33, and 70 mm (1.37, 1.29, and 2.73 inches) for the prestressed concrete, FRP, and plastic piles, respectively.
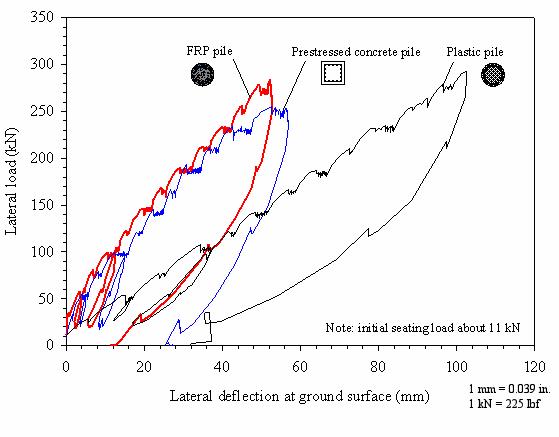
Figure 146. Graph. Measured lateral deflections at ground
surface for the three test piles.
A test pile program was conducted to permit direct comparison of the axial and lateral load behavior of three test piles: (1) a conventional, 610-mm (23.8-inch) square, prestressed concrete pile; (2) a 622-mm (24.3-inch) diameter composite pile formed of an FRP shell and filled with concrete and steel reinforcing bars; and (3) a 592-mm (23.1-inch) diameter composite pile formed of a polyethylene plastic matrix with steel reinforcing bars. Laboratory tests were performed on the pile materials, and the axial and bending stiffnesses of the piles were calculated. The piles are all about 18 m (59.0 ft) long. The soils at the test site were investigated, and they consist primarily of medium-dense silty sand with a 2.5-m (8.20-ft) thick layer of stiff sandy clay located about 1 to 3.5 m (3.28 to 11.5 ft) above the pile toes. The field testing program included dynamic measurements with CAPWAP analyses, static axial load tests, and static lateral load tests.
The following conclusions can be drawn from the test program.

