U.S. Department of Transportation
Federal Highway Administration
1200 New Jersey Avenue, SE
Washington, DC 20590
202-366-4000
Federal Highway Administration Research and Technology
Coordinating, Developing, and Delivering Highway Transportation Innovations
 |
| This report is an archived publication and may contain dated technical, contact, and link information |
|
Federal Highway Administration > Publications > Research > Structures > Covered Bridge Manual |
Publication Number: FHWA-HRT-04-098 |
Previous | Table of Contents | Next
Figure 139. Fitch's Bridge, Delaware County, NY. Photo
Figure 140. Brown's River Bridge, Westford, VT. Photo
This manual focuses on extant historic covered bridges. Therefore, critical topics deal with evaluating a given bridge from a number of perspectives, ranging from condition and anticipated remaining service life to reasonable load capacity and potential alternate uses. A careful physical examination of all bridge components by an experienced, knowledgeable, thorough, and careful professional, is often sufficient to identify the sources of potential structural distress, should they exist. Many individuals have the technical ability to analyze a relatively simple structure, but few can appreciate the complexities of a heavy timber truss connected with traditional methods. Experience often can guide inspectors to the critical elements in any given existing covered bridge. Therefore, attention to obtaining a careful field evaluation is an appropriate starting point for discussing bridge evaluation.
A logical way to begin evaluating a structure would be to locate the original construction documents, as well as any subsequent rehabilitation contracts related to the structure, before visiting the bridge. Most extant historic covered bridges were built without significant plans, or plans that may have been used no longer exist, but this document research exercise is still appropriate. If plans are available, they may have been generated during a subsequent rehabilitation project, in which case, the extent of the documentation can range from minimal to thorough.
At a minimum, bridges that have been open to vehicular traffic within the past 20 years and that span more than 6.1 m (20 feet) should have been inspected as part of the routine, federally mandated bridge maintenance inspection program. Accordingly, bridge inspection records should be available to assist with the new field evaluation of the bridge. Because a bridge's condition can change quite dramatically and quickly, especially for timber structures that may be exposed to unsound roofing and/or siding, the latest inspection report may offer good background information, but may not be current. For structures that have been closed to traffic within the past 20 years, the last inspection record may be quite dated, because there is no Federal mandate to continue the inspection program for structures closed to traffic.
After all available information has been collected, the field evaluation may begin. Many references offer useful guidance about evaluating timber structures in general, and inspecting bridges in particular. (Refer to the Manual for Condition Evaluation of Bridges[19] or Timber Bridges-Design, Construction, Inspection, and Maintenance.[4]) This manual is not intended to duplicate such information. However, there are several specific issues that should be considered when inspecting an extant historic covered bridge.
In addition to identifying rotted or otherwise damaged materials, critical issues for inspecting covered bridges include:
The horizontal and vertical alignment of the trusses.
The degree to which the structure is out of square with respect to any of its axes.
The condition of the tension splices in the lower chords.
Failing connections, not members, cause most problems with covered bridge trusses. A covered bridge's position and alignment can reveal a great deal about its condition and can help focus inspection efforts on specific connections.
Bridges often develop specific distortions as a result of deterioration in various components or connections. The deformations can be limited to the superstructure, or they can be related to external movements. The entire bridge can be shifting, with movement at an abutment or pier. This is fairly rare, but not unknown. A more likely cause of entire structure movement is deterioration in the supporting or bearing points. Most covered bridges were originally built with some form of sacrificial blocking to separate the lower chord members from the supporting stone or concrete foundation material. These bearing blocks were readily replaced, as contact with the collected debris at this location would accelerate their decay. Although they are designed and intended to be replaced fairly regularly, inspection often reveals that these components are rotted, often to an extent that threatens the chord members above with moisture-related deterioration. Rotted lower chord ends is a very common cause for collapsing covered bridges.
Even an initial assessment of the bridge geometry can indicate the need to do a close inspection at the truss bearing areas. In many instances, the areas surrounding the ends of the bottom chords are surrounded with an accumulation of dirt and debris tracked into the bridge by the tires of passing vehicles, or washed in because of improper approach drainage. These areas should be cleaned at least annually to maintain good ventilation around the timber and eliminate the excess moisture exposure brought with this debris.
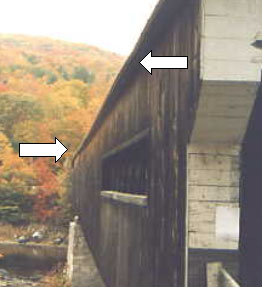
The most common distortions within the superstructure are sag and rack. A bridge that is out-of-square, when looking along the longitudinal axis, or down the lane, can be said to have racked. Usually, the transverse knee braces display evidence of this movement, particularly in those that are on the side with the now obtuse angle, or the ones that were loaded in tension as they tried to resist this racking. Failed knee braces are symptoms, not causes, of racked bridges. Something else is causing the movement, and the knee braces simply were not strong or stiff enough to resist the movement. Rack can be characterized further by whether the deck is level and the trusses are tipped, or whether the trusses are still plumb but the deck is sloped from side to side. Figure 141 provides an illustration of rack and distortion. Although it is more evident onsite, this two-span bridge was quite racked and distorted, especially over the pier. In this photograph, the distortion is most noticeable along the edge of the roof overhang.
Although the trusses in most surviving covered bridges are flat, some still have an appreciable vertical curvature. This camber in the truss is a measure of its out-of-flatness. A truss with a slight upward (positive) camber probably still is able to support its current loading without significant distress. However, this is not always the case. Over time, wood will creep under its own dead weight. When creep is sufficient, there is a noticeable sag in the truss. A sag (negative camber) in a truss may indicate structural distress, in at least some component or connection. A substantial sag could also lead to contact of the bottom chord of the bridge with the abutment back wall. An example of sag is presented in figure 142. Like the previous figure, it may be hard to discern, but the bottom chord of this long-span Burr arch bridge contained a sag in excess of 457 mm (18 inches). The bridge is scheduled for a major rehabilitation in the near future.
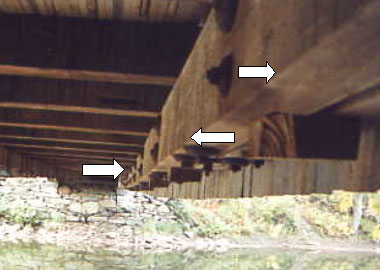
Figure 142. Example of sag-Station Bridge, Cambridge, VT, before rehabilitation. Photo
Because the bridge was almost certainly installed plumb and square, it must have moved to a racked condition. Although it is possible, it is the exception that a bridge site may be exposed to regular and consistent prevailing winds that shift and tip the bridge. Rack almost always reflects internal distress. Settling at one side of a pier can initiate a modest tipping, which brings the bridge's dead load into position to further move the bridge sideways. With gravity and decay, this racking will continue until intervention stops it. Bridges that are racked and still have plumb trusses should be inspected for failure at the abutments or bearing blocks. This is especially true if the rack is worse near one end of the bridge.
If, on the other hand, the superstructure racking is reflected through a nonlevel deck, this may mean that one truss has settled more than the other. This unevenness is one way that failed truss connections manifest themselves. Several things could be causing only one truss to fail. Prevailing winds and wind-driven rains can cause nonuniform deterioration. Uneven loading could also cause the situation. For instance, the Wertz Mill Bridge in Pennsylvania has a two-lane configuration with a stop sign at one end and a gravel pit near the other. On a regular basis, the nearly 61-m (200-ft) span supports loaded gravel trucks waiting bumper to bumper to pass through the T intersection at the far end. On the return trip, these trucks are empty; therefore, the bridge has racked as a consequence of such unequal loading.
Uneven vertical position, however, is most likely a result of the natural distribution of wood's material properties, both in members and at connections. Seemingly identical trusses, submitted to virtually identical load histories, may still behave differently in the long run.
Among the many reasons that a heavy timber truss (or trusses) might sag under long-term loading, by far the most common is an inadequate tension splice. Because the tension members-and more specifically, the tension connections-are often the weak link in any heavy timber truss, a careful examination of these splices is essential. Large gaps at any connection justify a more thorough investigation. On the other hand, tight tension splices inspire greater confidence. Although there can be a large number of variations in the layout used in a tension splice, most contain some basic features (for more discussion, see chapter 14).
Large tensile forces require an extensive amount of bearing and/or shear area to transfer the forces from one tension chord member to the next. Therefore, in addition to considering the tightness of the joint, look for evidence of fiber crushing or overall member distortion as symptoms of tensile weakness or failure. Figure 143 depicts a joint between bottom chord elements of a Town lattice truss. The large opening indicates a bridge in distress. In addition, the joint is rarely located at the center of the intersection of two lattices; the joints between chords are typically midway between lattice intersections.
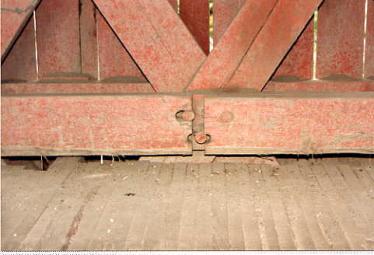
Figure 143. A chord butt joint in trouble-Station Bridge in Northfield, VT. Photo
The alignment of the trusses along their longitudinal axis and in a level plane indicates their load-carrying capacity, compared with the loads they have borne. These bows or sways (horizontal displacement or curvature in the trusses) can result from buckling in overstressed truss compression members. Misalignments in the truss chords (bows or kinks) can also indicate that the out-of-plane bracing of the compression members is inadequate. Overall bridge sway or bow is rarely initiated by transverse wind (or even high water) loads on the bridge sides. These distortions are almost always secondary symptoms of other problems; the bridge may have settled unevenly, initiating rack, which induced some sideways, for example.
Establishing the bridge's alignment is relatively straightforward in construction surveying. The vertical alignment is measured with a level. The first thing to determine is the overall vertical position. Most bridges span between level abutments and piers, but this is not always the case. In cases where covered bridges span both far enough and between banks that are of sufficiently different elevations, the builders placed the superstructure on a slope. In these cases, the camber or sag must be plotted relative to a sloped line. The horizontal alignment should be measured at both deck level and at the eave line level. In both horizontal and vertical alignment measurements, the position is established relative to consistent points in the superstructure. Commonly, the deck and roof beam centerlines are used to establish rack and sway. The top surfaces of the bottom chords are fairly convenient and consistent spots to use for the vertical sag or camber measurements. In trusses with panel points, the truss verticals are logical places to take both measurements. In Town lattice trusses, almost any reasonable and evenly spaced transverse cross section will serve; a common use would be at each roof beam. There are many ways to represent the deflections that will be of use to analysts and those responsible for assessing a bridge's condition. Both the original data and these plotted deflections should be carefully saved, because they could prove invaluable to subsequent investigators who might be trying to determine whether a span has moved. Leaving discreet marks on the members where the measurements were taken, and taking thorough and careful field notes, could help subsequent measurements be more meaningfully compared with earlier ones.
It can be very difficult to inspect for deterioration in individual bridge components. This is especially true for members that are in close proximity to sister components. The mating surfaces at connections between adjoining members can be deteriorated to the point of leaving the components with little capacity while exhibiting little outward evidence of this distress.
Probes and moisture meters are vital to a thorough member and connection inspection. The moisture meter can identify areas of high moisture where deterioration is more likely to begin. Deteriorated areas can be investigated with an increment borer to identify the extent of internal decay. However, it can be extremely difficult to ensure that all areas of deterioration have been found, before any rehabilitation involving bridge disassembly.
As mentioned earlier, determining the wood species of various bridge components can be vital when evaluating the bridge. Because very few investigators are sufficiently trained and experienced to identify wood species in situ, small specimens (coupons) of timber can be removed from critical bridge elements for remote identification by a trained specialist working in an equipped laboratory. The specimen can be quite small (about the size of a short pencil) and still provide sufficient material for the specialist. The cost to examine a specimen generally is not significant.
As with species identification, few individuals are trained to identify the quality grading for any particular existing component, be it Dense Select Structural or not as good as Number 2. However, lumber grading organizations can provide individuals who are qualified to conduct a field grading examination of an existing structure. With available access for tactile and visual inspection of the various components (given physical proximity and removal of siding at critical locations), an experienced lumber grader can offer guidance on grading the bridge members in 1-2 days. The cost for these in situ grading services may be a reasonable daily professional fee plus travel.
Because portions of the surfaces of some components are likely to be obscured from view by adjacent members, the grader will have to limit the quality assessment to that based on surface areas that are visible. This often results in a quality identification of only what a given member is not; for example, "This member does not qualify as a "Select Structural," or "This member is no better than a Number 1." Hence, the professional assessment of timber quality, while valuable, can still leave some gaps in the physical assessment of the bridge's condition. The engineer, therefore, must determine the appropriate characterization of that phase of the work based on the input provided by the professional grader, but subject to the above noted limitations.
Lumber grading rules divide timbers into a few discreet categories with their attendant allowable stresses. It is theoretically possible to establish a reasonable and timber-specific allowable level for each stress type by using basic methods to establish allowable stresses. To derive a more thorough assessment of the condition of various components in a covered bridge, beyond species identification and grading, one can conduct a refined examination of the various member elements based on concepts identified as strength ratio. "Material Properties/Allowable Stresses" in chapter 13 contained a listing of the ASTM specifications that aim to establish the allowable stresses for timber, based on various physical features of a given timber (e.g., knot size and distribution, slope of grain, and growth ring spacing). Specifically, ASTM D 245, "Standard Practices for Establishing Structural Grades and Related Allowable Properties for Visually Graded Lumber," contains the technical protocols for conducting such a field examination. This work requires special training as a wood scientist, as well as experience with timber in general. The complete field evaluation of all the members in a covered bridge could take several days or weeks, with commensurate costs. Such an examination is still restricted to visible portions of the structural components. Further, the results available even with this elaborate procedure are limited by the fact that the procedure is based on the standardized use of the 95 percent exclusion rule, as discussed in chapter 13.
Chapters 11 and 12 contained discussions aimed at evaluating the forces on, and stresses in, the various covered bridge components. Comparing the design capacity of the structural elements to the design forces imposed on them is vital in establishing the vehicle weight or pedestrian density that can safely cross the structure. As noted elsewhere in this manual, this comparison effort often yields results that indicate a theoretical weakness with the bridge that could be contrary to the clear historic evidence of apparent safe use by unrestricted vehicles.
The AASHTO publication, Manual for Condition Evaluation of Bridges, contains provisions to help analysts determine the safe load that can cross a structure-a process termed rating a bridge.[18] In simplified terms, a given structural element's rating is the ratio between the element's net live load capacity and the force imposed in that component by a rating vehicle. As long as the given element has a capacity greater than that induced by dead load alone, it can be said to have a reserve available for live load. In a desired situation, the element would have sufficient capacity to support the forces induced by both dead loads and the full weight of the desired vehicle weight.
As an example, suppose a given bridge component has an axial capacity of 13,630 kg (30,000 pounds). Further assume that the weight of the structure induces an axial force in the same element equal to 9,080 kg (20,000 pounds). Finally, assume that an H20 design vehicle would causes a 9,080-kg (20,000-pound) axial force in the element. In this case, the total force from both dead load and desired design vehicle is 18,160 kg (40,000 pounds), which exceeds the capacity of the element. However, the element does have a capacity reserve for live load equal to the 13,630-kg (30,000-pound) capacity minus the 9,080-kg (20,000-pound) dead load force, or 4,540 kg (10,000 pounds). This means that the member could safely support a vehicle weighing half as much as a full-weight design vehicle, or 9,080 kg (20,000 pounds). In another way of representing this calculation, the element would have a rating factor equal to (30,000 - 20,000)/20,000 = 0.5. Applying this to the 18,160-kg (40,000-pound) H20 design vehicle gives an allowable live load of 9,080 kg (20,000 pounds), or H10.
The AASHTO specifications further provide for two conditions related to evaluating existing structures analytically. The first measure uses the same stress level as that used for design conditions as a measure of the capacity of the structure that should be safe for everyday traffic- the inventory condition. The second capacity measure uses a higher stress level-one that is still safe, but intended only as an upset limit for the rare and occasional use by heavier vehicles. This is the operating condition.
To continue the previous example, assuming that the capacity of the element previously cited was at the inventory stress level, then a vehicle weighing only up to 0.5 times that of an H20 vehicle (i.e., an H10 vehicle), could safely cross the structure repeatedly. Next, assume that the operating stress level for the given example element is such that the operating capacity of the element is 18,160 kg (40,000 pounds). (Note that the relationship between operating and inventory stresses is a function of various parameters, but is typically assumed to be no more than 1.33 more for timber bridges.) Then the operating rating factor of the element is (40,000 - 20,000)/20,000 = 1.0. This indicates that, while the element can safely support the forces induced by the full weight of only a H10 design vehicle repeatedly, the element should still safely support the weight of a heavier vehicle (as heavy as an H20 vehicle) on an occasional basis.
Determining the rating for the overall structure is controlled and established by the lowest rated element. This means that all load-supporting components must be evaluated to determine the critical capacity for the entire bridge.
A key decision in establishing a bridge's capacity relates to the significant difference between inventory and operating ratings. When structures cannot safely support full design vehicle loading using the inventory rating levels, then a weight restriction may be imposed on the structure. Determining the appropriate weight restriction for the structure usually culminates in installing a regulatory sign (e.g., Maximum Weight 10 Tons, Single Truck Only, Passenger Cars Only). Some highway agencies base their load-capacity posting policies directly on the inventory stress level, some base it on the operating stress level, while still others use some function between the two levels. If the alternate route is not excessive or onerous, some bridge owners will post a lower, intentionally conservative load limit to protect the bridge.
Because of the common difficulties encountered in documenting higher safe load capacities for covered bridges when based on current specifications, some have suggested using the upper stress level (the operating level) in posting load capacities for these historic bridges. The decision to use operating levels as posted limits should be made carefully. While it may be difficult to adopt this protocol based on the intent of the specifications, it is nonetheless a means to document a somewhat higher capacity while still keeping with the apparent (if difficult to determine by calculations) reserve strength that many covered bridges demonstrate.
The preceding discussion was prepared assuming that the covered bridge in question appears to have more load capacity than an initial and theoretical rating evaluation would indicate. If there is any evidence of particular structural distress in the structure, then there should be no reason to look for ways to deliberately inflate its safe load capacity. This process must be performed by competent engineers, with experience in both rating bridges and evaluating timber structures.
Evaluating the relative safety of using a structure solely for pedestrians is closely related to rating structures for their safe vehicular load capacity (recall that chapter 11 discussed pedestrian loading).
The AASHTO bridge specifications contain guidance on assumed design loading from pedestrians as a function of the bridge deck area that might be loaded. Indeed, closely spaced pedestrian loads, such as might develop on a bridge during a special event, can represent a sizeable load on a structure, even more than that from light vehicles. However, if there is no reliable or credible history of such event on the bridge, then the full pedestrian loading contained in the AASHTO specifications is not necessary.
Similar to the process used to determine the reserve capacity available for vehicular loading, one can determine the reserve capacity for pedestrian loading and then compare that available capacity with the likelihood of that many people congregating on the bridge at any one time. If the available capacity seems small, then it is appropriate to be conservative. Yet, often a structure will have a safe reserve capacity for hundreds of pedestrians in a location where the structure may only rarely experience more than a few people at one time. Evaluate pedestrian loading realistically. Signs can be prominently displayed, with warnings about limitations on the numbers of people allowed to safely occupy the span at the same time.
Much has been written about the difficulties in accurately analyzing the load capacity for any given structure. An alternative approach, a nondestructive field load test, is occasionally used.
When a structure apparently has higher load capacity than analysis indicates, then a careful program involving incrementally loading the structure can be undertaken. Span deflections and member or connection strains can be measured and compared with predicted values. Comparing measurements at incremental loading can indicate whether the structure is behaving in an apparently elastic mode or, rather, if inelastic behavior is being induced. Elastic behavior implies that the stress levels within the structure may be within acceptable limits, and the members are not permanently deformed after the load is removed. Inelastic behavior implies that the loading is too high, resulting in permanent deformation, or otherwise is unsafe for the structure.
Nondestructive load testing procedures for metal structures are widely accepted as safe and reliable. Strain measurements are repeatable in metal structures, lending support for conclusions. The AASHTO Manual for Condition Evaluation of Bridges term for comparing field strain-gauge information to that anticipated with linear elastic behavior analysis is "diagnostic load testing."[18]
Proof testing establishes a safe load capacity, based on incrementally loading a bridge to levels based in analytically estimated capacities. If the target load can be attained without apparent distress to the structure, then that capacity is identified as a proof load. If structural distress is encountered at loads below the target load, then the capacity is reduced accordingly. The National Cooperative Highway Research Program (NCHRP) has developed an entire manual that explains proof and diagnostic testing, the Manual for Bridge Rating through Load Testing.[20]
Timber structures, however, tend to be far less homogenous than metal structures, meaning that strain measurements are much less reproducible and reliable due to the larger discontinuities in timber. Further, it is much more difficult to determine if a timber structure is behaving within the elastic range or inelastic range. Because the primary structural components of interest in establishing covered bridge capacity are the timber trusses, the deflections in a typical timber truss may be only a small fraction of an inch, even under a 20-ton vehicle load. Furthermore, the time-dependent material properties found in wood can obscure the relative elasticity of a given load level. Small variations in the ability to measure the deflection can greatly influence the interpretation of the test results.
For these reasons, the analyst should be very careful about relying on nondestructive load testing results as a primary determinate in establishing the load capacity of a covered bridge.
However, using field measurements to augment information generated by analytical evaluations can be very instructive. Using sophisticated analytical evaluations of timber structures benefits from independent means to verify the predicted behavior. For instance, given a refined computer analysis of a structure, comparing predicted and field measured deflection behavior and strain behavior can offer additional confidence in the computer simulation, or can indicate the need to examine unexpected results. In this way, load testing is very helpful as another tool, even without relying on it entirely for establishing the capacity of the structure. Figures 144 and 145 show a load test of a Town lattice truss bridge for deflection measurements used as a check against such a computer simulation. Figure 144 shows the two trucks used as known loads. Figure 145 shows several dozen dial gauges used beneath the structure to measure the response of various locations under the imposition of known weight vehicles positioned at specific locations along the bridge.
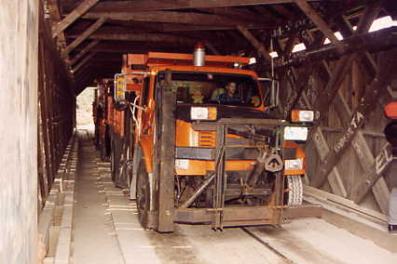
Figure 144. Field tests for deflection measurement comparison against computer prediction-Brown Bridge, Shrewsbury, VT. Photo
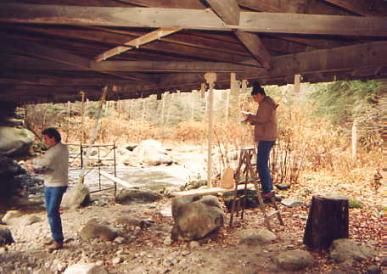
Figure 145. Dial gauges used to measure the load response. Photo
Appendix A contains an article, "Those Intriguing Town Lattice Timber Trusses," which discusses a recent load test using strain transducers in an historic covered bridge.
Over the past several years, there have been various attempts to examine the behavior of the more critical components in covered bridges, through both nondestructive and destructive means, including:
There is little information in contemporary literature about the shear strength of the wooden pegs used as connectors in Town lattice trusses. The wooden peg tests mentioned above were pilot tests of the various strength parameters found in the typical, full-size peg connections. The test specimens used the oak pegs and spruce timbers and single and triple connector configurations found in the actual trusses. For the specimens tested and the materials used, the approximate double shear strength of a single 44-mm (1.75-inch) diameter peg was established to be about 681 kg (1,500 pounds). This work provided a measure of reassurance about the shear stresses determined analytically, using a sophisticated three-dimensional finite element modeling of the supporting Town lattice trusses.
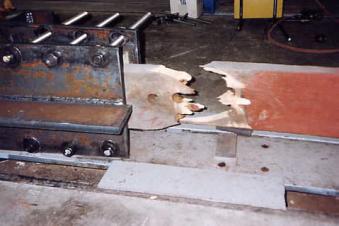
Figure 146 shows a three-element test specimen used to test direct shear in a three-peg connection. The timber planks were typically sized spruce elements used in many bridges. The pegs were 44-mm (1.75-inch) diameter rounds typical of trunnels used in Town lattice trusses. The test involved measuring vertical load resistance versus displacement, and this image was taken following complete failure of the connection, as indicated by the trunnel that has failed in bending.
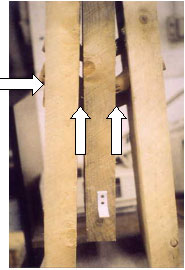
Figure 146. Three-element test specimen. Photo
Load tests were also performed on lattice elements removed from two extant covered bridges that were scheduled for followup extensive rehabilitation. The tests involved using eight lattice elements, approximately 75 by 300 mm (3 by 12 inches), and 6.1 m (20 ft) long. Initially, the full-size lattice members were tested to destruction, following the requirements of ASTM D198. Remnants of the failed elements were then prepared for small-scale testing, in accordance with the requirements of ASTM D143 tests. While the tests were informative, the lack of statistical support due to the limited number of test specimens failed to provide clearly definitive answers. However, the work led to the hypothesis of considering a reduced exclusion percentage in manipulating timber material's allowable stress properties. Research is pending to test further that hypothesis.