U.S. Department of Transportation
Federal Highway Administration
1200 New Jersey Avenue, SE
Washington, DC 20590
202-366-4000
Federal Highway Administration Research and Technology
Coordinating, Developing, and Delivering Highway Transportation Innovations
 |
| This report is an archived publication and may contain dated technical, contact, and link information |
|
Publication Number: FHWA-HRT-04-124
Date: April 2005 |
|||||||||||||||||||||||||||||||||||||||||||||||||||||||||||||||||||||||||||||||||||||||||||||||||||||||||||||||||||||||||||||||||||||||||||||||||||||||||||||||||||||||||||||||||||||||||||||||||||||||||||||||||||||||||||||||||||||||||||||||||||||||||||||||||||||||||||||||||||||||||||||||||||||||||||||||||||||||||||||||||||||||||||||||||||||||||||||||||||||||||||||||||||||||||||||||||||||||||||||||||||||||||||||||||||||||||||||||||||||||||||||||||||||||||||||||||||||||||||||||||||||||||||||||||||||||||||||||||||||||
Lab & Field Testing of AUT Systems for Steel Highway Bridges5. TESTING AND EVALUATION PLANTesting and evaluation of the AUT technique included both laboratory testing and inline field testing. The laboratory evaluation assessed the viability of AUT under controlled laboratory conditions. The inline field testing assessed the practicality of the AUT technique and system for use in the fabrication shop environment. The AUT laboratory study was conducted at FHWA's Nondestructive Evaluation Validation Center (NDEVC) laboratory. The laboratory specimens consisted of professionally manufactured plates with implanted artificial flaws and plates fabricated in a steel bridge fabrication shop that contained volumetric defects. AUT field testing and evaluation was performed at fabrication plants in Lancaster, PA, and Bowling Green, KY. The field specimens were flange and web plates commonly fabricated for use in steel bridge girders. In the laboratory and field studies, the P-scan system was not configured to inspect the weld for transverse defects (defects perpendicular to the weld centerline) or defects in the weld at width transitions (width transitions will be described in the Description of Specimens section below). To inspect these defects and regions, special gates, different setups, and different data files are required in order to account for and mask the sidewall reflections. Since the research objectives focused on the AUT process rather than on the internal processing associated with AUT, no special gates, etc., were used. Consequently, testing could not include the previously mentioned defects or regions. DESCRIPTION OF SPECIMENSAll specimens were butt-welded steel plates with full-penetration groove welds. Some of the specimens had thickness transitions and/or width transitions at the butt joints as shown in figures 29 and 30, respectively. Welding at thickness transitions is generally performed on two plates of unequal thickness. Welding at width transitions is generally performed on two plates of unequal width. The defects common in full-penetration butt welds generally fall into two categories: planar defects and volumetric defects. The planar defects consist of cracks and lack of fusion, while volumetric defects include slag inclusions, porosity, and incomplete penetration.
Laboratory SpecimensThe laboratory specimens were obtained from two different sources. The first source is a flaw manufacturing company specializing in the production of welded steel plates with artificially induced, crack-like defects in the weld. Two of the 10 laboratory specimens were made by this company and were designated as category 1 laboratory specimens, while the remaining eight specimens were made by another company and were designated as category 2 laboratory specimens. The thicknesses of the laboratory specimens ranged from 12.7 to 38.1 mm (0.5 to 1.5 inches). Widths ranged from 142.875 to 454.025 mm (5.625 to 17.875 inches). To simulate typical flange plates and avoid encountering spurious backwall echoes during the AUT inspections, the laboratory specimens were approximately 508 mm (20 inches) long. The descriptions of the laboratory specimens are contained in table 1. The first column in table 1 indicates the different categories of laboratory specimens. The second column indicates the specimen identification code. The third and fourth columns indicate the thicknesses of plate 1 (T1) and plate 2 (T2), respectively. Different values for T1 and T2 indicate that the weld is located at a thickness transition. The fifth column of table 1 indicates the plate width. For welds located at flange width transitions, the width is equal to the width of the narrowest plate (figure 30). The number of scan segments used to effectively inspect the entire weld is shown in column six. Column seven indicates the transducer's refracted angle (i.e., the wedge angle). Table 1. Description of laboratory specimens
Category 1 SpecimensThe category 1 laboratory specimens were 12.7 mm (0.5 inch) thick, 304.8 mm (12 inches) wide, and contained crack-like defects with known characteristics. The weld reinforcement was not ground flush in either specimen. Table 2 describes the physical characteristics of the defects in each specimen. The first column of table 2 indicates the specimen identification code, the second column describes the type of defect induced in the weld, the third column shows the length of each defect, and the fourth column indicates the Y location of each defect measured from the datum. Specimen S033 contained two longitudinal cracks (one at the toe and one at the root of the weld), while specimen S034 contained one longitudinal crack and one transverse crack. Table 2. Description of manufactured defects in the category 1 laboratory specimens.
1 inch = 25.4 mm Category 2 Specimens The thicknesses of the category 2 laboratory specimens ranged from 25.4 to 38.1 mm (1 to 1.5 inches) and the widths ranged from 142.875 to 454.025 mm (5.625 to 17.875 inches). The specimens were fabricated to include lack of fusion, slag inclusions, and/or porosity. The fabricator performed manual UT inspection on the category 2 specimens and the characteristics of the defects found in the weld are indicated in table 3. The first column of table 3 indicates the specimen identification code, the second column describes the number of indications detected in the weld, the third column specifies the angle (q) of the transducer, the fourth column indicates the length (L) of each indication, the fifth column indicates the depth (Z) of each indication measured from face A (face A is shown in table 6.2 in the AASHTO/AWS D1.5M/D1.5: 2002 Bridge Welding Code(1)), the sixth column indicates the indication rating (d), the seventh column shows the location of each indication measured from the weld centerline (X), and the eighth column shows the location of each indication measured along the weld centerline from the datum (Y). Table 3. Description of defects found by manual UT in the category 2 laboratory specimens.
Field SpecimensThe field specimens were 25.4 to 83.82 mm (1 to 3.3 inches) thick, 279.4 to 1092.2 mm (11 to 43 inches) wide, and on the order of 30.48 meters (m) (100 feet (ft)) long. There were a total of 46 field specimens tested in the fabrication plants using the AUT system. In one fabrication plant (High Steel Structures, Inc. (HSS)), 42 field specimens were tested. One specimen was a web plate, 2 were company procedural test plates, and the remaining 39 were flange plates. Some of the specimens had thickness transitions at the butt joints, width transitions at the butt joints, or both. The two company procedural test plates (i.e., TP2 and AWS-FCM-02-6A-TP) were similar to the laboratory specimens and typically were used by the fabricator's quality assurance and quality control division for in-house training and practice. The thicknesses of the field specimens tested at HSS ranged from 25.4 to 83.82 mm (1 to 3.3 inches) and the widths ranged from 279.4 to 1092.2 mm (11 to 43 inches). Table 4 provides a description of the field specimens from the first fabrication plant. The first column in table 4 indicates the period in which field testing was conducted, while the second column indicates the specimen identification code. The identification codes are always stamped on the plates outside of the HAZ to identify both the plate and the weld. The third and fourth columns indicate the thicknesses of each joined plate (as shown in figure 29). Different values for T1 and T2 indicate that the weld is located at a thickness transition. The fifth column indicates the plate width. For welds located at width transitions, the width is equal to the width of the narrowest plate (figure 30). The number of AUT scan segments used to effectively inspect the entire weld is shown in column six, while column seven indicates the transducer's refracted angle (i.e., the wedge angle). Table 4. Description of field specimens tested at HSS.
1 inch = 25.4 mm Table 4. Description of field specimens tested at HSS (continued).
1Transition of thickness at butt joint parts BottF: Bottom flange CF: Compression flange In the other bridge fabrication plant (Stupp), four field specimens were tested. The description of each of these specimens is tabulated in table 5. All of the specimens were flange plates. The thicknesses of these specimens ranged from 50.8 to 66.675 mm (2 to 2.625 inches) and the typical width was 609.6 mm (24 inches). Table 5. Description of field specimens tested at Stupp.
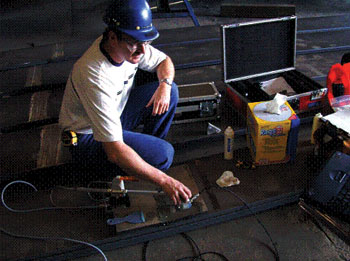
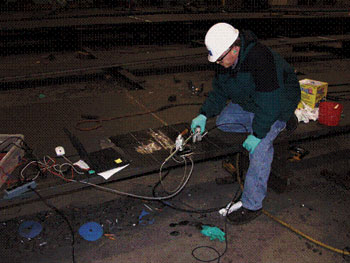
inch = 25.4 mm LABORATORY TESTINGFHWA's NDEVC laboratory was used to test and evaluate the AUT system under controlled conditions. For each test, an appropriate angle transducer was selected based on the thickness of the joined plates. According to table 6.2 in the AASHTO/AWS D1.5M/D1.5: 2002 Bridge Welding Code,(1) plates with thicknesses from 12.7 to 38.1 mm (0.5 to 1.5 inches) require a 70-degree angle transducer. Thus, all laboratory specimens were tested using a 70-degree angle transducer operating at 2.25 MHz. The category 1 laboratory specimens containing crack-like flaws of known physical characteristics were inspected by the P-scan system. The welds were scanned from both sides of the centerline using the Both configuration. The category 2 laboratory specimens that were fabricated to include discontinuities such as lack of fusion, slag inclusions, and/or porosity were inspected by the P-scan system. The BSC and TSC scanner configurations were used in inspecting specimens S125, S126, S135, and S136. The remaining category 2 specimens were inspected using the Both configuration. All laboratory specimens were inspected by RT. The RT inspection was performed at the fabrication plant by American Society for Nondestructive Testing (ASNT)-certified RT inspectors. The inspection documents and reports, including the radiographic films, are available. FIELD TESTINGDuring each testing period, the P-scan system was set up, calibrated, and placed adjacent to the RT and manual UT systems. FHWA's NDEVC staff was responsible for P-scan operations, while resident inspection engineers from the fabrication plants performed RT and manual UT. All three scanner configurations (TSC, BSC, and Both) were implemented during testing. Since the field specimens were generally thicker than 12.7 mm (0.5 inch) and wider than 304.8 mm (12 inches), the specimens were generally segmented into two or more AUT scan segments. Thus, the P‑scan system required a total of 106 scans to inspect the 46 field specimens.
Figure 31. AUT field testing: High Steel Structures, Inc.
|
|||||||||||||||||||||||||||||||||||||||||||||||||||||||||||||||||||||||||||||||||||||||||||||||||||||||||||||||||||||||||||||||||||||||||||||||||||||||||||||||||||||||||||||||||||||||||||||||||||||||||||||||||||||||||||||||||||||||||||||||||||||||||||||||||||||||||||||||||||||||||||||||||||||||||||||||||||||||||||||||||||||||||||||||||||||||||||||||||||||||||||||||||||||||||||||||||||||||||||||||||||||||||||||||||||||||||||||||||||||||||||||||||||||||||||||||||||||||||||||||||||||||||||||||||||||||||||||||||||||||


 °
°