Lab & Field Testing of AUT Systems for Steel Highway Bridges
6. RESULTS (cont'd)
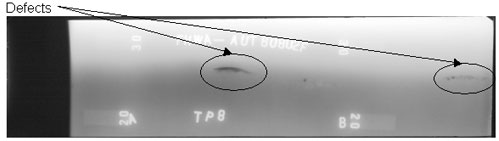
Figure 58. Laboratory specimen S135: Radiographic image showing discontinuities in the weld between markers A and B. |
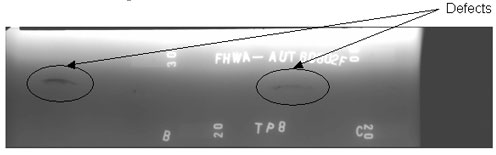
Figure 59. Laboratory specimen S135: Radiographic image showing discontinuities in the weld between markers B and C. |
Figure 60. P-scan images of laboratory specimen S135: From TSC side of centerline between 0 and 203.2 mm (0 and 8 inches).
|
Figure 61. P-scan images of laboratory specimen S135: From BSC side of centerline between 0 and 203.2 mm (0 and 8 inches). |
Figure 62. P-scan images of laboratory specimen S135: From TSC side of centerline between 203.2 and 454 mm (8 and 17.875 inches). |
Figure 63. P-scan images of laboratory specimen S135: From BSC side of centerline between 203.2 and 454 mm (8 and 17.875 inches). |
 Figure
64. Laboratory specimen S136: Side view of joint. Figure
64. Laboratory specimen S136: Side view of joint.
|
Figure
65. Laboratory specimen S136: Top
view of joint.
|
Figure
66. Laboratory specimen S136:
Radiographic image showing discontinuities in the weld between markers A
and B.
|
Figure
67. Laboratory specimen S136:
Radiographic image showing discontinuities in the weld between markers B
and C.
|
Figure 68. P-scan images of laboratory specimen S136: From TSC side of centerline between 0 and 203.2 mm (0 and 8 inches).
|
Figure
69. P-scan images of laboratory
specimen S136: From BSC side of centerline between 0 and 203.2 mm (0 and 8
inches).
|
Figure
70. P-scan images of laboratory
specimen S136: From TSC side of
centerline between 203.2 and 454 mm (8 and 17.875 inches).
|
Figure
71. P-scan images of laboratory
specimen S136: From BSC side of centerline
between 203.2 and 454 mm (8 and 17.875 inches).
|
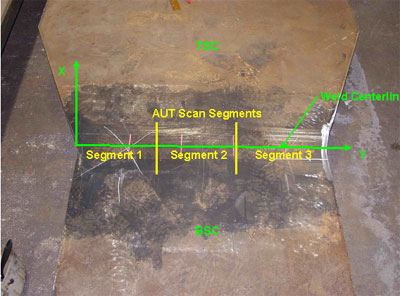
Figure 72. Field specimen FG38k-TF2-TopF-FCM used in blind testing: Top view of joint. |
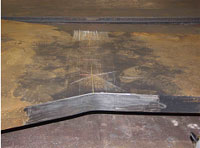
Figure 73. Field specimen FG38K-TF2-TopF-FCM used in blind testing: Side view of joint. |
Figure 74. P-scan images of field specimen FG38K-TF2-TopF-FCM using 45-degree probe: From TSC side of certerline between 0 and 279.4 mm (0 and 11 inches). |
Figure 75. P-scan images of field specimen FG38K-TF2TopF-FCM using 45-degree probe: From BSC side of centerline between 0 and 270.4mm (0 and 11 inches). |
Figure 76. P-scan image of field specimen FG38K-TF2-TopF-FCM using 45-degree probe: From TSC side of centerline between 279.4 and 558.8 mm (11 and 22 inches). |
Figure 77. P-scan iamges of field specimen FG38K-TF2-TopF-FCM using 45-degree probe: From BSC side of centerline between 279.4 and 558.8 mm (11 and 22 inches). |
Figure 78. P-scan iamges of field specimen FG38K-TF2-TopF-FCM using 45-degree probe: From TSC side of centerline between 558.8 and 857.25 mm (22 and 33.75 inches). |
Figure 79. P-scan iamges of field specimen FG38K-TF2-TopF-FCM using 45-degree probe: From BSC side of centerline between 558.8 and 857.25 mm (22 and 33.75 inches). |
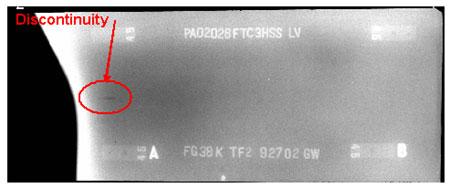
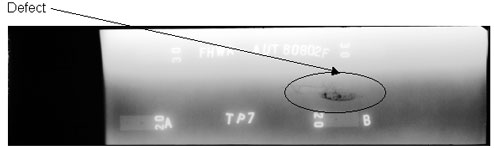
Figure 80. Radiographic image of field specimen FG38K-TF2-TopF-TCM: Section A-B. |
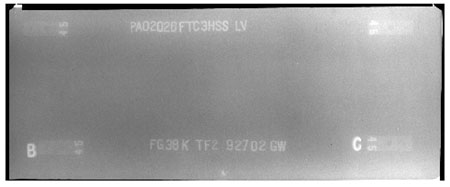
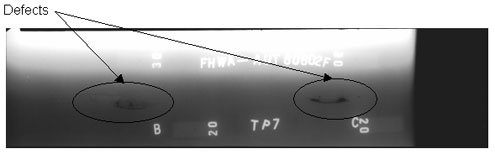
Figure 81. Radiographic image of field specimen FG38K-TF2-TopF-FCM: Section B-C. |
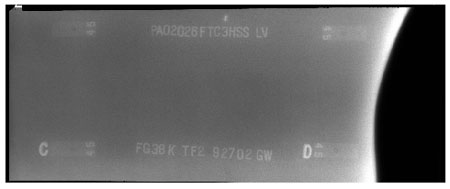
Figure 82. Radiographic image of field specimen FG38K-TF2-TopF-FCM: Section C-D. |
BLIND FIELD-TESTING RESULTS
During the course of the AUT field study, it was not convenient to
conduct blind testing because of fabrication plant logistics and scheduling. However,
one blind test was conducted successfully. The purpose of blind testing was to
eliminate bias by performing AUT inspection before RT and manual UT inspection.
The specimen (selected at random) for blind testing was FG38K-TopF-FCM.
Specimen FG38K-TopF-FCM was composed of two welded butt joints designated as
FG38K-TF1-TopF-FCM and FG38K-TF2-TopF-FCM, each having a width transition.
Specimen FG38K-TopF-FCM was 76.2 mm (3 inches) thick, 857.25 mm (33.75 inches)
wide, and was designated as a fracture-critical member (FCM). Plates designed as
FCMs must be inspected by both RT and manual UT according to section 6.7.1.2 of
the AASHTO/AWS D1.5M/D1.5: 2002 Bridge Welding Code.(1) Table 6.2 in
the AASHTO/AWS D1.5M/D1.5: 2002 Bridge Welding Code(1) indicates that
plates with thicknesses ranging from greater than 60 to 90 mm (2.5 to 3.5
inches) must be inspected by UT using 45-degree and 70-degree probes. The
45-degree probe inspects the top quarter of the weld thickness, while the
70-degree probe inspects the remainder of the weld thickness. Unfortunately,
the AUT inspection was only performed using a 45-degree probe because of time
constraints.
For convenience, the width of each butt joint was divided into three
segments: 280 mm (11 inches), 280 mm (11 inches), and 300 mm (11.75 inches)
long. The P-scan results indicated that specimen FG38K-TF1-TopF-FCM passed the
AUT inspection with no rejectable defects in the weld. However, specimen
FG38K-TF2-TopF-FCM (figures 72 and 73) was diagnosed with defects and was rejected.
The P-scan images of specimen FG38K-TF2-TopF-FCM are shown in figures 74
through 79. Figures 74 and 75 show the P-scan images of the first segment of
the weld. At location Y = 27.686 mm (1.09 inches) from the datum, a 20.32-mm-
(0.8-inch-) long indication was found. In addition, subsurface indications were
detected along face A (i.e., the top surface) and face B (i.e., the
bottom surface) of the plate. Figures 76 and 77 show the second segment of the
weld with rejectable subsurface indications. Figures 78 and 79 show rejectable
subsurface indications in the third segment of the weld. Figures 80 through 82
show the RT results for specimen FG38K-TF2-TopF-FCM in three segments. The
first section extends from the left edge of the plate to approximately 304.8 mm
(12 inches) from the left edge (figure 80). Fiducial marker B,
indicated in figure 80, corresponds to the same marker in figure 81
(the second segment of the radiograph). Fiducial marker C, in figure 81,
corresponds to the same marker in figure 82 (the third segment of the
radiograph). The radiographic image for specimen FG38K-TF2-TopF-FCM (shown in figure
80) indicates a slag inclusion at location Y = 19.05 mm (0.75 inch)
from the left edge. No subsurface defects were observed in the other radiographs.
Table 7 summarizes the blind field-testing results.
Table 7. Inspection results of blind field testing.
Specimen ID |
RT |
Manual UT |
AUT |
FG38K-TF2-TopF-FCM |
Rejected
Ind. 1: A-B, Slag 0.75" From A Edge
(i.e., Y = 0.75") |
Rejected
Ind. 1:  = 45° = 45°
L = 0.80"
Y = 1.00"
Ind. 2: Subsurface Indications |
Rejected*Ind. 1A: BSC, = 45°
d = -2 dB
L = 0.55", Z = 1.72"
X = -0.40", Y = 1.09"
Ind. 1B: TSC, = 45°
d = +3 dB
L = 0.25", Z = 1.82"
X = -0.08", Y = 1.79"
Ind. 2A: TSC, = 45°
d = +9 dB
L = 1.86", Z = 0.08"
X = -2.06", Y = 4.68"
Ind. 2B: BSC, = 45°
d = +10 dB
L = 0.15", Z = 0.05"
X = -0.04", Y = 6.45"
Ind. 3: BSC, = 45°
d = +8 dB
L = 1.10", Z = 2.82"
X = -0.49", Y = 6.68"
Ind. 4: BSC, = 45°
d = +9 dB
L = 4.44", Z = 2.883"
X = +0.56", Y = 11"
Ind. 5: BSC, = 45°
d = +7 dB
L = 1.45", Z = 2.85"
X = -1.08", Y = 16.41"
Ind. 6: BSC, = 45°
d = +8 dB
L = 0.31", Z = 0.07"
X = -0.56", Y = 20.01"
Ind. 7: BSC, = 45°
d = +9 dB
L = 1.19", Z = 2.88"
X = +0.69", Y = 22.86"
Ind. 8: BSC, = 45°
d = +10 dB
L = 2.42", Z = 2.9"
X = +0.84", Y = 27" |
FG38K-TF1-TopF-FCM |
Accepted |
Accepted |
Accepted |
*Under the
provisions of table 6.3 in the AASHTO/AWS D1.5: 2002 Bridge Welding Code (i.e.,
class B and class C flaws shall be separated by at least 2L), Ind. 1A,
Ind. 1B, ... are considered as a single defect, Ind. 2A, Ind. 2B, ... are
considered as a single defect, etc.
1
inch = 25.4 mm
FIELD-TESTING RESULTS
The field testing
results are summarized in tables 8 through 12. The first column of tables 8
through 12 indicates the specimen identification code. The second, third, and fourth
columns indicate the inspection method performed on each specimen. "Rejected"
or "Accepted" indicates that the specimen was either rejected or accepted,
respectively, by the employed inspection method. "Not Required" indicates that
the owners did not prescribe the particular inspection method for the specimen.
In the cases where the specimens were rejected by RT and the owners did not
require manual UT inspection, the fabricators used manual UT to determine the
defect depth so that efficient repairs could be performed. In tables 8
through 12, "Ind." stands for indication, and the angle (q)
indicates the transducer's refracted angle. The indication characteristics in
the fourth column (i.e., indication rating (d), length (L), depth (Z),
x-position, and y‑position) are obtained from P-scan images. These
characteristics are compared with the UT acceptance-rejection criteria in tables
6.3 and 6.4 from the AASHTO/AWS D1.5M/D1.5: 2002 Bridge Welding Code(1)
to determine whether the indications are accepted or rejected.
Tables 8
through 12 show that RT was performed on the remaining 44 field specimens
according to the owner's requirements. Note that section 6.7.1.2 of the
AASHTO/AWS D1.5M/D1.5: 2002 Bridge Welding Code(1) indicates that
100 percent of each joint subjected to calculated tension or stress reversal
and 25 percent of each joint subjected to compression or shear should be
inspected by manual UT or RT. The P-scan and radiographic images of the rejected
field specimens are provided in figures 83 through 96.
The results from
the first field test set at HSS are summarized in table 8. Only two specimens were tested in the first set using RT and AUT. Manual UT
was not required. RT and AUT accepted both specimens with no rejectable
defects.
Table 8. Inspection results of the first field testing at HSS.
Specimen ID |
RT |
Manual UT |
AUT |
G20A-TF2-BottF |
Accepted |
Not Required |
Accepted |
G21A-TF2-BottF |
Accepted |
Not Required |
Accepted |
Table 9. Inspection results of the second field testing at HSS.
Specimen ID |
RT |
Manual UT |
AUT |
G3F-CF1-BottF |
Accepted |
Not Required |
Accepted |
G3F-CF2-BottF |
Accepted |
Not Required |
Accepted |
G3F-TF1-TopF |
Accepted |
Not Required |
Accepted |
G3F-TF2-TopF |
Accepted |
Not Required |
Accepted |
G4F-TF1-TopF |
Accepted |
Not Required |
Accepted |
G4F-TF2-TopF |
Accepted |
Not Required |
Accepted |
G3J-TF1-TopF |
Accepted |
Not Required |
Accepted |
G3J-CF1-BottF |
Accepted |
Not Required |
Accepted |
G2A-CF1-TopF |
Accepted |
Not Required |
Accepted |
G2A-CF2-TopF |
Accepted |
Not Required |
Accepted |
G2A-CF3-TopF |
Accepted |
Not Required |
Accepted |
G2A-CF4-TopF |
Accepted |
Not Required |
Accepted |
G5G-TF1-TopF |
Rejected
Ind. 1: A-B,
0.13" Slag 0.94" From Edge
(i.e., L = 0.13", Y = 0.94")
Ind. 2: B-C,
0.25" Slag 0.82" From Edge
(i.e., L = 0.25", Y = 19.19")
|
Not Required
(Accepted Within Code
Ind.1:
L = 0.5", Z = 0.56"
X = 0, Y = 0
Ind. 2:
L = 0.5",
X = 0, Y = 19.0")
|
Accepted Within Code
Ind. 1: TSC, = 70°
d = +14 dB
L = 0.52", Z = 0.81"
X = -0.05", Y = 0"
Ind. 2: BSC, = 70°
d = +14 dB
L = 1.12", Z = 0.11"
X = -0.22", Y = 18.4"
|
G2G-CF1-BottF-FCM |
Accepted |
Rejected |
Rejected*Ind. 1A: TSC, = 45°
d = +5 dB
L = 0.58", Z = 1.12"
X = -0.06", Y = 26.21"
Ind. 1B: TSC, = 45°
d = 0 dB
L = 1.50", Z = 1.12"
X = +0.01", Y = 26.93"
|
*Under the
provisions of table 6.3 in the AASHTO/AWS D1.5: 2002 Bridge Welding Code (i.e.,
class B and class C flaws shall be separated by at least 2L), Ind. 1A,
Ind. 1B, ... are considered as a single defect, Ind. 2A, Ind. 2B, ... are
considered as a single defect, etc.
1 inch = 25.4 mm
Table 10. Inspection results of the third field
testing at HSS.
Specimen ID |
RT |
Manual UT |
AUT |
FG4A-TF1-BottF-FCM |
Accepted |
Accepted |
Accepted |
FG1A-TF1-BottF-FCM |
Accepted |
Accepted |
Accepted |
FG2A-TF1-BottF-FCM |
Accepted |
Accepted |
Accepted |
FG3A-TF1-BottF-FCM |
Accepted |
Accepted |
Accepted |
FG37K-TF2-TopF-FCM |
Accepted |
Accepted |
Accepted |
FG38K-TF3-BottF-FCM |
Accepted |
Accepted |
Accepted |
FG26G-TF2-BottF-FCM |
Rejected
Ind. 1: A-B,
0.12" Slag 0.59"
From B Edge
(i.e., L = 0.12", Y = 11.29") |
Accepted Within Code |
Accepted Within Code
Ind. 1: BSC, = 70°
d = +7 dB
L = 0.39", Z = 0.76"
X = 0.45", Y = 9.97" |
FG16D-TF1-BottF-FCM |
Rejected
Ind. 1: A-B, Within Code
0.04" Slag at A
(i.e., L = 0.04", Y = 0")
Ind. 2: A-B,
0.12" Slag 0.98" From B Edge
(i.e., L = 0.12", Y = 11.02") |
Accepted Within Code |
Accepted Within Code
Ind. 1: BSC, = 70°
d = +14 dB
L = 1.74", Z = 0.69"
X = -0.24", Y = 0.61"
Ind. 2: BSC, = 70°
d = +9 dB
L = 0.72", Z = 0.32"
X = -0.14", Y = 9.56" |
FG36K-TF2-TopF-FCM |
Rejected
Ind. 1: C-D,
Edge of Plate
(i.e.,
Y = 33.75") |
Rejected
Ind. 1: = 70°
L = 2", Z = 0.5"
X = -0.75", Y = 33.5"
Ind. 2: Subsurface Indications |
Rejected*Ind. 1: BSC, = 45°
d = +7 dB
L = 0.83", Z = 0.04"
X = +1.2", Y = 22.55"
Ind. 2A: TSC, = 45°d = +9 dB
L = 1.31", Z = 0"
X = -0.85", Y = 25.55"
Ind. 2B: TSC, = 45°
d = +3 dB
L = 0.70", Z = 0.04"
X = -0.53", Y = 27.60"
Ind. 3A: BSC, = 45°
d = -2 dB
L = 1.31", Z = 0.02"
X = -0.67", Y = 31.18"
Ind. 3B: TSC, = 45°
d = -3 dB
L = 1.43", Z = 0.02"
X = -0.58", Y = 31.78" |
|
FG37K-TF3-BottF-FCM |
Accepted |
Rejected
Ind. 1: = 45°
L = 1.0", Z = 2.0"
X = +0.50", Y = 26" |
Rejected
Ind. 1: BSC, = 45°
d = +6 dB
L = 0.41", Z = 1.85"
X = +0.54", Y = 26.67" |
|
TP2 |
Rejected
Slags
Ind. 1:
L = 0.50", Y = 0.25"
Ind. 2: L = 0.75", Y = 3.50"
Ind. 3: L = 1.13", Y = 7.0"
Ind. 4: L = 1", Y = 10.5"
|
Rejected
Ind. 1:
d = +5 dB
L = 0.38", Z = 0.92"
X = -0.50", Y = 0"
Ind. 2:
d = +2 dB
L = 0.50", Z = 0.18"
X = +0.31", Y = 3.63"
Ind. 3:
d = -1 dB
L = 0.75", Z = 0.95"
X = -0.13", Y = 7.13"
Ind. 4:
d = +1 dB
L = 0.50", Z = 0.09"
X = -0.38", Y = 10.5"
|
Rejected
Ind. 1:
d = +4 dB
L = 0.46", Z = 0.97"
X = -0.53", Y = 0"
Ind. 2:
d = +2 dB
L = 0.88", Z = 0.01"
X = +22", Y = 3.17"
Ind. 3:
d = -3 dB
L = 1.12", Z = 0.93"
X = -0.19", Y = 7.0"
Ind. 4:
d = +1 dB
L = 0.89", Z = 0"
X = -0.30", Y = 10.19"
|
|
AWS-FCM-02-6A |
Rejected |
Rejected |
Rejected |
*Under
the provisions of table 6.3 in the AASHTO/AWS D1.5: 2002 Bridge Welding Code
(i.e., class B and class C flaws shall be separated by at least 2L), Ind.
1A, Ind. 1B, ... are considered as a single defect, Ind. 2A, Ind. 2B, ...
are considered as a single defect, etc.
1 inch = 25.4 mm
Table 11. Inspection results of the fourth field
testing at HSS.
| Specimen ID |
RT |
Manual UT |
AUT |
FBG80-TF1-BottF-FCM |
Accepted |
Accepted |
Accepted |
FG1E-TF2-TopF- FCM |
Accepted |
Accepted |
Accepted |
FG2E-TF2-TopF-FCM |
Accepted |
Accepted |
Accepted |
G11THW-CF1-BottF |
Accepted |
Not Required |
Accepted |
G11THW-CF2-BottF |
Accepted |
Not Required |
Accepted |
G7UHW-CF1-TopF |
Accepted Within Code
Ind. 1: B-C,
Indication 1.31" Right of A
(i.e., Y = 1.31")
Ind. 2: B-C,
Indication 0.5" Left of B (i.e., Y = 17.5") |
Not Required |
Accepted |
FG40M-TF1- Curved-FCM |
Accepted |
Rejected
Ind. 1: = 45°
d = +1 dB
L = 1.75", Z = 2"
X = +0.38", Y = 12"
Ind. 2: = 45°
d = +5 dB
L = 0.75", Z = 1.38"
X = +0.63", Y = 16" |
Rejected*Ind. 1A: BSC, = 45°
d = +8 dB
L = 1.29", Z = 2"
X = +0.49", Y = 10.68"
Ind. 1B: TSC, = 45°
d = +1 dB
L = 1.02", Z = 1.37"
X = +1.10", Y = 11.17" |
|
FG1A-TF2-BottF- FCM |
Rejected
Ind. 1: A-B, Slag |
Rejected |
Rejected*Ind. 1A: TSC, = 60°
d = -1 dB
L = 0.97", Z = 0.49"
X = -1.40", Y = 3.0"
Ind. 1B: TSC, = 70°
d = +6 dB
L = 1.11", Z = 0.72"
X = -1.50", Y = 3.08" |
G3VHW-CF1-BottF |
Rejected
Ind. 1: A-B,
Indication 3.25" Left of B (i.e., Y = 9.88") |
Not Required
(Accepted Within Code) |
Accepted Within Code
Ind. 1: TSC, = 70°
d = +4 dB
L = 0.66", Z = 1.52"
X = +1.46", Y = 8.76" |
G5VHW-CF1-BottF |
Rejected
Ind. 1: B-C,
0.25" Slag 1.06 From C Edge
(i.e., L = 0.25", Y = 25.19") |
Not Required
(Accepted Within Code) |
Accepted Within Code
Ind. 1: TSC, = 45°
d = +9 dB
L = 0.40", Z = 1.70"
X = +0.71", Y = 24.76" |
*Under the provisions of table 6.3 in the AASHTO/AWS D1.5: 2002 Bridge Welding Code (i.e.,
class B and class C flaws shall be separated by at least 2L), Ind. 1A,
Ind. 1B, ... are considered as a single defect, Ind. 2A, Ind. 2B, ... are
considered as a single defect, etc.
1 inch = 25.4 mm
Table 12. Inspection results of field testing at Stupp.
Specimen ID |
RT |
Manual UT |
AUT |
FS32B1&2-BottF Joint B015 |
Accepted |
Accepted |
Accepted |
FS45A1&2 Joint T019 |
Accepted |
Accepted |
Accepted |
FS46A1&2 Joint T021 |
Accepted |
Accepted |
Accepted |
FS31B1&2 Joint B011 |
Accepted Within Code |
Accepted |
Accepted |
|


