U.S. Department of Transportation
Federal Highway Administration
1200 New Jersey Avenue, SE
Washington, DC 20590
202-366-4000
Federal Highway Administration Research and Technology
Coordinating, Developing, and Delivering Highway Transportation Innovations
 |
| This report is an archived publication and may contain dated technical, contact, and link information |
|
Publication Number: FHWA-HRT-05-058
Date: October 2006 |
||||||||||||||||||||||||||||||||||||||||||||||||||||||||||||||||||||||||||||||||||||||||||||||||||||||||||||||||||||||||||||||||||||||||||||||||||||||||||||||||||||||||||||||||||||||||||||||||||||||||||||||||||||||||||||||||||||||||||||||||||||||||||||||||||||||||||||||||||||||||||||||||||||||||||||||||||||||||||||||||||||||||||||||||||||||||
Optimized Sections for High-Strength Concrete Bridge Girders--Effect of Deck Concrete StrengthCHAPTER 2. TASK 1: COST ANALYSES OF HIGH-PERFORMANCE CONCRETE IN BRIDGE DECKSRESEARCH APPROACHAnalyses to evaluate the effect of using high performance concrete in bridge decks on the cost per unit area were performed using a computer program called BRIDGE. Computer Program BRIDGEThe computer program BRIDGE was written as part of a previous investigation for the Optimized Sections for Precast, Prestressed Bridge Girders and was later revised.(6, 7) The required input of BRIDGE consists of girder span, spacing, and cross section; concrete and strand characteristics; and relative costs of materials. The program determines deck thickness and deck reinforcement, the required number of prestressing strands, and the cost index per unit surface area of bridge deck. It also provides section properties, moments, stress levels, and deflections. Comparisons are made based on relative costs for simply supported spans. A complete description of BRIDGE is given in reference 6. The following variables were used in the analyses using BRIDGE:
The complete combination of variables is defined in tables 1 and 2. It is recognized that the use of a deck concrete strength of 69 MPa (10,000 psi) in combination with a girder concrete strength of 41 MPa (6,000 psi) is unlikely to occur. However, the complete combination of variables has been included for comparison purposes.
The following default assumptions in BRIDGE were used:
It is recognized that shipping lengths, girder weights, lateral stability of girders, prestressing bed capacities that exist today, and plant capabilities to produce high-strength concretes could limit the type of girders that can be produced. However, these limitations were not used as a means to restrict potential applications. The intent of the project was to look beyond current production capabilities. The computer program BRIDGE determines cast-in-place deck thickness and reinforcement from design aids prepared by the Washington State Department of Transportation. (15) Designs aids were based on AASHTO and ACI guidelines.(16, 17) For effective slab spans less than 2.1 m (7 ft), the design aids use a slab thickness of 175 mm (7 inches). However, for this project the FHWA requested that the minimum slab thickness be increased to 190 mm (7 1/2 inches). Slab reinforcement was then determined based on the new minimum slab thickness. Results of the design are shown in table 3 with the SI equivalents provided in table 4. These data as English units were stored within BRIDGE.
* Reinforcement shown is for each of top and bottom layers.
* Reinforcement shown is for each of top and bottom layers. Relative Costs The material weight for girder concrete, deck concrete, strands, reinforcing steel, and epoxy-coated reinforcing steel is also calculated by BRIDGE. The relative cost of materials is then determined as the product of material weight and relative unit cost. The summation of the relative cost of materials is then divided by deck area to give the cost index per unit area. In the previous investigation, analyses were made to determine the effect of the premium cost for higher-strength girder concretes on the cost per unit area. (6) Based on a limited survey of industry, the ratios in table 5 were assumed for the premium cost for higher-strength concrete used in the girders.
For the current investigation, the premium costs for higher-strength concrete in the girders were assumed to be those shown as intermediate ratio. In the previous investigation, the deck concrete strength was assumed to be 28 MPa (4,000 psi) and the relative cost of the deck concrete was the same as that of the 41-MPa (6,000-psi) girder concrete. (6) To investigate the costs of using high-strength concrete in bridge decks, it was necessary to determine the relative in-place costs for different strength concretes. Analyses of the data in the previous report indicated that the cost based on materials alone for a 69-MPa (10,000-psi) concrete would be about 72 percent higher than that of a 28-MPa (4,000-psi) concrete. (6) On the assumption that the labor to deliver and place the concretes will be only slightly dependent on concrete strength, the relative premium costs of higher-strength concrete in place will be lower than these numbers. In-place costs for high-strength concrete have been published by ACI Committee 363 and these data are shown in table 6. (1)
Based on these data, it was decided to use two sets of ratios for premium costs of high-strength concrete in the decks to determine the sensitivity of the cost index per unit area to the premium costs. The selected ratios are in table 7.
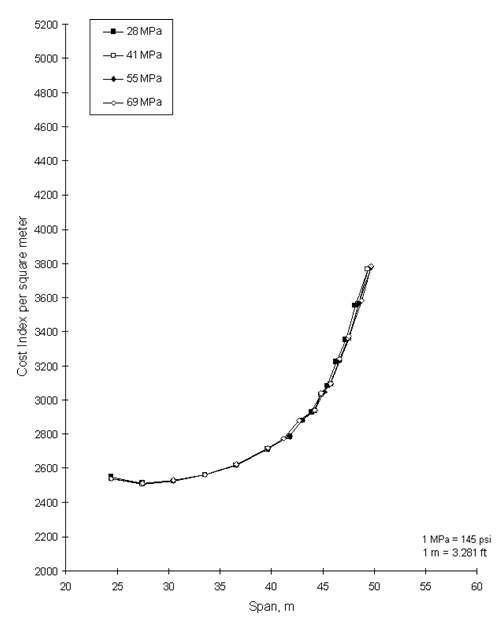
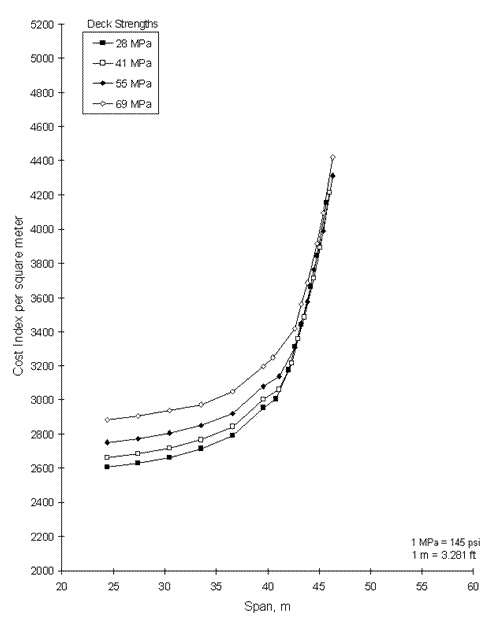
* Costs are relative to 41-MPa (6,000-psi) girder concrete. Analyses were performed for both the no premium ratio and the premium ratio. EFFECTS OF CONCRETE STRENGTH ONLYThe computer program BRIDGE determines the deck thickness and reinforcement based on a design aid prepared by the Washington State Department of Transportation. (15) The design aid is based on AASHTO and ACI guidelines and uses a concrete compressive strength at 28 days of 28 MPa (4,000 psi).(16, 17) The design aid is based on the distribution of loads and design of concrete slabs given in the AASHTO Standard Specifications for main reinforcement perpendicular to traffic. (16) Discussions with several bridge engineers indicated that many States use design aids similar to the one incorporated into BRIDGE. In the AASHTO design of concrete slabs, deck thickness and reinforcement are calculated to resist the bending moments caused by the dead load of the slab and the live load moment for the selected concentrated wheel load. In flexural design for under-reinforced sections, the concrete compressive strength has little effect on the flexural strength of the section. Consequently, the use of high-strength concrete in the deck will not impact the flexural strength of the deck. Based on this design approach, the deck thickness and the amount of reinforcement required to resist a given bending moment will not decrease as higher-strength concretes are used. Therefore, no revision was made to the design aid for use with higher-strength concretes in the decks. In addition, a minimum slab thickness of 190 mm (7.5 inches) was requested by FHWA. This controlled the deck thickness for effective span lengths up to 2.4 m (8 ft). Thus the use of higher-strength concrete in bridge decks will not reduce the thickness of the deck or the weight of the superstructure. In fact, the higher-strength concretes in the deck will slightly increase the dead load of the superstructure because of the higher density of the higher-strength concretes. The computer program BRIDGE was used to perform cost efficiency analyses for various strengths of concrete in the girders and bridge decks. A sample cost chart for a BT-72 is shown in Figure 3. The figure shows the cost index per unit surface area of the bridge deck versus span length for various girder spacings. The "optimum cost curve" is obtained where the end points of each individual cost curve are joined as shown by the dashed line in Figure 3. This optimum cost curve indicates the least cost index for a particular span and varies as a function of girder spacing (see Figure 3). As reported in previous investigations, for a given span, the cost index per unit area of a bridge deck decreases as girder spacing increases.(6,7) In all optimum cost curves used in this report, the girder spacing is allowed to vary to obtain the optimum cost. Optimum cost curves are generated for a constant girder and deck concrete strength. The cost chart in Figure 3 is for girder concrete strength at 28 days of 41 MPa (6,000 psi) and a 28-day concrete strength for the deck of 28 MPa (4,000 psi). Additional optimum cost curves can be generated for other deck concrete strengths for the same girder cross section and the same girder concrete strength. Figure 4 is a plot of the optimum cost curves for a BT-72 with a girder concrete strength of 41 MPa (6,000 psi) and deck concrete strengths of 28, 41, 55, and 69 MPa (4,000, 6,000, 8,000, and 10,000 psi, respectively). The data in figure 4 are based on the assumption that there is no cost premium for the higher-strength concrete. This figure illustrates that, at the shorter span lengths, there are no cost advantages or disadvantages in using the higher-strength concrete in the bridge deck. However, at the longer span lengths a slight advantage is achieved in a reduction in cost for the same span length. Alternatively, the ability to achieve a slightly longer span length is obtained. For the same girder cross section, these advantages occur because of the higher moment of inertia of the composite cross section that is achieved with the higher-strength concretes in the deck. In addition, the increase in the moment of inertia of the composite section will result in less live load deflection.  Figure 3. Cost chart for a BT-72, 41 MPa.
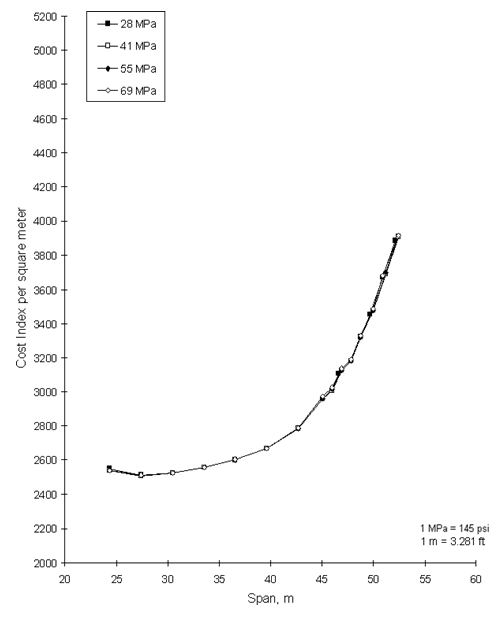
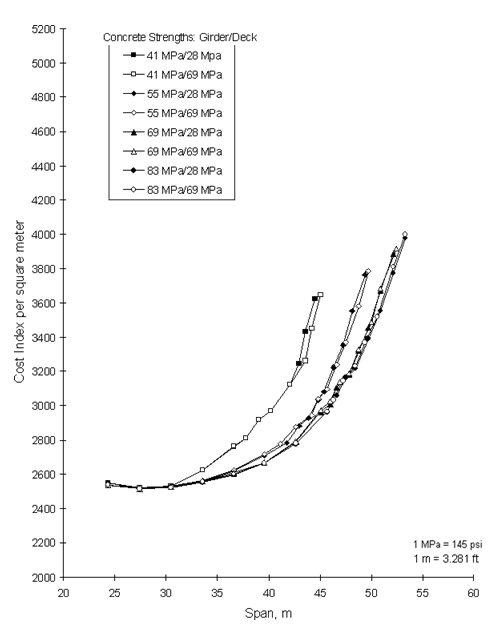
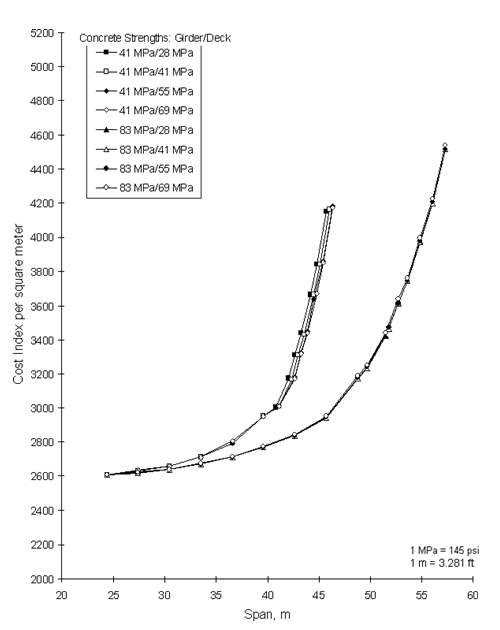
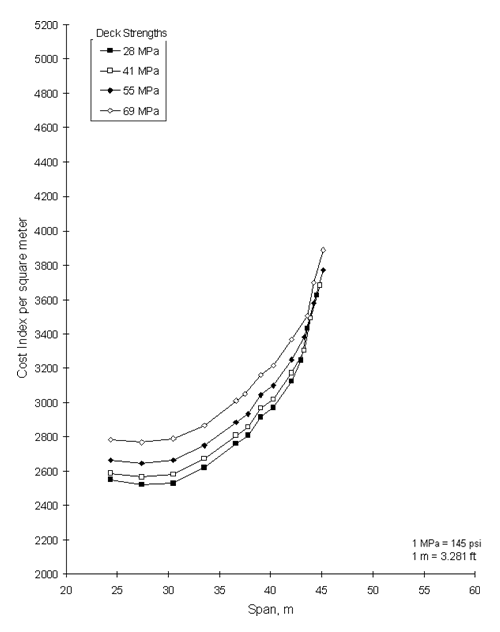
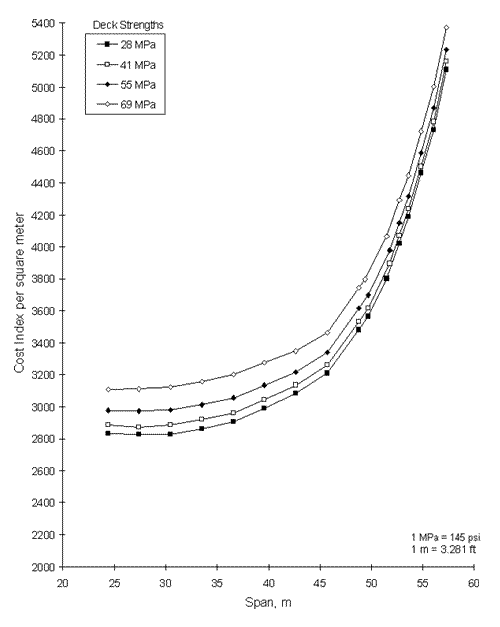
Figure 4. Optimum cost curves for a BT-72, 41 MPa. A comparison of optimum cost curves for a BT-72 girder with a girder concrete strength of 83 MPa (12,000 psi) and deck concrete strengths of 28, 41, 55, and 69 MPa (4,000, 6,000, 8,000, and 10,000 psi, respectively) and no cost premium is shown in figure 5. In this combination, there are no real cost advantages or disadvantages with the use of the higher-strength concrete in the deck. Similar data for a BT-72 girder with concrete strengths of 55 MPa (8,000 psi) and 69 MPa (10,000 psi) and no cost premium are shown in figures 6 and 7, respectively. Figure 8 shows a cost comparison for the BT-72 with girder compressive strengths of 41, 55, 69, and 83 MPa (6,000, 8,000, 10,000, and 12,000 psi, respectively) and deck concrete strengths of 28 and 69 MPa (4,000 and 10,000 psi, respectively). This figure illustrates the benefits and limitations of using higher-strength concrete with no cost premiums in precast, prestressed bridge girders. At shorter span lengths there are no benefits realized by using the higher-strength concretes. However, at longer span lengths, it is more economical to use the higher-strength concrete in the girders. The higher-strength concrete in the girders results in larger prestressing forces and, consequently, greater girder spacings for a given span length, thus reducing unit costs. These data have been confirmed in previous investigations.(6,7) For the very long span lengths, it is possible only to design for these lengths using the higher-strength concretes. Figure 8 also indicates another important point: the diminishing returns associated with the use of high-strength concrete, the primary cause of which is decreasing strand eccentricity. Once strands are placed within the web, the efficiency of the cross section begins to decrease rapidly. The incremental benefit of each succeeding strand decreases when sufficient room within the flange does not exist. Once additional prestressing force cannot be induced in the girder, the beneficial effects are limited to the increase in concrete tensile strength (which increases only as the square root of the compressive strength). (1) Optimum cost curves for a FL BT-72 with girder concrete strengths of 41 and 83 MPa (6,000 and 12,000 psi, respectively) and varying deck concrete strengths are shown in figure 9. The data represent the cost index per unit area when there is no cost premium for the higher-strength concrete. This figure shows a pattern of results similar to that shown in figure 8 for the BT-72. In a previous investigation, the FL BT-72 was found to be more cost effective than the BT-72 for span lengths greater than 46 m (150 ft). These data show the same results. EFFECTS OF CONCRETE COSTSIt is reasonable to expect the payment of a premium for the use of high-strength concrete in bridge decks. This premium results from the increased cost of materials to be used in the concrete, the inexperience of bridge contractors in placing and finishing these concretes, and the necessity of proper curing procedures. Analyses were therefore made using the cost premiums indicated in table 8.
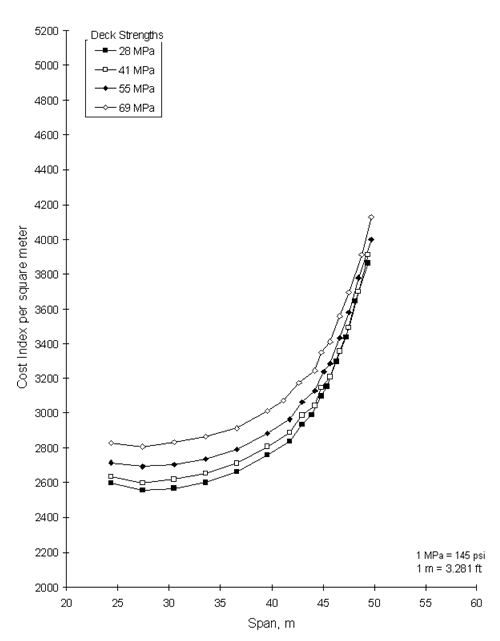
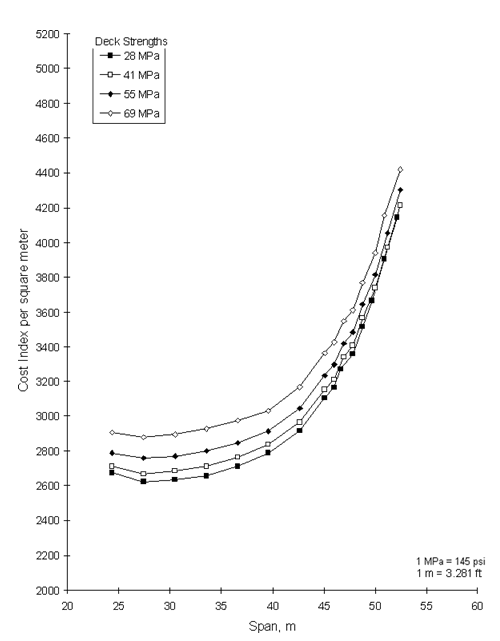
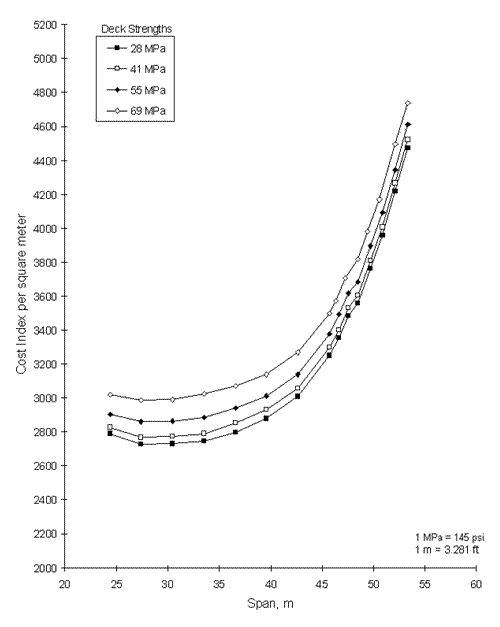
Optimum cost curves for a BT-72 with girder concrete strengths of 41, 55, 69, and 83 MPa (6,000, 8,000, 10,000, and 12,000 psi, respectively) and varying deck concrete strengths are shown in figures 10, 11, 12, and 13, respectively. Optimum cost curves for a FL BT-72 with girder concrete strength of 41 and 83 MPa (6,000 and 12,000 psi, respectively) are shown in figures 14 and 15, respectively. These figures indicate that at span lengths of 24 m (80 ft), increasing the deck concrete strength from 28 MPa to 69 MPa (4,000 to 10,000 psi) results in an increase in the cost per unit area of approximately 10 percent for both the Bulb-Tee and the Florida Bulb-Tee. At span lengths of 44.5 m (146 ft) the percentage of increase is approximately 8 percent for both strengths of girder concrete. At the maximum span lengths achievable with the BT-72 and the FL BT-72 with a girder concrete strength of 83 MPa (12,000 psi), the increase is approximately 5 percent. 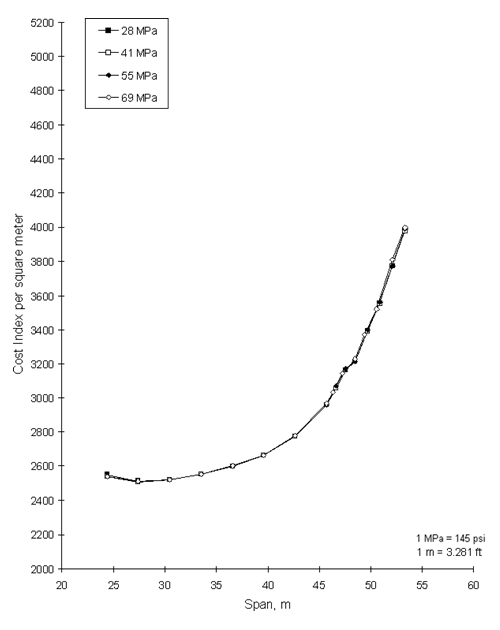 Figure 5. Optimum cost curves for a BT-72, 83 MPa. Figure 6. Optimum cost curves for a BT-72, 55 MPa.
Figure 7. Optimum cost curves for a BT-72, 69 MPa. Figure 8. Comparison of optimum cost curves for a BT-72 with varying concrete strengths.
Figure 9. Comparison of optimum cost curves for a FL BT-72 with varying concrete strengths.
Figure 10. Optimum cost curves for a BT-72, 41 MPa with cost premium.
Figure 11. Optimum cost curves for a BT-72, 55 MPa with cost premium. Figure 12. Optimum cost curves for a BT-72, 69 MPa with cost premium. Figure 13. Optimum cost curves for a BT-72, 83 MPa with cost premium. Figure 14. Optimum cost curves for a FL BT-72, 41 MPa with cost premium. Figure 15. Optimum cost curves for a FL BT-72, 83 MPa with cost premium. Consequently, it may be concluded that even if a 69-MPa (10,000‑psi) concrete has an in-place cost that is 25 percent greater than a 28-MPa (4,000-psi) concrete, the overall unit cost of the superstructure will only increase in the range of 5–10 percent. TASK 1 CONCLUSIONSThe analyses performed in task 1 considered only the initial costs. They did not take into account that high-strength concrete in the deck is also high-performance concrete and will have improved durability compared to a deck produced with a lower strength concrete. This should result in less maintenance costs and reduced life cycle costs. A life cycle cost study is beyond the scope of work of this report. Based on analyses made in task 1, the following conclusions are made:
|
||||||||||||||||||||||||||||||||||||||||||||||||||||||||||||||||||||||||||||||||||||||||||||||||||||||||||||||||||||||||||||||||||||||||||||||||||||||||||||||||||||||||||||||||||||||||||||||||||||||||||||||||||||||||||||||||||||||||||||||||||||||||||||||||||||||||||||||||||||||||||||||||||||||||||||||||||||||||||||||||||||||||||||||||||||||||