U.S. Department of Transportation
Federal Highway Administration
1200 New Jersey Avenue, SE
Washington, DC 20590
202-366-4000
Federal Highway Administration Research and Technology
Coordinating, Developing, and Delivering Highway Transportation Innovations
 |
| This report is an archived publication and may contain dated technical, contact, and link information |
|
Publication Number: FHWA-HRT-05-058
Date: October 2006 |
|||||||||||||||||||||||||||||||||||||||||||||||||||||||||||||||||||||||||||||||||||||||||||||||||||||||||||||||||||||||||||||||||||||||||||||||||||||||||||||||||||||||||||||||||||||||||||||||||||||||||||||||||||||||||||||||||||||||||||||||||||||||||||||||||||||||||||||||||||||||||||||||||||||||||||||||||||||||||||||||||||||||||||||||||||||||||||||||||||||||||||||||||||||||||||||||||||||||||||||||||||||||||||||||||||||||||||||||||||||||||||||||||||||||||||||||||||||||||||||||||||||||||||||||||||||||||||||||||||||||||||||||||||||||||||||||||||||||||||||||||||||||||||||||||||||||||||||||||||||||||||||||||||||||||||||||||||||||||||||||||||||||||||||||||||||||||||||||||||||||||||||||||||||||||||||||||||||||||||||||||||||||||||||||||||||||||||||||||||||||||||||||||||||||||||||||||||||||||||||||||||||||||||
Optimized Sections for High-Strength Concrete Bridge Girders--Effect of Deck Concrete StrengthCHAPTER 3. TASK 2: ANALYSES OF FLEXURAL STRENGTH AND DUCTILITYThe general philosophy in prestressed concrete design is that concrete members shall be designed so that the steel is yielding as ultimate capacity is approached. This is generally achieved by specifying a maximum amount of reinforcement for a given cross section. When the reinforcement exceeds the specified amount, the design-moment strength is based on the compression portion of the moment couple. In an over-reinforced section, an increase in the compressive strength of the deck concrete results in an increase in the moment capacity. It should be noted that current design requirements have been developed based on lower strength concretes. It was, therefore, deemed appropriate to investigate the flexural strength and ductility that would result when higher-strength concretes are used in bridge decks. RESEARCH APPROACHAnalyses for the effect of higher concrete strengths on the flexural strength and moment-curvature relationships were investigated using a computer program known as BEAM BUSTER. The program BEAM BUSTER performs a moment-curvature analysis of a reinforced or prestressed element using actual material properties. The program takes into account uncracked, cracked, and post-yield behavior of flexural members for a specified cross section and curvature. The program BEAM BUSTER calculates the strains and stresses that satisfy equilibrium of forces on the cross section and compatibility of strains. A cross section may be divided into many elements. A different stress–strain curve may be utilized for each element of the cross section. The stress–strain data are input as discrete data points along the complete stress–strain curve for each element specified in the cross section. Analyses were performed for the following variables:
The combination of variables selected for analysis is defined in tables 9 and 10. The combinations were selected to represent a range of girder strengths and spans.
* For consistency between tasks, the odd number of strands calculated by program BRIDGE in task 1 was retained in task 2.
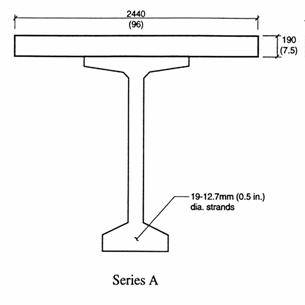
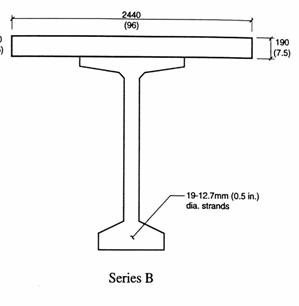
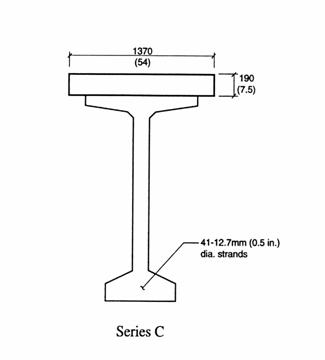
* For consistency between tasks, the odd number of strands calculated by program BRIDGE in task 1 were retained in task 2. The cross sections used in the analyses are shown in figure 16. For purposes of simplicity, the non-prestressed reinforcement in the deck was not included in the analyses. The flange width of the composite section and number of strands were based on the calculations performed by the program BRIDGE in task 1. Prior to performing the analyses, it was necessary to define the stress–strain curves for the individual constituent materials consisting of deck concrete, girder concrete, and prestressing strand.
MATERIAL PROPERTIESRequired input for the program BEAM BUSTER consists of stress–strain curves for each element analyzed in the cross section. Therefore, it was necessary to define a family of stress–strain curves for different strength concretes and to select an appropriate curve for the prestressing strand. Stress–Strain Curves for Concrete Since the calculations for ductility are very sensitive to the assumed shape of the stress–strain curves, it was necessary to establish a family of curves that realistically represent the properties of high-strength concrete. Several researchers have experimentally determined the complete stress-strain curves of concrete for strengths up to about 100 MPa (14,500 psi).(18,19) The measurements have indicated that the following occur with increasing strength:
The slope of the ascending portion of the stress–strain curve is the modulus of elasticity of the concrete. Several equations have been proposed that relate the modulus of elasticity, Ec, to the concrete compressive strength, f'c, and the unit weight of the concrete, wc, including:
Values of modulus of elasticity calculated according to the above equations are tabulated in table 11.
The ACI equation was based on an analysis for concrete strengths up to about 41 MPa (6,000 psi).(20, 23) Several investigators have indicated that the ACI equation tends to overestimate the modulus of elasticity for the higher-strength concretes.(1, 13, 19) The Martinez equation was developed as an alternative for the ACI equation and gives lower values of modulus of elasticity at the higher strength levels. (21) Some publications have indicated that the Martinez equation may underestimate the modulus of elasticity at the very high strength levels. (19) The Canadian Code equation was based on the Martinez equation with some rounding off for use in SI units and then converted back into English units. The rounding off results in slightly different calculated values. The Ahmad equation was based on a statistical analysis of data. Modulus values from the Ahmad equation lie between those of the ACI and the Martinez equations. For the present investigation, it was decided to use the ACI values for concrete strengths of 28 and 41 MPa (4,000 and 6,000 psi, respectively) and to use the values by the Ahmad equation for concrete strengths of 55, 69, and 83 MPa (8,000, 10,000, and 12,000 psi, respectively). Collins et al. have indicated that the strain at peak stress,
where
These equations were used in the present analyses to calculate the strain at peak stress from the modulus of elasticity and concrete compressive strength. Several investigators have published algebraic expressions to accurately describe the shape of the rising and descending branch of the stress-strain curve. The following expression was proposed by Popovics: (25)
where fc = stress at a strain of Thorenfeldt proposed a modification to Popovic's equation to increase the slope of the descending portion of the stress-strain curve. (26) He introduced a factor, k, to modify the equation as follows:
where k = 1 on the ascending portion of the curve, and k is greater than 1 for the descending portion of the curve. Collins has suggested the following for the descending portion of the curve.( 24)
stress–strain curves generated using the above approach are shown in figure 17.
Figure 17. stress–strain curves for concrete used in BEAM BUSTER analysis. To provide some tensile capacity to the concrete prior to cracking, the stress–strain curves developed in compression were extrapolated backwards using the following assumptions:
The stress–strain curve in compression was calculated out to a strain of 0.005. The calculated stress–strain curves were then compared with the measured curves obtained by Kaar. (18) These comparisons were made to ensure that the calculated curves showed reasonable agreement with measured data. It should also be noted that in these curves, the peak stress corresponds to the designated concrete compressive strength. In concrete column testing, it has been observed that the maximum stress obtained in the column concrete can be less than the strength measured on a standard concrete cylinder. This difference is attributed to the difference in size and shape between the reinforced concrete column and the concrete cylinder; the differences in concrete casting, vibration, and curing; and to differences in the rate of loading. In his original column research, Hognestad chose a value of 0.85 for the ratio between maximum stress in the column and concrete cylinder strength. (27) He indicated that this factor may be systematically too high or too low and may not be a constant. In tests of plain concrete columns subjected to linearly varying strain, Hognestad and Kaar deduced (separately) that the factor was close to 1.0, varying from 0.96 to 1.12.(18, 28) In design, a value of 0.85 is normally used. However, for purposes of the present analyses, a value of 1.0 was selected. stress–strain Properties of Strand An assumed stress–strain curve for strand was used in computer program BRIDGE in task 1. This curve is shown in figure 18. A slight modification to the curve was made for use in the program BEAM BUSTER. This modification is shown in figure 18.
Figure 18. stress–strain curve for prestressing strand used in BEAM BUSTER analysis. MOMENT-CURVATURE RELATIONSHIPSThe moment-curvature relationships were calculated in two parts. In the first part, the moment was applied to the noncomposite section consisting of the prestressed concrete girder only. This part of the calculation represents the moments caused by girder dead load and deck dead load, and assumes that the dead load of the deck is carried entirely by the girder prior to development of composite action. In the second part of the calculation, the moment-curvature relationship was calculated for the composite section. This calculation represents any moment applied after the deck and girder act as a composite member. To ensure compatibility between the two parts of the analyses, it was necessary to match the moment-curvature relationships at the transition point between the two parts of the calculation. This was accomplished by making an artificial adjustment in the stress-strain curves for the concrete deck. The deck was assumed to consist of three layers of concrete and a separate adjustment was made for each layer. The girder concrete was assumed to consist of one layer. For a specified input curvature, the program BEAM BUSTER calculates the corresponding moment that results in equilibrium of forces and compatibility of strains. The output consists of curvature, moment, and selected strains and stresses. If compatibility of strains or equilibrium of forces cannot be calculated for a given curvature, the calculation for that curvature is terminated after a specified number of iterations. This generally occurs after the stress-strain curve for a concrete element or prestressing strand has returned to zero strain. Moment-curvature relationships for the four series of analyses described in tables 9 and 10 are shown in figures 19 through 22. Figures 19 and 20 show the relationships for 41-MPa (6,000 psi) and 83-MPa (12,000-psi) girder strength concrete, respectively, at a span of 24.4 m (80 ft)—the minimum span length considered in this investigation. Figure 21 shows the relationship for a girder compressive strength of 41 MPa (6,000 psi) at a span of 44.5 m (146 ft)—the longest span for which a 41 MPa (6,000 psi) compressive girder can be designed. Figure 22 shows the relationship for a girder with concrete compressive strength of 83 MPa (12,000 psi) at a span of 53.3 m (175 ft)—the longest span length for which an 83 MPa (12,000 psi) girder can be designed. All of the moment-curvature relationships show a similar shape that can be divided into four parts. The first part consists of the moment-curvature relationship for the noncomposite section. This begins at a negative curvature because of the prestressing force and continues until a moment equivalent to the dead load of the deck and girder have been applied. The second part of the moment-curvature relationship consists of the moment applied to the composite section prior to cracking of the concrete. This part has a slightly steeper slope than that for the noncomposite section because of the higher stiffness of the composite section. The third part of the curve consists of the moment-curvature relationship following cracking and prior to yielding of the prestressing strand. The slope of this portion of the curve is considerably less than the curve for the uncracked section. The slope is greatest for the sections that contain the largest number of strands. The final part of the curve consists of the moment-curvature relationship following yielding of the strand. This portion of the curve is largely horizontal and generally continues until the end point of one of the stress-strain curves is reached. The moments corresponding to girder and deck dead load, girder and deck dead load and live load plus impact, and required strength are also shown on the figures. As shown in figures 19 and 20, the moment-curvature relationships for the girders containing 19 strands at a span of 24.4 m (80 ft) are not influenced by the deck concrete strength. Minor differences do occur, but at the scale shown in these figures, the differences are not discernible. The maximum moment for these sections is achieved when the prestressing strand reaches its maximum stress (which was assumed to be at a strain of 6 percent). This indicates that these cross sections will have a flexural capacity determined by fracture of the prestressing strand. These sections had a final curvature that was about 10 times the curvature when the first strands yielded. The impact of utilizing higher-strength concrete in the deck is more evident in figures 21 and 22. In the cross sections with a larger number of strands, the breaking strength of the strand is not reached prior to the flexural strength of the section being achieved.
Figure 19. Moment-curvature relationships for BT-72, 41 MPa at a span of 24.4 m.
Figure 20. Moment-curvature relationships for BT-72, 83 MPa at a span of 24.4 m. Figure 21. Moment-curvature relationships for BT-72, 41 MPa at a span of 44.5 m.
Figure 22. Moment-curvature relationships for BT-72, 83 MPa at a span of 53.3 m. For the 44.5-m (146-ft) and 53.3-m (175-ft) spans, the use of higher-strength concrete in the deck resulted in a slightly higher flexural capacity and a small increase in the final curvature. For the 44.5-m (146-ft) span girders, the final curvature was six to eight times the curvature at yield of the lower layer of strands. This indicated that the sections achieve adequate ductility even though fracture of the strand was not achieved at maximum moment. For the 53.3-m (175-ft) spans, the final curvature was about four times the curvature at yield of the lower layer of strands. This ductility is less than was obtained with the shorter span lengths but one that still corresponds to a very large deflection which would give adequate visual warning of impending failure. The strand stresses, deck strains, and girder strains at maximum moment are tabulated in tables 12 and 13. The strand stress is the stress in the lower layer of strands. The deck strain is the strain at the top surface of the deck. The girder strain is the strain at the top surface of the girder. This table shows that for series A and B, the strand stress reached the breaking strength of the strand while the maximum deck strain was 2,160 millionths, which is only slightly greater than the assumed strain at peak stress for the 28 MPa (4,000 psi) concrete. For the other strength concretes, the deck strains are less than the strains at peak stress. Also for series A and B sections, the depth of the neutral axis was less than the deck thickness so that the strain at the top of the girder was tensile and sufficient to cause cracking. This is denoted by the letter "T" in the last column of the table. Series A and B sections had a flange width of 2.44 m (96 inches), so there was sufficient concrete area to allow development of the compression force for the flexural resistance.
* T denotes tensile strain sufficient to cause cracking.
* T denotes tensile strain sufficient to cause cracking. Series C and D cross sections contained 41 and 76 strands, respectively, and had a flange width of 1.38 m (54 inches). Consequently, the demands on the deck for the development of the compressive force were much higher than in series A and B. Flexural strength of the section was limited by the strain capacity of the deck concrete for all deck concrete strength levels. For all strengths of deck concrete, the deck concrete strains at maximum moment exceeded the strains at peak stress as shown in figure 17. For the sections with 28-MPa (4,000-psi) deck concrete, the strains exceeded the normally assumed limit of 3,000 millionths (0.003 strain). To maintain the deck strains below 3,000 millionths, a concrete deck strength of at least 41 MPa (6,000 psi) is needed. It should also be noted that with one exception, all of the cross sections in series C and D have reinforcement indices that permit the flexural design to be based on yielding of the steel. The exception is the 83/28-MPa (12,000/4,000-psi) combination of girder and deck strengths. For this section, the strain in the girder is close to the strain at peak stress for the 83-MPa (12,000‑psi) girder concrete. This is a combination that should be avoided. Based on the analyses, it appears that there should be a limit on the difference between the girder concrete strengths and the deck concrete strength. However, the limited scope of this investigation does not permit the development of a rationale analysis. As an interim measure, it is proposed that the specified deck concrete strength should be at least 60 percent of the specified girder concrete strength at 28 days when the specified girder concrete strength exceeds 41 MPa (6,000 psi). FLEXURAL STRENGTHThe flexural strengths for each of the sections analyzed in task 2 are tabulated in tables 14 and 15. The required strength and design strength were calculated using the computer program BRIDGE in task 1. The required strength was based on the following equation:
The design strength was calculated through an iteration process. (17) The number in the first column of nominal strengths was based on the design strength divided by a strength reduction factor of 0.9. The second column of nominal strengths were calculated using the AASHTO provisions. (16) The calculated strengths represent the maximum moments determined by the program BEAM BUSTER and are assumed to represent the real strengths of the sections. For all sections analyzed, the design strength exceeded the required strength and the calculated strength was greater than the nominal strength calculated by two different methods. It should also be noted that the nominal strengths provided an excellent prediction of the calculated strengths. Comparisons of required strengths with calculated strengths are shown in figures 19 through 22.
* Calculated by the program BRIDGE.
* Calculated by the program BRIDGE. TASK 2 CONCLUSIONSBased on the task 2 analyses, the following conclusions are made:
|
|||||||||||||||||||||||||||||||||||||||||||||||||||||||||||||||||||||||||||||||||||||||||||||||||||||||||||||||||||||||||||||||||||||||||||||||||||||||||||||||||||||||||||||||||||||||||||||||||||||||||||||||||||||||||||||||||||||||||||||||||||||||||||||||||||||||||||||||||||||||||||||||||||||||||||||||||||||||||||||||||||||||||||||||||||||||||||||||||||||||||||||||||||||||||||||||||||||||||||||||||||||||||||||||||||||||||||||||||||||||||||||||||||||||||||||||||||||||||||||||||||||||||||||||||||||||||||||||||||||||||||||||||||||||||||||||||||||||||||||||||||||||||||||||||||||||||||||||||||||||||||||||||||||||||||||||||||||||||||||||||||||||||||||||||||||||||||||||||||||||||||||||||||||||||||||||||||||||||||||||||||||||||||||||||||||||||||||||||||||||||||||||||||||||||||||||||||||||||||||||||||||||||||