U.S. Department of Transportation
Federal Highway Administration
1200 New Jersey Avenue, SE
Washington, DC 20590
202-366-4000
Federal Highway Administration Research and Technology
Coordinating, Developing, and Delivering Highway Transportation Innovations
 |
| This report is an archived publication and may contain dated technical, contact, and link information |
|
Publication Number: FHWA-HRT-05-063
Date: May 2007 |
||||||||||||||||||||||||||||||||||||||||||||||||||||||||||||||||||||||||||||||||||||||||||||||||||||||||||||||||||||||||||||||||||||||||||||||||||||||||||||||||||||||||||||||||||||||||||||||||||||||||||||||||||||||||||||||||||||||||||||||||||||||||||||||||||||||||||||||||||||||||||||||||||||||||||||||||||||||||||||||||||||||||||||||||||||||||||||||||||||||||||||||||||||||||||||||||||||||
Evaluation of LS-DYNA Concrete Material Model 159PDF Version (6.84 MB)
PDF files can be viewed with the Acrobat® Reader® Chapter 6. Beam Drop Tower Impact SimulationsTest DataForty-seven dynamic drop tower tests were conducted on ⅓-scale beams. Drop tower tests allow for dynamic testing of simple concrete structures in a controlled, well-documented environment. Scaling was necessary to perform the tests in the indoor drop tower facility. The beams are approximate scale models of typical bridge rails or posts. All testing procedures, tests results, and data reduction are documented in Oldani.(10) Figures of the test results and testing apparatus, shown in this section, are reproduced from that reference. Three sets of beams were tested in dynamic, four-point bending: over-reinforced, under-reinforced, and plain concrete beams. Test matrices are given in Table 1-3. Calibration tests were conducted to determine the target impact kinetic energy at which the over-reinforced beams failed. Beam failure consisted of cracks running completely through the beam thickness, without pulverizing the beam. This target kinetic energy was held approximately constant throughout all tests while four combinations of impactor mass and velocity were tested. For all three types of tests, an increase in the impactor mass (with a corresponding reduction in impactor velocity) resulted in an increase in the beam deflection with deeper and wider cracks. The steel reinforcement did not break in any of the tests.
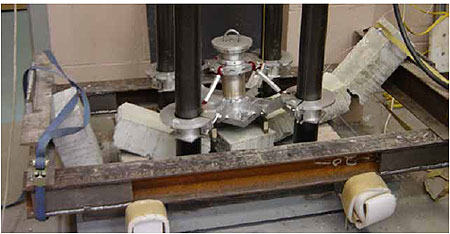
The beams tested in these drop tower tests are intended to be approximate scale models of the beams tested in the bogie impact tests discussed in the next section. The 1,524-mm- (5-ft-) long beams are impacted by two steel 32-mm (0.10-ft) diameter cylinders spaced 203 mm (0.67 ft) apart, as schematically shown in Figure 49. The beams are supported on each end with 32-mm (0.10-ft) diameter cylinders. Tie-down straps are also placed around each beam at each end to prevent the beam from bouncing off the supports.
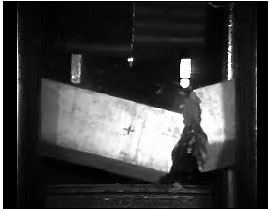
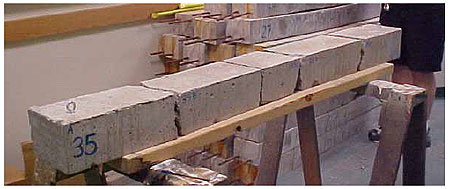
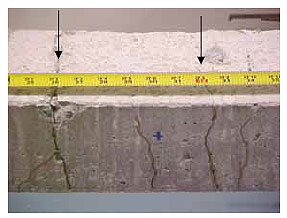
mm = 0.039 inch Figure 49. Sketch of four-point bend tests, showing dimensions in millimeters.(10) The cross section of the beam is 152.4 mm (6 inches) wide and 114.3 mm (4.5 inches) deep in the loading direction. Two bars of longitudinal reinforcement are located 76.2 mm (3 inches) apart and 92.08 mm (3.63 inches) deep from the loading face. No shear reinforcement is included. For the over-reinforced beams, the reinforcements are 9.525 mm (0.375 inches) in diameter (size #3 rebar). For the under-reinforced beams, the reinforcements are 3.2 mm (0.13 inches) in diameter (smooth cold-rolled steel rods). To provide basic material property data for the analyses, the quasi-static compressive strength of the concrete was measured via cylinder compression tests. The nominal compressive concrete strength averages about 28 MPa (4,061 lbf/inch2). The quasi-static tensile strength was measured using splitting tensile tests. The nominal tensile strength ranges from 1.82 to 2.7 MPa (264 to 392 lbf/inch2). The stress-displacement behavior of the rebar was also measured. The initial yield strength of the steel reinforcement averages about 457 MPa (66,282 lbf/inch2), with an ultimate stress of about 614 MPa (89,053 lbf/inch2). LS-DYNA SimulationsAll baseline calculations were conducted with default material properties for 28 MPa (4,061 lbf/inch2) concrete with a 10-mm (0.39-inches) aggregate. The concrete is modeled with 170 hex elements along the length of the beam and 17 by 14 elements through the cross section. The reinforcement is modeled with beam elements with common nodes with the concrete hex elements. The steel impact and support cylinders are modeled with hex elements. In some calculations, the tie-down straps are modeled with truss elements to prevent the concrete beam from bouncing off of the steel supports. The majority of calculations were conducted during development of the concrete model while it was interfaced with ls-dyna as a user-defined material. A few calculations were performed with the final version of concrete material model as mat 159. Plain BeamsMulti-element simulations of the plain concrete beams were analyzed to ensure that the concrete model accurately predicts the damage mode observed in the tests, without the complicating effects of the steel reinforcement. A total of eight tests were conducted on plain beams, with two tests for each of the four combinations of mass and velocity. Six of the eight specimens initially failed with two major cracks beneath the impactor points, as shown in Figure 50. This initial failure mode occurred for all four combinations of mass and velocity tested. The remaining two specimens initially failed with one major crack beneath one impactor point, as shown in Figure 51. This initial failure mode occurred for one test conducted at 5 m/sec, (16.4 ft/sec) and another conducted at 5.8 m/sec (19.02 ft/sec). The beams do not rebound. They eventually hit the bottom of the test fixture. The final failure mode is breakage into three to five pieces, as shown in Figures 52 and 53. Four specimens broke into five pieces, three specimens broke into four pieces, and one specimen broke into three pieces. It is not clear to the developer whether the additional breakage occurs prior to, or because of, impact with the bottom of the text fixture.
Figure 50. Six of the eight plain concrete specimens initially failed with two major cracks in the impact regime.
Figure 51. Two of the eight plain concrete specimens initially failed with one major crack in the impact regime.
Figure 52. All plain concrete specimens impact the bottom of the test fixture.
Figure 53. Four of the eight plain concrete specimens ultimately break into five pieces. Four baseline calculations were conducted, one at each of the four mass-velocity combinations. The initial damage mode simulated in all four calculations is the formation of two major cracks on the tensile face of the beam. These cracks propagate toward the impactor points on the compressive face of the beam, ultimately splitting the beam into three distinct sections. The deformed configuration with damage fringes from one simulation is shown in Figure 54. The beam does not rebound. Additional breakage occurs as the calculations progress, as shown in Figures 55 and 56. In three of the four calculations, the beam broke into five pieces. In the other calculation, conducted at 5 m/sec (16.4 ft/sec), the beam broke into four pieces. Any additional damage that may have occurred due to impact with the bottom of the test fixture was not simulated, because the bottom of the test fixture was not modeled.
Figure 54. The plain concrete beam initially breaks into three large pieces in all baseline calculations performed (shown at 12 msec for impact at 5.8 m/sec (19.0 ft/sec)).
Figure 55. The plain concrete beam ultimately breaks into five pieces in three of four calculations performed (shown at 26 msec for impact at 5.8 m/sec (19.0 ft/sec)).
Figure 56. The plain concrete beam ultimately broke into four pieces in one of four calculations performed (shown at 26 msec for impact at 5.0 m/sec (16.4 ft/sec)). Overall, there is good agreement between the computed and measured damage mode. The damage mode simulated is the primary damage model measured in the tests, i.e., the initial formation of two cracks beneath the impactor points, followed by additional breakage into five pieces. No accelerometer measurements were made for comparison with computed deflection histories. Occasionally, in preliminary calculations conducted during model development and parameter selection, the damage mode simulated was the initial formation of one crack beneath one impactor point. One preliminary result, which was conducted before completing the model and selecting default properties, is shown in Figure 57. This damage mode does not occur using the final default properties implemented for 28 MPa (4,061 lbf/inch2) concrete with 10-mm (0.4-inch) aggregate, but may be possible to obtain with user-specified properties.
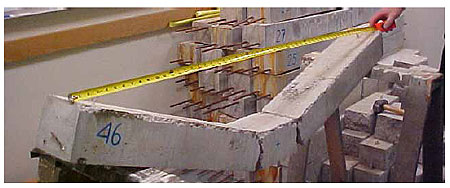
Figure 57. This preliminary calculation demonstrates the formation of one primary crack. Reinforced BeamsMulti-element simulations of the over-reinforced and under-reinforced beams were also performed with ls-dyna. Over-reinforced beams are statically designed to have the concrete crush before the steel reinforcement yields. Under-reinforced beams are statically designed to have the steel reinforcement yield before the concrete crushes. Over-reinforced beams are more brittle than under-reinforced beams; thus, each type of beam exhibits different response modes. The combined concrete and reinforcement models used in the analyses accurately simulate the different response modes. Over-reinforced beam behavior is shown in Figure 58 for the post-test beam and in Figure 59 for the LS-DYNA simulation. Upon impact, in both the test and simulation, multiple cracks primarily initiate on the tensile face of the beam and propagate towards the compressive face. A listing of the primary cracks noted in the post-test specimen is given in Figure 59. Impact damage (crushing) is also visible beneath each impactor. The beam rebounds following peak deflection.
Figure 58. The over-reinforced concrete beam has localized tensile cracks and concrete crushing in the impactor regime (test 15 conducted at 5 m/sec (16.4 ft/sec)).
Figure 59. The damage mode of the over-reinforced concrete beam at peak deflection is localized tensile cracks and concrete crushing in the impactor regime (shown at 16 msec for impact at 5 m/sec (16.4 ft/sec)).
One measured trend is that the cracks become deeper and wider with an increase in impactor mass, or correspondingly with a decrease in impactor velocity. This trend is evident in the calculations, as shown in Figure 60. This figure shows the damage from the calculation conducted at the highest impact velocity of 10.6 m/sec (34.8 ft/sec). Note that fewer damage fringes are present in the impact regime at 10.6 m/sec (34.8 ft/sec) than previously shown in Figure 59 at 5.0 m/sec (16.4 ft/sec).
Figure 60. The simulated damage fringes for impact at 10.6 m/sec (34.8 ft/sec) are less extensive than those simulated at 5.0 m/sec (16.4 ft/sec). In three sets of the over-reinforced beam tests, an accelerometer attached to the impactor measures acceleration that is integrated to produce velocity and displacement histories. The measured displacement histories are shown in Figure 61. Peak deflections attained from integration of the accelerometer readings agree with those attained from the videos to within about 5 percent accuracy. Peak deflections attained from the videos are given in Table 5. They indicate that as the impactor mass increases, the measured beam deflection increases. This trend is accurately simulated by the concrete material model. All four calculations are shown in Figure 61 for comparison with the test data. Good agreement is noted until just past peak deflection.
mm = 0.039 inch Figure 61. The measured displacement histories are accurately simulated by ls-dyna concrete material model MAT 159.
The measured and computed results previously shown in Figure 61 are not plotted past 20 msec, even though the accelerometer gage measurements continued to record past 20 msec. This happens because the deflection histories obtained from integrating the accelerometer readings begin to differ from the behavior shown in the videos once peak deflection is attained. This difference is attributed to a loss in the accelerometer's accuracy. Once peak deflection is attained, the impactor (upon which the accelerometer rests) separates from the beam. This separation greatly reduces the high amplitude, short duration acceleration experienced by the piezoelectric shock gage. Consequently, the gage is subjected only to the constant acceleration of gravity. The sensitivity of the gage is poor under constant acceleration conditions, and its response is a slow exponential decay according to the time constant of the gage. Such decay is shown in Figure 62. Here, the velocities histories are obtained by integrating the accelerometer records. This decay is not present in the computed velocity histories. These computed histories were obtained from preliminary calculations conducted during the model's development, before the default material properties were selected. This discussion indicates having redundant measurements (the videos) serves as a good check on accelerometer measurements.
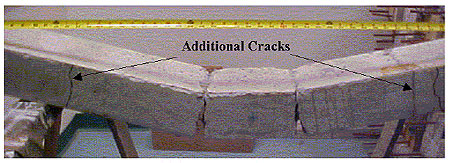
m/sec = 3.28 ft/sec Figure 62. The processed velocity histories drift once the impactor separates from the beam during rebound at about 17 msec. Under-reinforced beam behavior is shown in Figure 63 for one post-test beam specimen and in Figure 64 for the corresponding ls-dyna simulation. In both the test and simulation, two major cracks initiate on the tensile face of the beam and propagate toward the compressive face, essentially splitting the concrete into three sections. Impact damage (crushing) is also visible beneath each impactor. Little rebound occurs, although the reinforcement does not break. The behavior shown is for the test and simulation conducted at 5.2 m/sec, (17.1 ft/sec) but it is typical of most test specimens and calculations. Half of the test specimens also exhibited smaller but visible cracks originating on the top of the beam. These cracks are located approximately halfway between each impactor and each end of the beam, as shown in Figure 65 and listed in Table 6. The computed behavior previously shown in Figure 64 exhibits damage fringes, also originating on the top the beam, which are consistent with this behavior.
Figure 63. The damage mode measured for half of the under-reinforced beam specimens is two major cracks beneath the impactor points, without rebar breakage.
Figure 64. The damage mode simulated for all under-reinforced beam specimens is two major cracks beneath the impactor points, with additional damage toward the ends of the beam.
Figure 65. About half of the under-reinforced beam specimens exhibited cracks originating on the top of the specimen, and located halfway between the impactor points and ends of the beam.
No accelerometer measurements were made for the under-reinforced beams, so deflection histories are not available for plotting. However, peak deflections were extracted from the videos, as listed in Table 7. Two sets of deflections are listed. One, labeled "mid," gives the peak deflection measured at the horizontal midpoint of the beam. The other, labeled "max," gives the maximum deflection measured, which is not necessarily located at the midpoint of the beam. Although the beam is symmetric in design, the deformation doesn't remain symmetric once damage initiates. Also, the velocities listed are those used in the calculations, which differ by up to 7 percent from the actual velocities attained in the tests.
The computed deflections underestimate the measured deflections for the calculations conducted at the two lowest impact velocities of 5.2 and 6.0 m/sec (17.1 and 19.7 ft/sec). Parametric studies were conducted to determine what changes in boundary conditions, concrete properties, or rod reinforcement properties would improve the correlations. Changes in boundary conditions (strapped ends, free ends, nodal constraints on ends) and concrete properties (27 MPa to 31 MPa (3,916 to 4,496 lbf/inch2) concrete) changed the peak deflection by less than 4 percent. However, changes in the steel rod properties proved significant. For example, removing rate effects from the rod model increased the peak deflections by nearly 50 percent. Changing the material model from MAT_PIECEWISE_LINEAR_PLASTICITY to MAT_PLASTIC_KINEMATIC reduced deflections by about 5 percent. Changing the rod yield strength from 476 MPa to 620 MPa (69,038 to 89,923 lbf/inch2) reduced the deflections by about 20 percent. Hence, the controlling issue is the rod material model and its parameters. In addition, the smooth rods used in the tests are not ribbed like rebar and slide relative to the concrete. During the calibration tests, the rods slipped and did not yield. Therefore, vise grips were clamped at both ends of the exposed rods to prevent them from pulling into the concrete specimen, although some slippage still occurred during the tests. This slippage is not modeled in the finite element model. The rods in the under-reinforced specimens are modeled identical to those in the over-reinforced specimens, with common nodes between the concrete hex elements and steel beam elements. This method models a stronger bond between the concrete and reinforcement than occurs during the tests. Additional efforts to model slippage might include separating the steel beam nodes from the concrete hex nodes, then coupling the steel to the concrete via the *CONSTRAINED_LAGRANGE_IN_SOLID command with frictionless sliding. No additional efforts were made to improve correlations for the under-reinforced beams because this type of effort would focus on the smooth rod model and not the concrete model, which is the focus of this effort. The use of smooth rods in place of rebar was necessary due to scaling of the test structure. Rebar, rather than smooth rods, is used in full-scale roadside safety structures; therefore, continued efforts to improve the rod model are beyond the scope of this effort. The peak deflections measured in the under-reinforced beam tests are about five times greater than those measured in the over-reinforced beam tests. Such differences in deflection are accurately simulated by the concrete and reinforcement models, as shown Figure 66 for the tests and simulations conducted at 7.3 m/sec (24 ft/sec). In this figure, one average displacement history (solid line) for the over-reinforced beams is compared with the corresponding ls-dyna simulation (dashed line). The range in peak deflections extracted from the under-reinforced beam videos is also compared with the corresponding ls-dyna simulation.
mm = 0.039 inch Figure 66. Good displacement history and peak deflection comparisons of ls-dyna drop tower impact simulations with test data for plain and reinforced concrete beams. Summary for Drop Tower SimulationsDynamic impact testing of over-reinforced, under-reinforced, and plain concrete beams indicates that each type of beam experiences a distinct deflection history and damage mode. The concrete model simulates, with reasonable accuracy, these deflection histories and damage modes. Like the test data, the model predicts that the under-reinforced beams deflect roughly five to nine times more than the over-reinforced beams, with no rebound of the plain beams. In addition, an increase in the impactor mass results in an increased beam deflection for both sets of reinforced beams. The over-reinforced beams experience multiple but fine tensile cracks that propagate through the beam thickness, while preserving the continuity of the beam. On the other hand, the under-reinforced and plain specimens primarily failed with two large, wide cracks beneath the impactor points, which disrupt the continuity of the beam. |
||||||||||||||||||||||||||||||||||||||||||||||||||||||||||||||||||||||||||||||||||||||||||||||||||||||||||||||||||||||||||||||||||||||||||||||||||||||||||||||||||||||||||||||||||||||||||||||||||||||||||||||||||||||||||||||||||||||||||||||||||||||||||||||||||||||||||||||||||||||||||||||||||||||||||||||||||||||||||||||||||||||||||||||||||||||||||||||||||||||||||||||||||||||||||||||||||||||