U.S. Department of Transportation
Federal Highway Administration
1200 New Jersey Avenue, SE
Washington, DC 20590
202-366-4000
Federal Highway Administration Research and Technology
Coordinating, Developing, and Delivering Highway Transportation Innovations
 |
| This report is an archived publication and may contain dated technical, contact, and link information |
|
Publication Number: FHWA-HRT-05-063
Date: May 2007 |
Evaluation of LS-DYNA Concrete Material Model 159PDF Version (6.84 MB)
PDF files can be viewed with the Acrobat® Reader® Chapter 7. Beam Bogie Vehicle Impact SimulationsTest DataThree dynamic bogie vehicle impact tests were conducted on full-scale beams as part of this project. The reinforced concrete beams were simply supported and designed with longitudinal tensile reinforcement only. The bogie was setup with an impact head to produce four-point bending, as schematically shown in Figure 67. The test setup is similar to a concrete bridge rail impact, yet significantly simplified in order to isolate the concrete behavior. All tests were conducted with a 2,186.9 kilograms (kg) (0.05 lb) vehicle at speeds of 8.6, 15.9, and 33.km/h (5.3, 9.9, and 21 mi/h)). Observed damage consisted of flexural type cracks with beam rebound at low impact speed to inclined shear cracks and beam breakage (no rebound) at high impact speed. All testing procedures, tests results, and data reduction are documented in Bielenberg.(11) Figures of the test results and testing apparatus, shown in this section, are also reproduced from that reference.
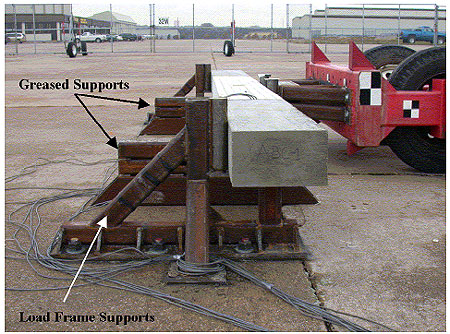
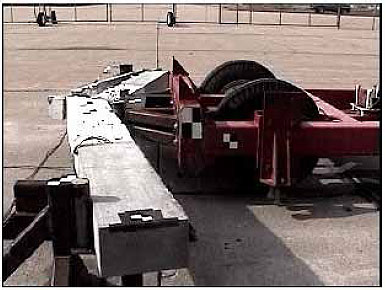
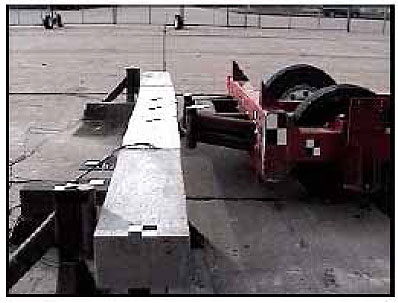
mm = 0.039 inch Figure 67. Schematic of bogie vehicle impacting reinforced concrete beam. The beam is 4,887 mm (192.4 inches) long with a rectangular cross section that is 203 mm (8 inches) wide and 343 mm (13.5 inches) deep. The distance from the beam compression face to the single row of rebar is 279 mm (11 inches). The steel reinforcement is two No. 6 rebars (19-mm (0.75-inch) diameter). The bogie head is fitted with two impact cylinders made of 76-mm (3-inch) diameter round bar stock. The beam reacts against two load frames, located near the ends of the beam, which are also fitted with 76-mm (3-inch) diameter round bar stock. The beam rests on two intermediate supports, placed between each impact cylinder and load frame. The beams are greased to reduce friction between the beam and support shelf, as shown in Figure 68. Test instrumentation included videos, high-speed film, gages, and post-test photographs. Videos of each test were taken from overhead and from the side. These videos were used to determine deflection histories in two of the three tests. High-speed film was also used to record the event and to generate high-resolution photographs for documentation. The concrete beams were instrumented with strain gages on the compressive face of the beam. Strain gages were also placed on the rebar, but were under-ranged and yielded little information. The load frames were instrumented with strain gages on the angled tube of each frame, as shown in Figure 68. The bogie was instrumented with an accelerometer near its center of mass. The accelerometer failed to trigger in one test and yielded different force history results than the load frame gages in the other two tests. Therefore, the accelerometer data were considered unusable by those who conducted the tests.
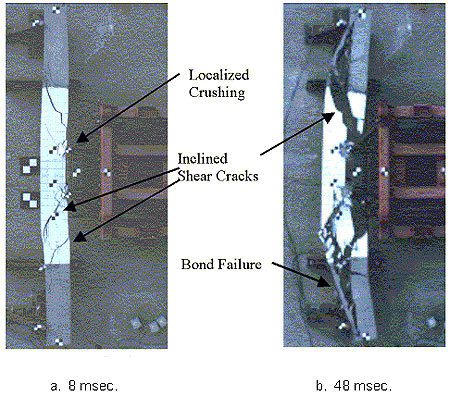
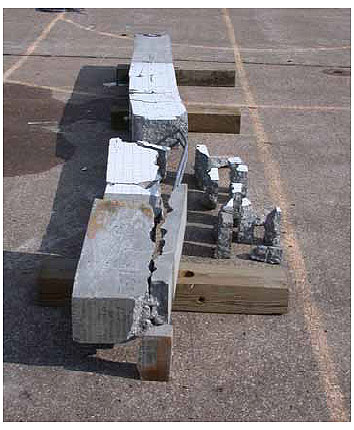
Figure 68. The beam rests on greased supports and reacts against two load frames. To provide basic material property data for the analyses, the static compressive strength of the concrete was measured via cylinder compression tests. The nominal 40-day concrete compressive strength was 46 MPa (6,672 lbf/inch2) at the time tests were conducted. The tensile strength was not measured. The static yield and ultimate strength of the No. 6 Grade 60 rebar was also measured in tension. The average initial yield strength was 462 MPa (67,007 lbf/inch2), and the ultimate strength was 721 MPa (104,572 lbf/inch2). LS-DYNA CorrelationsAll baseline calculations were conducted with default material properties for 46 MPa (6,672 lbf/inch2) concrete with 19-mm (0.75-inch) aggregate. Unless otherwise stated, erosion was set to occur at 10 percent maximum principal strain. The concrete is modeled with 192 hex elements along the length of the beam, and 15 by 9 elements through the cross section. The reinforcement is modeled with beam elements with common nodes with the concrete hex elements. The steel impact and load frame cylinders are modeled with hex elements. In the calculations conducted at 8.6 km/h (5.3 mi/h), the supports that the beam rests on are modeled as rigid planes, with low friction between the beam and planes. Unless otherwise stated, the final calculations reported here were conducted with concrete material model mat 159 implemented into ls-dyna beta version 971 revision 2582. High Velocity ImpactTwo deformed configurations for the high velocity impact test conducted at 33.1 km/h (20.5 mi/h) are shown in Figure 69. Localized crushing from the cylinder heads occurs following impact on the compression face of the beam. Four diagonal shear cracks are visible in the photograph at 8 msec. The beam has broken into four or five major fragments by 48 msec, including a large trapezoidal-shaped block that forms along two of the inclined shear cracks. Bond failure along the steel reinforcement also is evident.
Figure 69. The beam tested at an impact velocity of 33.1 km/h (20.5 mi/h) exhibits inclined shear cracks, localized crushing, and bond failure. Three deformed configurations for the high velocity impact simulation conducted at 33.1 km/h (20.5 mi/h ) with baseline properties are shown in Figure 70. The deformed configuration of the high velocity simulation is localized crushing from the impact cylinders, inclined shear cracks originating on the compression face of the beam, plus peeling away of the concrete cover from the reinforcement on the tensile face of the beam (bond failure). The beam breaks into three major pieces. This damage is similar to that previously shown in Figure 69 for the corresponding test. Additional bond failure occurs in the simulation along the tensile face of the trapezoidal block that is not evident in the test. However, such centrally located bond failure is evident in the test conducted at 15.9 km/h (9.9 mi/h).
Figure 70. Inclined shear cracks, localized crushing, and bond failure are simulated in the calculation conducted at 33 km/h (20.5 mi/h). Intermediate Velocity ImpactTwo deformed configurations for the intermediate velocity impact test conducted at 15.9 km/h (9.9 mi/h) are shown in Figures 71 and 72. The failure mode is predominantly inclined shear cracking and bond failure along the tensile reinforcement, with localized crushing beneath the impact cylinders. The failure dominates the right side of the beam. Here, one large shear crack forms at about 42 msec on the compression face and propagates at-angle toward the reinforcement on the tensile side. The crack then propagates along the tensile reinforcement, resulting in bond failure. Smaller shear cracks also form on the left side of the beam. The beam and bogie do not rebound.
Figure 71. The beam tested at an impact velocity of 15.9 km/h (9.9 mi/h) exhibits inclined shear cracks, localized crushing, and bond failure.
Figure 72. Damage dominates one side of the beam impacted at 15.9 km/h (9.9 mi/h). Three deformed configurations for the intermediate velocity impact simulation, conducted at 15.9 km/h (9.9 mi/h) with baseline properties, are shown in Figure 73. The deformed configurations exhibit slight localized damage from the impact cylinders, early time tensile damage, inclined shear damage, plus bond failure between the concrete and tensile reinforcement. Initially, tensile damage fringes and inclined shear fringes form in the vicinity of the impact cylinders (in the constant moment region), as shown at 8 msec. Additional inclined shear damage fringes form outside the constant moment region, as shown at 104 msec. Substantial bond failure is also evident at this time. The damage is similar to but less severe than that previously shown in Figure 71 for the corresponding test. One main difference between the simulation and test is that the beam rebounds at 104 msec in the simulation, but it did not rebound in the test. The second difference is that the damage is fairly symmetric from side to side in the simulation, but dominates one side of the beam in the test. The cause of the asymmetry in the test is not known.
Figure 73. Tensile damage, inclined shear damage, and bond failure are simulated in the calculation conducted at 15.9 km/h (9.9 mi/h) with erosion set to 10 percent strain. One parametric study was conducted to determine the effect of impact velocity on the computed response. The impact velocity in the calculation just discussed was increased from 15.9 km/h (9.9 mi/h) to 18 km/h (11.2 mi/h). At 18 km/h (11.2 mi/h), fracture occurs through the thickness of the beam, along with substantial bond failure, as shown in Figure 74. The beam breaks into two major pieces. The beam and bogie do not rebound. The damage is qualitatively similar to that measured in the test, although less bond failure is evident. This study suggests that 15.9 km/h (9.9 mi/h) is close to the impact velocity at which the bogie just breaks through the beam without rebound.
Figure 74. The beam breaks into two major pieces and does not rebound when impacted at 18 km/h (11.2 mi/h). Another parametric study was conducted to determine the effect of erosion on the computed response. In the baseline calculation previously discussed, erosion is set to occur at 10 percent maximum principal strain. Two additional calculations were conducted with erosion set to 5 percent and 1 percent maximum principal strain. The strain value at which erosion occurs is an option set by the user. Erosion can only occur after damage exceeds 99 percent. Damage fringes for the calculation conducted with erosion set to 5 percent strain are similar to those calculated at 10 percent strain (not shown). The peak deflection attained before rebound is 211 mm (8.3 inches), in agreement with that calculated at 10 percent strain. Damage fringes for the calculation conducted with erosion at 1 percent strain are shown in Figure 75. In this case, the erosion is more extensive than that calculated at 5 percent and 10 percent strain and breaks the beam into five major pieces. No rebound of the beam occurs. This computational comparison indicates that the erosion strain value affects the computed response, and lower erosion values tend to make the simulation more flexible. The developer has typically used 10 percent strain based on past experience. Numerous calculations throughout this report also use 5 percent strain.
Figure 75. This damage modeled at 15.9 km/h (9.9 mi/h) with erosion set to 1 percent strain is more extensive than when erosion is set to 10 percent strain. Low Velocity ImpactThree deformed configurations for the low velocity impact test conducted at 8.6 km/h (5.3 mi/h) are shown in Figures 76 and 77. Slight damage occurs beneath each impact cylinder upon contact. Cracks form on the tensile face and propagate toward the compression face. The cracks are most dominant in the impact (constant moment) region and extend about two-thirds of the way through the beam before the beam rebounds. Smaller cracks are observed outside the constant moment region. The beam reaches a maximum deflection of about 70 mm (2.8 inches) at 60 msec, then it rebounds, pushing the bogie vehicle backwards. Additional cracking occurs following rebound during reverse bending. The deformed configuration of the low velocity test is similar to that of the ⅓-scale tests of over-reinforced concrete beams shown in the previous section. This similarity is because the drop tower test beams are approximate scaled versions of the bogie vehicle test beams. These beams exhibit substantial cracking, but retain their integrity and rebound.
Figure 76. Cracks form on the tensile face of the beam impacted at 8.6 km/h (5.3 mi/h) and propagate toward the compression face. Two deformed configurations for low velocity impact simulation conducted at 8.6 km/h (5.3 mi/h) with baseline properties are shown in Figure 78. Damage fringes form on the tensile face and are most dominate in the impact region. They extend about three-quarters of the way through the beam before the beam rebounds at about 64 msec. The peak deflection is 69 mm (2.7 inches), which agrees with measurements in the tests. Substantial additional damage occurs during reverse bending following rebound.
Figure 77. The beam rebounds when impacted at 8.6 km/h (5.3 mi/h), pushing the bogie vehicle backward.
Figure 78. The simulation of the beam impacted at 8.6 km/h (5.3 mi/h) exhibits substantial damage, but retains its integrity and rebounds. Displacement HistoriesDisplacement history comparisons are shown in Figure 79 for the low and high velocity tests and simulations. Solid lines represent the data; dashed lines represent the simulations. Histories for both the beam and bogie vehicle are given at low velocity, because the vehicle separates from the beam upon rebound. The simulations accurately calculate the displacement histories through rebound. Some discrepancy exists following rebound at low velocity, in which the simulated beam and vehicle rebound more significantly than during the test. A displacement history is not shown for the intermediate velocity test because the overhead camera did not function.
mm = 0.039 inch Figure 79. The displacement histories from the ls-dyna bogie vehicle impact simulations compare well with the test data. One parametric study was conducted to determine the effect of modeling the four supports (load frame and intermediate) on the computed displacement history. Little effect is noted at high impact velocity. However, at low impact velocity, inclusion of the supports affects the rebound displacement history, as shown in Figure 80. Without modeling the supports, the beam impacted at 8.6 km/h (5.3 mi/h) rebounds, but to a greater extent than that measured in the tests. Better agreement with the tests is obtained if the supports are modeled. This agreement was accomplished by modeling the four supports as rigid planes. Dynamic relaxation was used to achieve contact between the beam and supports before impact. The computational a coefficient of friction of 0.3. Gravity was applied to the beam. Results previously shown in Figures 78 and 79 were conducted with the supports modeled.
mm = 0.039 inch Figure 80. The calculations conducted at 8.6 km/h (5.3 mi/h) correlate best with the test data if the supports are modeled. Strain HistoriesStrain histories were measured on the concrete compressive face midway along the length of the beam. One gage was placed 32 mm (1.26 inches) above the centerline, the other 32 mm (1.26 inches) below the centerline. Approximate peak values are 0.0025 and 0.0027 for test 2 at 33.1 km/h (20.6 mi/h), 0.0021 and 0.0023 for test 1 at 15.9 km/h (9.9 mi/h), and 0.0023 for test 3 at 8.6 km/h (5.3 mi/h). The three strain histories measured below the centerline are shown in Figure 81. The strain histories measured above and below the centerline are similar (not shown). The peak strain attained is similar in each test and is approximately 0.23 percent. Strain histories calculated on the compressive face of the beam, just below the centerline, are shown in Figure 82. Histories calculated above and below the centerline are similar; therefore, only one history is shown. Unlike the measured histories, the calculated histories attain different peaks in each simulation. The peak strain is lowest for the high velocity impact simulation conducted at 33.1 km/h (20.6 mi/h). It is low because the beam breaks centrally into a large trapezoidal piece, and the compressive face of this piece bends less than during pure bending.
km/h = 0.621 mi/h Figure 81. Strain histories measured on the compressive face of each beam peak around 0.23 percent strain.
km/h = 0.621 mi/h Figure 82. The strain histories from the ls-dyna bogie vehicle impact simulations vary with impact velocity. The peak strain attained for the low velocity simulation conducted at 8.6 km/h (5.3 mi/h) is approximately 0.21 percent, which is about twice that attained at high impact velocity. This beam retains its integrity during bending and then rebounds; thus, larger bending strains are calculated than at high impact velocity. The peak strain attained is similar to that measured at low impact velocity. However, the calculated strains go into tension at about 230 msec, while the measured strains remain compressive at about 0.058 percent for the duration of the recording to 468 msec. It is unclear why the measurements remain compressive once the test beam rebounds and goes into reverse flexure at about 200 msec. The peak strain attained for the intermediate velocity simulations conducted at 15.9 km/h (9.9 mi/h) is approximately 0.38 percent. In this simulation, the bending calculated between the two impact cylinder locations is significant, while little bending occurs between each impact cylinder and edge of the beam. The strains become tensile once the beam rebounds. These comparisons demonstrate how difficult it is to correlate strain measurements, even when good correlations are obtained for deformed configurations and deflections. The difficulty lies in the fact that strain histories are local behaviors that can vary significantly from position to position along the beam. Summary for Impact SimulationsThe response of the three beams tested depends on the impact velocity. The computational model accurately simulates the substantially different displacement histories and damage modes measured between high (33.1 km/h (20.6 mi/h) and low (8.6 km/h (5.3 mi/h)) velocity impact. At high velocity impact, damage is dominated by inclined shear cracks, and the beam breaks into several large pieces without rebounding. At low velocity impact, tensile cracks form, but the beam retains its integrity and rebounds. At intermediate velocity (15 km/h (9.3 mi/h)), a combination of bending and shear was observed in the test. The beam ultimately failed on one side without rebounding due to large tensile and shear cracks. The simulation exhibited a more symmetric behavior with a combination of bending and shear cracks, but ultimately rebounded. However, the computed damage becomes similar to the measured damage, without rebound, if the impact velocity is increased from 15.9 km/h (9.9 mi/h) to 18 km/h (11.2 mi/h). This suggests that the 15.9 km/h (9.9 mi/h) impact velocity tested is close to the velocity needed to transition from rebound to breakthrough. An additional parametric study indicates that reducing erosion strain from 5 percent to 1 percent also improves correlations by transitioning the simulation results from rebound to breakthrough. |