U.S. Department of Transportation
Federal Highway Administration
1200 New Jersey Avenue, SE
Washington, DC 20590
202-366-4000
Federal Highway Administration Research and Technology
Coordinating, Developing, and Delivering Highway Transportation Innovations
 |
| This report is an archived publication and may contain dated technical, contact, and link information |
|
Publication Number: FHWA-HRT-05-063
Date: May 2007 |
Evaluation of LS-DYNA Concrete Material Model 159PDF Version (6.84 MB)
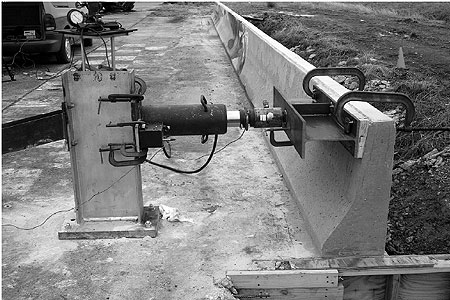
PDF files can be viewed with the Acrobat® Reader® Chapter 9. Analyses of Safety-Shaped BarrierThe user conducted static and dynamic tests on a Florida safety-shape barrier with New Jersey profile.(8) The tests were conducted prior to, and separate from, this effort. Test data available for this barrier include quasi-static load tests to failure at both the end and middle of the parapet. The initial test case selected for evaluating the barrier model was a quasi-static load test to failure on the end of the parapet section (TTI test 421323-S1). Test S1 was performed on the upstream end of the test installation and was intended to represent loading at the barrier ends or at an interior bridge expansion joint. The test setup is shown in Figure 132. The load was applied using a hydraulic cylinder with an inline load cell. The hydraulic cylinder was attached to a fabricated steel frame that was bolted to the concrete deck structure. A steel wide flange beam stiffened with welded gussets was clamped to the face of the parapet to distribute the applied load over a distance of 1,219 mm (48 inches) A tapered wood block was placed between the back flange of the beam and the sloped face of the concrete parapet to permit horizontal application of the load. The steel beam was mounted to the parapet with the top edges of the flanges flush with the top surface of the parapet. The hydraulic cylinder applied the load to the middle of the steel beam. Displacement of the barrier was measured using a string pot.
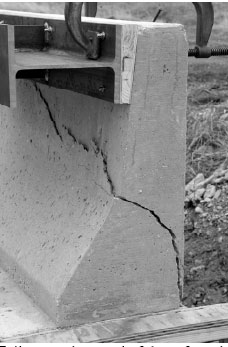
Figure 132. Test setup for static load tests on safety-shaped barriers. The maximum load attained in test S1 was 156 kN (35.1 kips). The resulting failure mode and force-deflection curve are shown in Figures 133 and 134. The load capacity calculated from a yield line analysis was 185 kN (41.6 kips). Subsequent destructive inspection of the test installation showed the last stirrup was spaced approximately 152 mm (6 inches) from the end of the parapet wall rather than 50.8 mm (2 inches) and likely contributed to the lower than expected fracture load.
Figure 133. Failure mode at end of the safety-shaped barrier.
Figure 134. Measured load versus displacement for the safety-shaped barrier. Finite Element ModelA finite element model of a steel-reinforced concrete safety-shape bridge rail with New Jersey profile was developed by the user. The model conformed to details and specifications of a rail that was once a standard of the Florida Department of Transportation (FDOT) (FDOT Sheet Index No. I‑799). The 813-mm- (32-inch-) tall barrier is 152 mm (6 inches) at the top and 382 mm (15 inches) at its base. The barrier was cast atop a 178-mm- (7-inch-) thick reinforced concrete bridge deck cantilevered off of a concrete beam. The concrete used in the bridge rail parapet had a maximum aggregate size of 25.4 mm (1 inch) and an average compressive strength of 24.9 MPa (3,611 lbf/inch2). The bridge deck concrete had a maximum aggregate size of 25.4 mm (1 inch) and an average compressive strength of 27.1 MPa (3,931 lbf/inch2). Dimensions of the barrier system and steel reinforcement details are shown in Figure 135. A modeling approach similar to that used for the Texas T4 bridge rail was followed for the New Jersey safety-shape rail system. The concrete parapet and bridge deck were modeled using solid elements. Beam elements were used to model the steel reinforcement inside the parapet and bridge deck. The element formulation used for the steel reinforcement was the Hughes-Liu beam element with cross section integration (type 1). The concrete brick elements were type 1 (underintegrated) with stiffness form of hourglass control (type 5) specified. The short input format for the new concrete material model was used to generate the values for the parameters required in the long input format, and these established the baseline input values for the Florida safety-shaped barrier model.(8) The steel reinforcement was coupled to the surrounding concrete using the *CONSTRAINED_LAGRANGE_IN_SOLID feature in LS-DYNA. Figure 136 shows the meshing for the parapet and the deck and the layout of steel reinforcement in both. Figure 137 shows the overall steel reinforcement layout in the model. The steel reinforcement in the parapet model was revised to reflect the actual construction details of the stirrups, which were 152.4 mm (6 inches) from the end. A simple surrogate impactor was modeled to represent the hydraulic cylinder. The wood block was modeled to account for any compliance associated with the load transfer to the parapet. Figure 138 illustrates the load application setup with respect to the bridge rail model. The impactor was forced to follow a displacement-time curve that simulated the quasi-static loading condition. The long duration of the test is problematic to reproduce in an explicit analysis procedure. Therefore, the solution must take into account effects. In the analysis, the duration of the simulation was 0.150 sec, which is a fraction of the actual test duration.
mm = 0.039 inch Figure 135. Cross section of the Florida safety-shaped barrier with New Jersey profile.(8)
Figure 136. Cross section of Florida barrier model concrete mesh and reinforcement layout.
Figure 137. Isometric view of steel reinforcement in Florida barrier model.
Figure 138. Model of quasi-static load test setup. User Evaluation ResultsAs shown in Figure 139, simulation results using the preliminary baseline concrete material properties indicate fracture damage (i.e., element erosion) along the cold construction joint between the parapet and the deck, at the transition between the toe of the barrier and parapet wall, and on the edge of the parapet wall just below the impactor. Additional analyses were conducted using 80 percent and 27.5 percent of the baseline fracture energies without significant change in the fracture profile. Due to time and resource constraints, the user could not perform additional investigation of this barrier system. The user suggested that the following actions should be undertaken: changing the contact definition at the cold construction joint between the parapet and the deck, adjusting the impactor interaction with the parapet, and studying the sensitivity of the system to the rate effect parameters in the concrete model. The developer followed up on some of these suggestions, and evaluations of these activities are provided in the following section.
Figure 139. Fracture profile of Florida safety-shaped barrier. Developer Baseline CalculationsThe developer began the calculations using the mesh setup by the user, as previously shown in Figure 138, but made a few adjustments. All concrete material properties were adjusted to default properties, except the shear fracture energy was set to Gfs = ½ Gf t instead of Gfs = Gf t. This reduced fracture energy was used in shear because it proved appropriate in some of the bridge rail analyses discussed in appendix B. Unless otherwise specified, each calculation was conducted with erosion occurring at 99 percent damage with a maximum principal strain of 5 percent (ERODE = 1.05). A joint exists between the deck and parapet that is much weaker than solid concrete. This joint interface was adjusted from *CONTACT_TIED_NODES_TO_SURFACE to *CONTACT_NODES_TO_SURFACE, to allow separation in tension. Rate effects were turned from on to off in the concrete model. Turning rate effects off allowed the quasi-static simulations to run at a higher rate than the quasi-static test. Performing this step is typical and necessary. The turnaround time of the calculations would be extremely long (days) if the calculations were run at the same slow rate as the tests. As previously mentioned, the quasi-static load was generated using lateral displacements applied directly to all nodes of the steel spreader plate (modeled as rigid shell elements connected to the timber hex elements). The applied displacements increase linearly from 0 to 38.1 mm (0 to 1.5 inches) over 150 msec, as setup by the user. This increase is slow enough to eliminate wave propagation effects. Damage fringes at about 70 msec are shown in Figure 140. At this time, the parapet has displaced laterally about 16 mm (0.63 inches). Three regions of high damage are noted. First, parapet damage extends from the front at midlevel to the back at deck level, similar to that observed in the post-test photograph. A large inclined shear crack also extends from midlevel upward to the top of the parapet. Finally, concentrated damage is also noted where the lower edge of the timber contacts the parapet. This concentrated damage is not observed in the post-test photograph. Close examination of the computed results indicates that the timber is not remaining in complete contact with the parapet, also shown in Figure 140. The contact is concentrated at the bottom of the timber spreader, resulting in a stress concentration in the concrete at the point of this contact. This concentration may not be realistic. The developer thinks that complete contact likely occurred during the tests due to the presence of the clamps, or slight deformation of the timber, as previously shown in Figure 133. The timber is modeled as elastic using material model 1 with a modulus of 247 MPa (35,824 lbf/inch2).
Figure 140. A damage concentration is simulated in the parapet due to application of the steel/timber spreader plate that is not observed in the post-test parapet. Therefore, a second calculation was performed with the timber modeled as a plastically deformable, damageable material using wood model 143. Properties selected are defaults for saturated Grade 1 pine at room temperature. The modulus in the loading direction is 247 MPa (35,824 lbf/inch2), which is the same as that used in the elastic timber model of the previous calculation. Damage fringes are shown in Figure 141 at 16.5 mm (0.65 inches) and 38.1 mm (1.5 inches) of lateral deflection. Switching the timber model from elastic to elastoplastic with damage relieves the stress concentration previously calculated at the lower edge of the spreader beam. However, a gap between the beam and parapet is still noted, and late-time unexpected damage occurs near the base of the parapet that is not evident in the test. In addition, the peak force attained in the calculation is 282 kN (63.4 kips), which is 81 percent higher than the 156 kN (35.1) measured during the test.
mm = 0.039 inch Figure 141. The damage concentration is relieved if the timber is realistically modeled as an elastoplastic damaging material. Finally, two additional calculations were conducted in an attempt to retain contact between spreader beam and parapet and to reduce the computed peak force. Figure 142 is an example of how the finite element model was enhanced to include a single rigid element representing the load application face of the hydraulic ram. The quasi-static load is generated using a lateral displacement history applied directly to the nodes of the ram element, rather than the steel spreader beam. A contact surface (contact_nodes_to_surface) separates the ram element from the spreader beam elements that allows for separation but not penetration. In this way, the spreader beam can rotate slightly relative to the ram element and retain contact with the parapet during displacement.
mm = 0.039 inch Figure 142. A realistic damage and erosion pattern is simulated if the timber remains in contact with the parapet (ERODE = 1.05). Damage fringes for one calculation are shown in Figure 142 at 20 mm (0.8 inches) of lateral deflection. Rate effects were also removed from the steel reinforcement. This calculation was conducted with erosion occurring at 99 percent damage with a maximum principal strain of 5 percent, like all previously discussed calculations (ERODE = 1.05). The pattern of erosion and damage is consistent with that observed in the test, as previously shown in Figure 133. The peak force attained in this calculation is 183 kN (41.1 kips) at 31 mm (1.2 inches) deflection, which is consistent with the 185 kN (41.6 kips) force the user expected to measure, but is 17 percent higher than the force actually measured. Damage fringes for the second calculation are shown in Figure 143 at 10 mm and in Figure 144 at 20 mm (0.8 inches) of lateral deflection. This calculation was conducted with erosion occurring at 99 percent damage, regardless of maximum principal strain value (ERODE = 1.0). The peak force is measured at approximately 10 mm (0.4 inches) of deflection. The final measurement before loss of strength is made at approximately 20 mm (0.8 inches) of deflection. Two views are shown-with and without the visible mesh-to better view the erosion. In this case, the damage pattern is less diffuse, and the erosion pattern is much more prominent, than calculated with ERODE = 1.05. Again, the calculated erosion and damage pattern in the parapet is consistent with the post-test cracking pattern previously shown in Figure 133. However, additional erosion occurs in the deck that is not visible in post-test photo. The developer thinks erosion occurs because the deck section modeled is not nearly as long as the actual test section, due to the need to retain a reasonable run time with a reasonable number of elements. Hence, the cantilever-type bending of the short deck produces tensile stresses in the concrete that are higher than those that would be produced in a longer deck. The peak force attained in this calculation is 181 kN (40.1 kips) at 31 mm (1.2 inches), which is within 16 percent of the measured value. The calculated force versus deflection history is shown in Figure 145. It is in good agreement with that previously shown in Figure 134 for the first12 mm (0.5 inches) of deflection. However, the peak force continues to increase beyond 12 mm (0.5 inches) to a higher force, and with more ductile behavior, than measured. The computed force remains fairly constant (or increases slightly) with increasing deflection beyond 31 mm (1.2 inches), while the measured force decreases in magnitude. It is not clear, at least to the developer, why the measured force drops down to near 0 even though the steel reinforcement remains intact.
mm = 0.039 inch Figure 143. The primary erosion agrees with the measured crack pattern if the timber remains in contact with the parapet (ERODE = 1.0).
mm = 0.039 inch Figure 144. The primary erosion agrees with the measured crack pattern if the timber remains in contact with the parapet (ERODE = 1.0).
mm = 0.039 inch, kN = 225 lbf Figure 145. The calculated force versus deflection history is in reasonable agreement with the measured curve for the first 12 mm (0.5 inches) of deflection. Developer Applied Force CalculationsOne alternative method of simulating the barrier test is to simplify the geometric model and loading conditions. Simplified loading conditions are often used as a first step in performing a finite element analysis and are quite often sufficient. The timber remains in contact with the parapet during the test; thus, the timber applies lateral force to the parapet over the entire contact region. Therefore, concentrated lateral forces are directly applied to the nodes of the parapet over the timber-to-parapet contact region. The total load applied increases nonlinearly from 0 to 156 kN (0 to 35.1 kips) in 40 msec, remains at 156 kN (35.1 kips) until 50 msec, then drops to 18 kN (4.0 kips) by 260 msec. The steel/timber spreader plate is completely removed from the finite element model. Damage fringes are shown in Figure 146 for two calculations conducted with different erosion values. One force-displacement history is shown in Figure 147. The damage simulated extends from the front at midlevel to the back at deck level. Inclined shear damage lines are also present. The computed damage is similar to the damage observed in the post-test photograph. It is also similar to that calculated and previously shown in Figure 144 where the timber remains in contact with the parapet. As desired, concentrated damage in the loading regime is not simulated. Nor is unexpected damage near the base of the parapet.
Figure 146. The computed damage mode is similar to that measured if the load is applied via concentrated nodal point forces (at 11- to 12-mm (0.43- to 0.5-inch) deflection).
mm = 0.039 inch, kN = 225 lbf Figure 147. The computed force versus displacement unloads, when the load is applied via concentrated nodal point forces (ERODE = 1.05). Approximately 11 mm (0.43 inches) to 12 mm (0.5 inches) of parapet displacement are computed at the center of the loading region when the applied load is 156 kN (35.1 kips), in good agreement with the measured displacement previously shown in Figure 134. However, once the applied force begins to drop at 50 msec, the barrier displacement begins to decrease, which is not realistic. The drawback of this calculation is that the force history is applied and its magnitude is assumed equal to that measured (the timing of the application is not available). Summary for Safety-Shaped Barrier CalculationsThe application of the load in the static test of the safety-shaped barrier proved critical to accurate modeling of the damage mode. The simplest calculation conducted using concentrated nodal forces applied directly to the parapet provides good correlations with the measured damage mode and with the force versus displacement history to peak strength. However, the drawback of this calculation is that the applied force history is assumed, not predicted. The best correlations are obtained when the timber plate is free to adjust orientation in order to maintain good contact between the timber and concrete. This situation was accomplished by representing the load application face of the hydraulic ram as a single rigid element, with flexibility between this element and the timber/spreader plate. If the timber is restrained from adjusting orientation, then a gap forms between the timber and concrete, which produces undesirable damage concentrations in the concrete. The main difference between this calculation and the measured results is that the computed force attained agrees with the pretest estimated value of 185 kN (41.6 kips), but is higher than the measured value of 156 kN (35.1 kips). All safety-shaped barrier calculations conducted focused on applying the load correctly, setting the proper contact surface conditions at the joint between the parapet and deck, and in turning off rate effects to better simulate quasi-static behavior. No parametric studies were conducted related to the concrete model or its properties. All calculations used default properties for the concrete except for setting Gfs = ½Gft. This reduced shear modulus was used because the Texas T4 bridge rail simulations indicate that a reduced shear modulus may be appropriate. Ultimately, a reasonable damage mode was predicted using these reduced properties and appropriate load and boundary conditions. This series of calculations demonstrates that well-defined load and boundary conditions are essential when analyzing tests for material model evaluation. Otherwise, a good portion of the effort may be spent refining the load and boundary conditions, rather than evaluating the material model. However, tests such as the safety-shaped barrier just analyzed often are conducted for purposes other than material model evaluation. Financial and time constraints require that published and available test data are used. The analyst must be prepared to critically review all aspects of the geometric and material models being used in the simulation and not just inspect the particular material model under evaluation. |