U.S. Department of Transportation
Federal Highway Administration
1200 New Jersey Avenue, SE
Washington, DC 20590
202-366-4000
Federal Highway Administration Research and Technology
Coordinating, Developing, and Delivering Highway Transportation Innovations
 |
| This report is an archived publication and may contain dated technical, contact, and link information |
|
Publication Number: FHWA-HRT-07-024
Date: February 2007 |
|||
Flexural Capacity of Fire-Damaged Prestressed Concrete Box BeamsCHAPTER 4. Box Beam Flexure Testing
4.1 IntroductionFour 0.64 m (25 inch) deep box beams were loaded in four-point bending to determine their flexural behavior. Beams 3, 4, 7, and 14 were loaded under identical conditions in order to capture any deviations in behavior exhibited by the beams. The results of these tests are described below. 4.2 Test ProcedureThe tests were conducted to determine the static flexural capacity of the four beams. Recall that all beams were loaded on a 14.1-m (46-ft 4-inch) span with two point loads applied 0.91 m (3 ft) on either side of midspan. Initially, the applied load was increased in 3-kip increments. After flexural cracking was observed in the bottom flange, the loading increment was revised to instead focus on midspan vertical displacement increments. The displacement was incremented by 2.5 mm (0.1 inch) thereafter until flexural failure of the beam. During the test, the incremental increase of applied load and midspan deflection was periodically halted to allow for the capture of the residual flexural stiffness of the beam. The capture of the residual stiffness was completed at least four times for each beam, occurring at applied load levels of approximately 178, 289, 356, and 400 kN (40, 65, 80, and 90 kips). In general, this process included releasing the load to 80 percent of the peak load previously achieved and then reloading the beam in approximately 10 kN (2.2 kip) increments back to the peak load. During the test, the loading was also periodically halted to map the flexural cracking apparent on the north and south faces of each beam. Cracks apparent prior to the start of the test, whether due to stresses imparted during handling and transportation of the beams at the bridge site or due to other forces, were marked prior to the start of the test. 4.3 BeamThe flexural behavior of Beam 3 was captured through the implementation of the test procedure described above. Figure 8 shows the total applied load versus midspan vertical deflection plot. As is shown on this figure, the beam behaved in an elastic manner until approximately 245 kN (55 kips) of load was applied. This corresponds to an applied moment of 751 kN-m (554 kip-ft). The beam then exhibited decreasing flexural stiffness as the load increased up to 463 kN (104 kips). Flexural failure of the beam occurred at this load when the midspan deflection was 343 mm (13.5 inches). This applied load corresponds to an applied moment of 1,421 kN-m (1,048 kip-ft). Figure 9 shows the deflected shape of the beam at incrementally higher load levels throughout the test.
Figure 8. Graph. Applied load versus midspan vertical deflection for Beam 3.
Figure 9. Graph. Deflected shapf of Beam 3. Figure 10 plots the midspan neutral axis depth from the top of the beam versus the load applied to the beam. The neutral axis depth is calculated for each face of the beam based on the operational strain gages providing reliable readings at a given load level. The neutral axis depths from each face were then averaged to determine the depth plotted in the figure. As would be expected, after the beam began exhibiting inelastic behaviors (i.e., concrete cracking), the neutral axis began to rise.
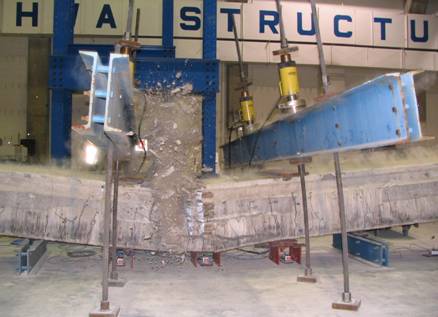
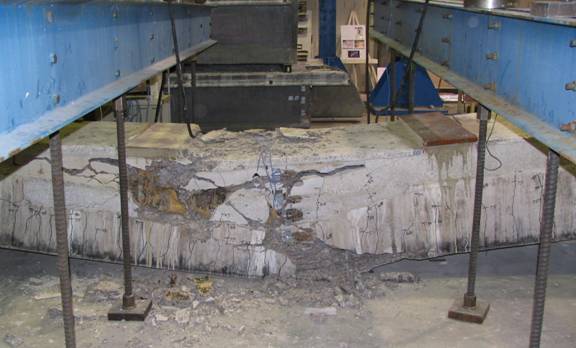
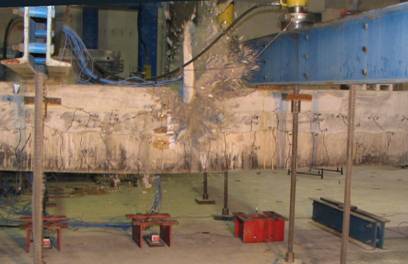
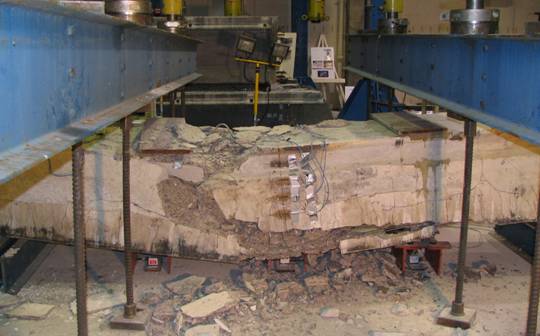
Figure 10. Graph. Midspan neutral axis depth from top of the Beam 3. The failure of this beam, although preceded by significant tensile cracking of the bottom flange and a significant rise in the neutral axis, was caused by a compression failure of the concrete in the top flange. Figure 11 provides a photograph showing the sudden nature of the final failure. No spalling of concrete or rupturing of strands occurred prior to the compression failure of the top flange. 4.4 Beam 4Beam 4 was tested in a similar fashion to Beam 3, described above. Figure 12 shows the total applied load versus midspan vertical deflection plot. As is shown on this figure, the beam behaved in an elastic manner until approximately 245 kN (55 kips) of load was applied. This corresponds to an applied moment of 751 kN-m (554 kip-ft). The beam then exhibited decreasing flexural stiffness as the load increased up to 458 kN (103 kips). Flexural failure of the beam occurred at this load when the midspan deflection was 284 mm (11.2 inches). This applied load corresponds to an applied moment of 1,407 kN-m (1,038 kip-ft). Figure 13 shows the deflected shape of the beam at incrementally higher load levels throughout the test. Figure 14 plots the midspan neutral axis depth from the top of the beam versus the load applied to the beam. As with Beam 3, after the beam began exhibiting inelastic behaviors (i.e., concrete cracking), the neutral axis began to rise.
Figure 11. Photo. Failure of Beam 3.
Figure 12. Graph. Applied load versus midspan vertical deflection for Beam 4.
Figure 13. Graph. Deflected shape of Beam 4.
Figure 14. Graph. Midspan neutral axis depth from top of Beam 4. Figure 15 provides a photo of the deflected shape of the beam at the maximum applied load. Clearly, this beam exhibited significant deflection capacity prior to failure. The failure of this beam, although preceded by significant tensile cracking of the bottom flange and a significant rise in the neutral axis, occurred in a brittle manner, likely as a result of the compression failure of the concrete. Figure 16 provides a photograph of the beam just after failure. No spalling of concrete or rupturing of strands occurred prior to failure of the beam.
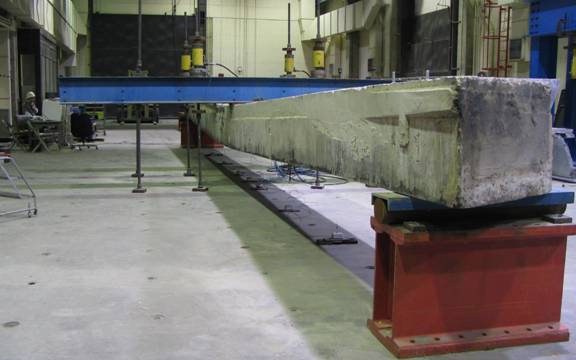
Figure 15. Photo. Deflection of Beam 4 at maximum applied load. 4.5 Beam 7Beam 7 was tested in a similar fashion to Beams 3 and 4, described above. Figure 17 shows the total applied load versus midspan vertical deflection plot. As is shown on this figure, the beam behaved in an elastic manner until approximately 223 kN (50 kips) of load was applied. This corresponds to an applied moment of 681 kN-m (503 kip-ft). The beam then exhibited decreasing flexural stiffness as the load increased up to 445 kN (100 kips). Flexural failure of the beam occurred at this load when the midspan deflection was 236 mm (9.3 inches). This applied load corresponds to an applied moment of 1,362 kN-m (1,005 kip-ft). Figure 18 shows the deflected shape of the beam at incrementally higher load levels throughout the test. Figure 19 plots the midspan neutral axis depth from the top of the beam versus the load applied to the beam. As with Beams 3 and 4, after the beam began exhibiting inelastic behaviors (i.e., concrete cracking), the neutral axis exhibited a marked decrease in depth from the top flange. The failure of this beam, although preceded by significant tensile cracking of the bottom flange and a significant rise in the neutral axis, occurred in a brittle manner as a result of the compression failure of the concrete. Figure 20 provides a photograph captured during failure of the beam. No spalling of concrete or rupturing of strands occurred prior to failure of the beam.
Figure 16. Photo. Failed Beam 4.
Figure 17. Graph. Applied load versus midspan vertical deflection for Beam 7.
Figure 18. Graph. Deflected shape of Beam 7.
Figure 19. Graph. Midspan neutral axis depth from top of Beam 7.
Figure 20. Photo. Failure of Beam 7. 4.6 Beam 14Beam 14 was tested in a similar fashion to the previously discussed beams. Figure 21 shows the total applied load versus midspan vertical deflection plot. As is shown on this figure, the beam behaved in an elastic manner until approximately 223 kN (50 kips) of load was applied. This corresponds to an applied moment of 681 kN-m (503 kip-ft). The beam then exhibited decreasing flexural stiffness as the load increased up to 423 kN (95 kips). Flexural failure of the beam occurred at this load when the midspan deflection was 236 mm (9.3 inches). This applied load corresponds to an applied moment of 1,301 kN-m (960 kip-ft). Figure 22 shows the deflected shape of the beam at incrementally higher load levels throughout the test. Figure 23 plots the midspan neutral axis depth from the top of the beam versus the load applied to the beam. As with the previously discussed beam tests, after the beam began exhibiting inelastic behaviors (i.e., concrete cracking), the neutral axis exhibited a marked decrease in depth from the top flange. The failure of this beam, although preceded by significant tensile cracking of the bottom flange and a significant rise in the neutral axis, occurred in a brittle manner likely as a result of compression failure of the concrete in the top flange. Figure 24 provides a photograph captured just after failure of the beam. No spalling of concrete or rupturing of strands occurred prior to failure of the beam.
Figure 21. Graph. Applied load versus midspan vertical deflection for Beam 14.
Figure 22. Graph. Deflected shape of Beam 14.
Figure 23. Graph. Midspan neutral axis depth from top of Beam 14.
Figure 24. Photo. Failed Beam 14. 4.7 Combined Flexure ResultsThe flexural testing of these four beams under identical loading configurations allows for direct comparisons between observed behaviors. In terms of applied flexural capacity, the four beams behaved similarly. Beam 14 exhibited the lowest capacity at 1,301 kN-m (960 kip-ft), while Beam 3 exhibited the highest capacity at 1,421 kN-m (1,048 kip-ft). Under this loading arrangement, the midspan moment caused by the beam self-weight is 271 kN m (200 kip-ft). Thus, the ultimate moment capacity of these beams was at least 1,572 kN-m (1,160 kip-ft). The live load moment capacities of each of these interior beams in service can be calculated by subtracting the inservice dead load moments from the experimentally determined ultimate moment capacity. Recalling that these beams carried an asphalt wearing surface in field that was not present during the laboratory tests, the ultimate live load moment capacity of each of the interior beams (assuming no dead load distribution between beams in the bridge and using the actual dead loads) was calculated to be at least 1206 kN-m (890 kip-ft). In general, all four beams exhibited elastic behavior through approximately 610 kN-m (450 kip ft) of applied moment. Thus, the total moment on the midspan cross section at the cessation of elastic behavior was approximately 881 kN-m (650 kip-ft). In terms of live load moment capacity, 515 kN-m (380 kip-ft) of moment could be applied to a beam prior to the initiation of inelastic behavior. The experimentally observed midspan deflection at flexural failure was also similar, with all four beams failing after at least 230 mm (9 inches) of deflection had occurred. Figure 25 shows the backbone curves for the applied load versus midspan deflection behavior of the four beams. The figure clearly shows that all four beams exhibited ductile behavior with significant deflection occurring prior to flexural failure. The midspan compression flange strain throughout the loading of the beam is also instructive with regard to the flexural behavior. The prestress and dead load moments resisted by the beam at midspan combine to create a compressive strain of approximately 0.0001 in the top flange. Figure 26 plots the average strain observed in the three gages on the top flange versus the moment that was applied to the midspan cross section. As in Figure 25, this figure only presents the backbone of the response with the unloading-reloading sequences having been eliminated from the data set. Adding the initial strain in the top flange of the beam to the applied strain values shown in Figure 26 results in the determination that the flexural failures of the beams occurred when the compressive strain in the top flange was between 0.0021 and 0.0028. Recall that the flexural failures of two of these beams were observed to be caused by compression failure of the top flange concrete, and the failure of the other two may have been caused by the same mechanism. Given the widely used concrete flexural design assumption wherein concrete is assumed to fail in compression at a strain of 0.003, the failure of these beams at compression flange strains below 0.0028 is notable.
Figure 25. Graph. Applied load versus midspan vertical deflection backbone curves.
Figure 26. Graph. Applied moment versus average compression flange strain backbone curve.
|