U.S. Department of Transportation
Federal Highway Administration
1200 New Jersey Avenue, SE
Washington, DC 20590
202-366-4000
Federal Highway Administration Research and Technology
Coordinating, Developing, and Delivering Highway Transportation Innovations
 |
| This report is an archived publication and may contain dated technical, contact, and link information |
|
Publication Number: FHWA-HRT-07-024
Date: February 2007 |
|||||||||||||||||||||||||||||||||||||||||||||||||||||||||||||||||||||||||
Flexural Capacity of Fire-Damaged Prestressed Concrete Box BeamsCHAPTER 3. MATERIAL CHARACTERIZATION3.1 IntroductionA series of investigations were completed to describe the characteristics of the concrete present in the four box beams. The first of these investigations focused on quantifying the compressive behaviors of the concrete. Second, a visual examination of the box beams was completed. Finally, a petrographic examination of the concrete was conducted. 3.2 Concrete Material PropertiesAfter each beam failed under flexural loading, each end of each beam was cored to extract concrete samples. Three cores were extracted from each solid end-region of the eight beam halves. Approximately 254-mm- (10-inch-) long cores were initially drilled from the top of each beam. This region was lightly reinforced, thus no cores contained any embedded steel. In all cases, the cores each had a 102-mm (4-inch) diameter and were approximately 203 mm (8 inches) in length. The compressive strength, modulus of elasticity, and density of the concrete contained in the four box beams was determined based on these cores and is shown in Table 1. The ends of the cores were prepared via grinding, then the length, diameter, and weight of the cores was determined. The density of the concrete was calculated based on these measurements. The density values shown in the table are based on the cores that were later tested in compression.
Table 1. Compressive strength, modulus of elasticity, and density.
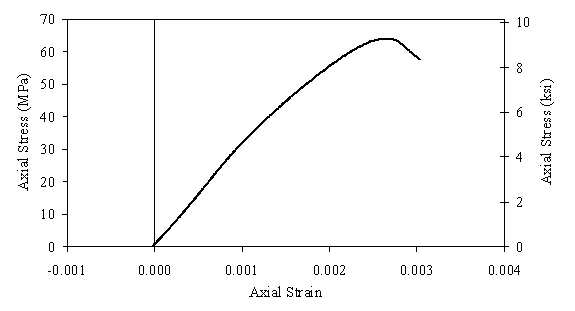
The ASTM C39 "Standard Test Method for Compressive Strength of Cylindrical Concrete Specimens" was followed for the compression testing of two cores from each coring site.(1) The average strength from these two tests is presented in Table 1. Note the relatively high compressive strengths greater than 55 MPa (8 ksi) for beams 3, 4, and 14, while the compressive strength of beam 7 is slightly lower. The ASTM C469 "Standard Test Method for Static Modulus of Elasticity and Poisson's Ratio of Concrete in Compression" was used to determine the modulus of elasticity of the concrete.(2) One core from each coring site was tested. Each core was loaded three times up to 40 percent of its anticipated compression strength, with the results from the second and third loadings being used to calculate the modulus of elasticity. The axial deformation of the core was captured through the use of a pair of parallel rings attached to the top and bottom of the cylinder, allowing for a gage length of 102 mm (4 inches) between rings. The distance between the rings was measured through the use of three linear variable differential transformers (LVDTs). The LVDTs and load readings were all electronically captured throughout the testing via a data acquisition system. Subsequent to the completion of the ASTM C469 testing on one core from each end of each beam, the same cores were tested to failure. In these tests, the ASTM C469 measurements were again captured, but the loading was not halted at 40 percent of the anticipated peak compressive load. These tests provided an indication of the full compressive stress-strain response of the concrete in the beams and specifically the strain levels exhibited by the concrete as it approached compressive failure. Figure 5 shows a representative response from one of the cores. Of the eight cores tested, the average compressive strain observed at the peak compressive stress was 0.00275 with a standard deviation of 0.00018.
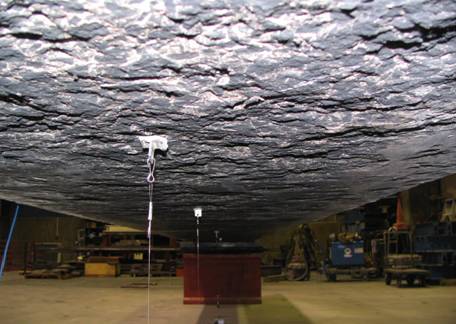
Figure 5. Graph. Compressive stress-strain behavior of core from Beam 3. 3.3 Visual Examination of Fire-Damaged ConcreteA visual examination was completed on the exterior surfaces of the four fire-damaged beams that were tested in flexure. Recall that these four beams were all interior beams within an adjacent box-beam bridge that was covered by a thick asphalt overlay. As such, these beams only exhibited fire related damage on their bottom surfaces. Figure 6 shows the damage on the bottom surface of Beam 4. As a whole, the bottom surfaces of Beams 3, 4, and 7 exhibited similar damage with large patches of scaled concrete. Beam 14 exhibited more widespread surface scaling with most of the bottom flange being uniformly scaled. In all cases, the scaling was focused more toward the middle of the bottom flange, with the bottom flange edges along the length of the beams remaining primarily intact. In general throughout the four beams, the average scaling depth was approximately 10 mm (0.4 inch) with some local scaling of up to 15 mm (0.6 inch) deep. Based on a limited number of scaled but still intact scaled areas, the scaling seems to have occurred in small, thin sheets passing through the aggregate. Fractured aggregate is also visible on a significant portion of the scaled areas, also indicating that the scaling occurred through the aggregate.
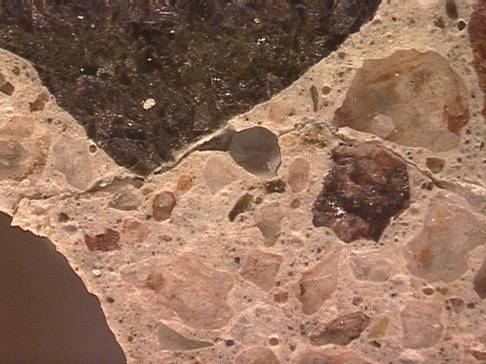
Figure 6. Photo. Bottom face of Beam 4. 3.4 Petrographic Examination of Fire-Damaged ConcretePetrographic examinations were completed on two cores from Beam 4.(3) In each case, 95-mm-(3.75-inch-) diameter cores approximately 152 mm (6 inches) long were extracted from the center of the bottom flange of the beam. One core was extracted from the west quarterpoint and one was extracted from the east quarterpoint along the length of the span. The petrographic examinations were completed in accordance with ASTM C856 "Standard Practice for Petrographic Examination of Hardened Concrete."(4) The investigation included the examination of thin section samples taken from six depths along the length of each core, as well as polished surface samples covering the length of each core. This concrete was determined to include an angular crushed diabase coarse aggregate with a maximum size of approximately 25 mm (1 inch), a primarily quartz fine aggregate from natural sand, and a reasonably well-hydrated cement paste. The concrete appears to be air entrained with small spherical air voids. The small amount of entrapped air indicates that the concrete in these cores was well consolidated. The petrographic examination determined that the concrete in the cores suffered damage to a depth of approximately 25 mm (1 inch) from the exposed surface. In this zone the concrete exhibits both small and large size cracks extending through the paste, through the aggregate, and along the paste aggregate interface. These cracks tend to be perpendicular to the exposed surface of the core. It is likely that these cracks occurred due to desiccation-related shrinkage of the concrete caused by the fire. Concrete beyond the 25 mm (1 inch) zone exhibits much less severe damage with fewer cracks and smaller crack sizes. Figure 7 presents a photomicrograph with a 4.0-mm- (0.157-inch-) width of field and with the center of the photograph located 10 mm (0.4 inch) from the exposed surface of the core to the right of the photo. This figure shows a large crack extending through the 25-mm-(1-inch-) deep zone of damage.
Figure 7. Photo. Photomicrograph of a crack near the exposed surface of the concrete.
|
|||||||||||||||||||||||||||||||||||||||||||||||||||||||||||||||||||||||||