U.S. Department of Transportation
Federal Highway Administration
1200 New Jersey Avenue, SE
Washington, DC 20590
202-366-4000
Federal Highway Administration Research and Technology
Coordinating, Developing, and Delivering Highway Transportation Innovations
| REPORT |
| This report is an archived publication and may contain dated technical, contact, and link information |
|
| Publication Number: FHWA-HRT-09-028 Date: May 2009 |
Publication Number: FHWA-HRT-09-028 Date: May 2009 |
The study for this report investigated the forces acting on inundated bridge decks through physical experimental testing and CFD modeling with two commercial software packages. Three types of bridges were tested for their reaction to drag forces, lift forces, and moment-generating forces in relation to the degree of inundation (inundation ratio). The bridge types included traditional six-girder and three-girder shapes, and prototype streamlined deck shapes designed to reduce the force load during inundation.
The first technical task performed for this study was the analysis of drag and lift forces and moments for inundated bridge decks as a function of immersion height and flow rate. The analysis results for these prototypical open channel flow configurations were compared to the force balance and Particle Image Velocimetry (PIV) measurements from TFHRC tests to validate the corresponding CFD models. Both two-dimensional (2-D) and three-dimensional (3-D) models of the bridge decks with six- and three-girders were studied using Fluent® and STAR-CD® CFD software. A set of simulations were completed to assess the impact of various modeling options, including the following, while always considering accuracy of results and computational efficiency:
In determining the structural response of the bridge decks, both the properties of the fluid and the configuration of the bridge were important. Consistent with the experimental methodology, the nomenclature for bridge and flume dimensions are illustrated in figure 1.

Figure 1. Diagram. Scaled six-girder bridge deck model used in assessments of drag and lift forces and the nomenclature for bridge deck and flume dimensions.
In determining the forces on bridges, the properties of the flowing stream that had the greatest impact were the height of the water and its velocity. The height of the water surface in relation to the flume dimension, the position of the bridge deck, as well as the flow velocity can be expressed as the inundation ratio, h*. Shown in figure 2, the inundation ratio is a measure of the difference between the height of the free surface over the low chord of the bridge deck (hu - hb) divided by the deck thickness, s. Higher values of h* mean that the bridge is more submerged. The flow velocity can be characterized by the dimensionless Fr. Fr (figure 3) is expressed as the free stream velocity, v, over the square root of the depth of flow multiplied by the gravitational acceleration, g
Figure 2. Equation. Inundation ratio.

Figure 3. Equation. Froude number.
There were three primary responses of the bridge deck to the flowing water. Figure 4 illustrates the forces acting on a submerged bridge deck. The drag force, FD, acting parallel to flow, affects the bridge deck horizontal stability and tends to "push" the bridge off its piers and abutments. The lift force, FL, acts vertically and perpendicular to flow and can lift the bridge deck off of its piers and abutments. Unevenly distributed forces on the bridge decks lead to moments about the center of gravity, Mcg, of the bridge deck, which can cause the bridge to overturn.

Figure 4. Diagram. Definition sketch of forces acting on bridge deck.
The forces of drag and lift and moments acting on the bridge deck are usually expressed in nondimensional coefficient forms. The definition of the coefficient of drag, CD, depends on h* and is shown in figure 5. The two cases correspond to a partially inundated bridge (h* < 1) and a fully submerged bridge (h* > 1).
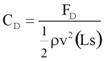 , if h* > 1; and
 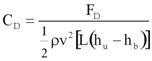 , if h* < 1
Figure 5. Equation. Drag coefficient.
The lift coefficient is defined in figure 6. The moment coefficient with respect to the center of gravity of the bridge deck is defined in figure 7.

Figure 6. Equation. Lift coefficient.

Figure 7. Equation. Moment coefficient.
Here, FD and FL are the forces integrated over the surface of the bridge deck along the flow and perpendicular directions, respectively, where ρ is the density of water, and L is the length of the bridge (orthogonal to the plane of figure 1). When calculating the integrated vertical force, FL, its component associated with buoyancy force is excluded to be consistent with the experiments in which force balances were calibrated for zero lift under no-flow conditions.
The physical experimental setup was designed to empirically determine the effect of the inundation ratio on the lift, drag, and moment forces for three different bridge prototypes.
The experiments were conducted in a 12.8 m long by 0.4 m wide by 0.5 m high Plexiglas® rectangular flume. The flume was set horizontally, and the depth of flow was controlled with an automatic, adjustable tailgate located at the downstream end of the flume. Flow was supplied by a 0.054-m3/s pumping system. The mean free-surface level was measured using ultrasonic sensors at two cross sections along the flume. An electromagnetic flow meter measured the discharge. An Acoustic Doppler Velocimeter (ADV) probe was used to measure the velocity distribution of the flow.
The following three models of bridge decks were tested in the experiments:

Figure 8. Diagram. Dimensions of the six-girder bridge deck.
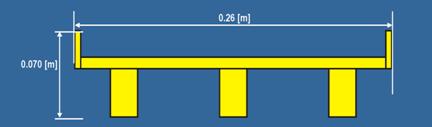
Figure 9. Diagram. Dimensions of the three-girder bridge deck.

Figure 10. Diagram. Dimensions of the streamlined bridge deck.
Both the six-girder and three-girder bridge decks had railings on both sides with the dimensions shown in figure 11.

Figure 11. Diagram. Side view of railings with dimensions for the six-girder and three-girder bridge decks.
The six-girder bridge, representing a typical U.S. highway bridge deck shape, was constructed out of Polyvinyl Chloride (PVC) at a 1:40 geometrical reduction scale based on the depths, maximum discharges, and inundations possible in the flume. This scaled bridge deck was optimally sized to investigate a range of force values in flow conditions ranging from low to high flows, all at subcritical Fr in the upstream flow. The six-girder and three-girder bridge decks had the same width, but the three-girder deck had a 22 percent larger frontal area (s = 0.70 m).
The three bridges were evaluated in the same flume and under the same experimental conditions in order to reduce the experimental error. The experiments were conducted for four approach velocities ranging from 0.25 to 0.5 m/s. The flow depths, hu, in the experiments were always kept at 0.25 m. Under these conditions, the Fr varied within the range of 0.16 to 0.32 in response to the changing velocities. The submergence of the bridge deck within the 0.25-m flow depth was varied from slight submergence of the deck girders to complete overtopping of the bridge deck, corresponding to an inundation ratio of h* = 0.29 to roughly 5.0 (for the streamlined bridge).
The measurement of forces on the bridge deck was performed by a deck force analyzer system, which was constructed for this study (figure 12 and figure 13). This transducer system was designed to measure forces induced by the bridge deck model simultaneously in the x-direction (Drag) and z-direction (Lift) by use of electric strain gauges. The bridge deck model was mounted on a bracket and positioned in the flume. The bracket was attached at the platform of the system by four ball-beared pendulums which were connected with the platform by four flat springs. This allowed it to move back and forth in the direction of flow as well as vertically. Motion in each direction was resisted by two pairs of flat springs. The tension in these springs was detected by strain gauges, which generated an electrical signal proportional to the forces upon the bridge deck model in the x-direction (Drag) and z-direction (Lift).

Figure 12. Diagram. Test section of deck force analyzer showing strain gauge configuration.

Figure 13. Photo. Deck force analyzer system at the TFHRC hydraulics lab.
The transducer was dead-load calibrated prior to use and was checked periodically during data collection. The calibration was performed by running an experiment with still water for each inundation ratio h*. The output of the acquisition data was set as the zero-reference value. The mean drag and lift forces of an experimental run were evaluated by subtracting the corresponding zero-reference value.
A secondary experimental setup was built to examine the flow field around the bridges in detail using PIV, which is a noninvasive measurement technique to visualize flow distributions. The technique involves adding microscopically small particles that are highly reflective to the flow and then using a laser to illuminate a thin layer of the flow so that only the particles in that light sheet reflected the laser's light. Using cameras pointed with different angles toward the light sheet, researchers can capture images of the moving particles. In order to measure the velocity, at least two exposures were needed. They could be recorded on one or several frames. The frames were split in a large number of interrogation areas, or tiles. It was then possible to calculate a displacement vector for each tile with the help of signal processing (an auto correlation/cross correlation algorithm). This was converted to a velocity using the time between image exposures.
The PIV experiment was conducted in a smaller flume with bridge models scaled down by a factor of 1.5. The experiments were conducted for V = 250 mm/s with hb = 50 mm, 101 mm, and 116 mm and the depth of the flow, hu, as 170 mm.
Besides establishing credible experimental data on the response of bridge decks to various forces, a major objective of this study was to establish validated computational practices to address the transportation community's research needs in bridge hydraulics. Traditionally, bridge hydraulics work relies on scaled experiments to provide measurements for flow field, which is the velocity and turbulence of a fluid as functions of position and time. Now, however, parallel computers and commercially available software provide an opportunity to shift the focus of these evaluations to the CFD domain. After being validated using the data from a limited set of experiments, high-fidelity CFD simulations can be used to expand the range and scope of parametric studies. The CFD simulations may be used in the future to predict the effects of scaling by studying differences between the reduced-scale experiments and full-scale bridges.
In this study, the reduced-scale experiments conducted at the TFHRC hydraulics laboratory established the foundations of a CFD-based simulation methodology. Researchers at Argonne and TFHRC worked together to study CFD techniques for simulating open channel flow around inundated bridges. The computationally intensive CFD modeling programs require enormous computing power.
Argonne is leading the initiative to establish the high-performance computing center, Transportation Research and Analysis Computing Center (TRACC), to pursue research and development (R&D) programs. TRACC is a general purpose advanced computing and visualization facility available to the transportation community for a broad spectrum of applications. The TRACC components include high-performance computing, visualization, and networking systems.
Argonne analysts provided technical support to researchers at TFHRC on CFD simulations for this study. Two CFD software packages were investigated for their utility in modeling open channel flow around bridges for this study. The STAR-CD® and Fluent® programs were used in this study to build models of the six- and three-girder bridges and to run simulations. The models were calibrated using the results of the six-girder reduced scale experiments and PIV results. The three-girder bridge deck was simulated using the same calibration settings as the six-girder models to serve as a "blind-test" of validity. The following chapter describes the two models and their numerical configuration and evaluation for this study.

