U.S. Department of Transportation
Federal Highway Administration
1200 New Jersey Avenue, SE
Washington, DC 20590
202-366-4000
Federal Highway Administration Research and Technology
Coordinating, Developing, and Delivering Highway Transportation Innovations
 |
| This report is an archived publication and may contain dated technical, contact, and link information |
|
Publication Number: FHWA-HRT-09-044 |
|||||||||||||||||||||||||||||||
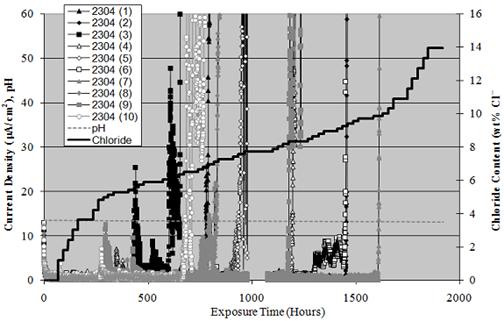
CHAPTER 4. RESULTS AND DISCUSSION #1TASK 1.1. STRESS CORROSION CRACKINGInitial pH of the ambient temperature test solution was 13.45; however, the pH decreased to 13.30 with incremental Cl- additions due to the common ion effect. No strain changes that could be related to crack development were noted, and visual low power microscopic inspection failed to reveal any cracking. This was the case for both the ambient and elevated temperature exposures. It is concluded that the specimens were not susceptible to stress corrosion cracking in the simulated pore solution. TASK 1.2. CORROSION PROPERTIES OF TYPE 2304 SS REINFORCEMENTAccelerated Test MethodFigure 11 plots current density versus exposure time for the 10 identical 2304 SS specimens. The pH data is also shown, which appears as a near horizontal line slightly above a value of 12 and [Cl-] versus time according to the incremental additions. Current density was between 10 and 12 μ A/cm2 initially but decreased to zero to 2 μA/cm2 during the first few days of exposure, presumably reflecting repair of defects in the passive film. For most specimens, a definitive transition from this low current density to much higher values occurred at a particular time, which reflected the onset of active pitting. The time at which this occurred covered a relatively broad range from 295 hours for specimen 9 to 1,608 hours for specimen 7. The data interruption near 1,000 hours resulted from a power outage that lasted several days due to Hurricane Katrina in August 2005.
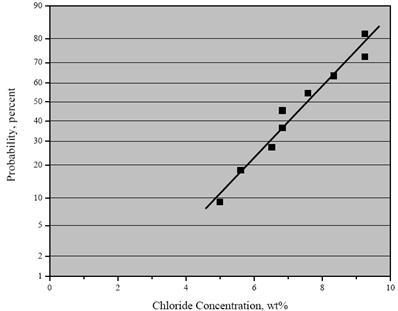
Table 4 shows the [Cl-] at which individual specimens activated. As such, these values are indicative of the critical chloride concentration for initiation of corrosion, CT. The fact that these values extend over a range suggests that the threshold concentration is a distributed parameter rather than a discrete number as reported previously by others.(16-18) Figure 12 shows a cumulative distribution function plot of these data which allows projection of the probability of corrosion initiation at a particular [Cl-]. This analysis assumes the data are normally distributed. By way of comparison, a companion study using this experimental method reported CT for black bar as 0.24–0.30 wt percent Cl-(19). Thus, CT for 2304 SS was about 17 times greater than for black bar according to this experimental method. However, the companion study referenced above questioned accuracy of this approach for correctly ranking reinforcements according to CT compared to performance in concrete.(19)
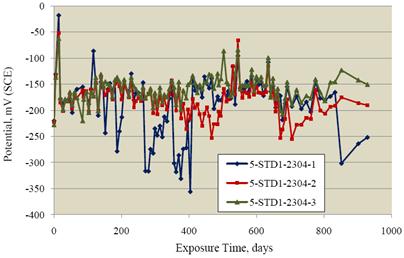
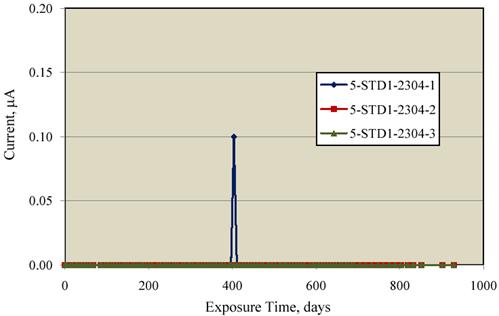
Concrete Specimen ExposuresThe SDS specimens were exposed for 929 days. Figure 13 shows the resultant potential data. For the most part, potentials were in the range -150 to -200 mVSCE; however, specimen 2304-1 in particular had negative excursions which reached -356 mVSCE on one occasion. Figure 14 shows the corresponding macrocell current data. With the exception of one reading for specimen 2304-1, the currents were below the detection limit and considered zero. The one finite current reading of 0.1 μ A for specimen 2304-1 occurred at the same time as the most negative potential excursion for this same specimen (404 days exposure) that was mentioned previously. Apparently, the specimen exhibited momentary corrosion activity followed by repassivation.
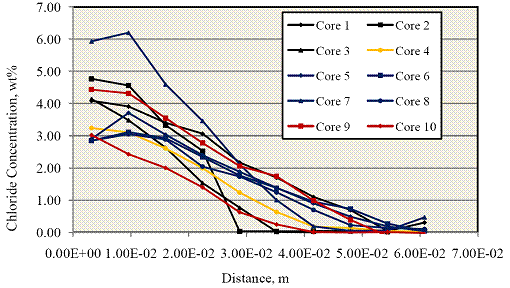
While no cores were taken from the 2304 SS-reinforced SDS specimens, 75-mm-diameter cores were taken from identical companion specimens subjected concurrently to the same exposure. However, the cores were taken at different times. Once acquired, the cores were dry sliced parallel to the top surface at 6.4-mm intervals, and the individual slices were ground to powder. The powder samples were then analyzed for [Cl-] using the FDOT wet chemistry method.(20) Figure 15 shows a plot of [Cl-] data for these as a function of depth into the concrete.
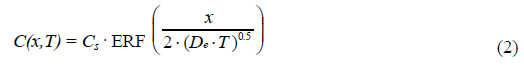
From each of the above [Cl-] profiles, a value for the effective diffusion coefficient, De, was calculated using a least squares fit to the one-dimensional solution to Fick's second law as seen in the following equation:
Where:
This solution assumes that Cs and De are spatially and chronologically constant, whereas they are, in fact, distributed parameters and may vary with exposure time and concrete age.(21) The solution also assumes that initial [Cl-] in the concrete was zero. Using the average De for the 10 determinations (2.59·10-11 m2/s), [Cl-] was calculated at the top bar depth at 929 days using equation 1 and assuming Cs = 18 kg/m3(7.22 wt percent cement basis). This yielded a value of 12.5 kg/m3(4.51 wt percent cement). It is concluded, assuming the momentary potential and macrocell current activity cited above in conjunction with figure 13 and figure 14 did not constitute corrosion initiation, that CT for 2304 SS exceeds this value. In the recently completed companion study references above, CT for black bar at a probability of 2-percent activation was 1.0 kg/m3(0.35 wt percent cement) and for 20-percent activation 1.9 kg/m3(0.69 wt percent cement).(19) If the above cited minimum CT for 2304 SS (12.5 kg/m3) were to correspond to 2-percent probability of corrosion initiation for this reinforcement, then CT for 2304 SS exceeds that of black bar by a factor of 12.5. If, on the other hand, this CT for 2304 SS pertains to 20-percent probability of activation, then the improvement relative to black bar is by a factor greater than 6.6.
|
|||||||||||||||||||||||||||||||