U.S. Department of Transportation
Federal Highway Administration
1200 New Jersey Avenue, SE
Washington, DC 20590
202-366-4000
Federal Highway Administration Research and Technology
Coordinating, Developing, and Delivering Highway Transportation Innovations
| REPORT |
| This report is an archived publication and may contain dated technical, contact, and link information |
|
| Publication Number: FHWA-HRT-13-101 Date: November 2013 |
Publication Number: FHWA-HRT-13-101 Date: November 2013 |
Session 3 of the workshop consisted of presentations on changes in service loads and foundation reuse from the perspective of FHWA and State transportation department personnel. Mr. Khalid Mohamed, Geotechnical Engineer with the FHWA Office of Bridge Technology, moderated the session.
Mr. Ben Rivers, Geotechnical Engineer at the FHWA Resource Center, provided a look ahead at the evaluation of foundations for reuse. The drivers for foundation reuse are that existing foundations are assets with a functional value. Reuse enhances preservation efforts, cost and time savings, and minimizes impacts to mobility. Mr. Rivers emphasized that reuse designs must meet or exceed current design standards. The issues boil down to costs and managing risks.
Relationships between factor of safety and annual probability of failure based on actual engineering projects was shown (figure 11) to illustrate the interrelationship between the level of engineering and risk of failure.(15) Mr. Rivers briefly described when it is appropriate to consider foundations for reuse; the obstacles for reusing existing foundations; and, current needs in considering reuse of foundations. The foundation reuse needs include evaluation of the integrity of the foundations; understanding nominal resistance and load-deflection criteria for all design loads; and quantifying reliability and establishing acceptable risk thresholds for bridges. Mr. Rivers concluded by reviewing opportunities with the use of new and existing methods for in situ determination of soil properties and structural integrity, and listed some of the challenges facing foundation reuse.

© 2008 American Society of Civil Engineers. Reprinted with permission of ASCE.
Figure 11. Graph. Probability and risk of slope failure.(15)
Mr. Peter Connors, Geotechnical Engineer at the Massachusetts Department of Transportation (MassDOT), provided an overview of the MassDOT experiences with evaluation and reuse of bridge foundations. Foundation reuse is written into the Massachusetts bridge manual. Reasons for reusing foundations include replacement of structurally deficient bridges, good performance of foundations, accelerated bridge construction, cost/time benefit, historic nature of bridges, and superior quality. Conditions that require further evaluation for reuse include bridge widening with spread footings or arches, prior reuse, or when foundations are of poor quality. Above all, one should not force a reuse solution on a project. Reuse is not different from new construction; one still needs field investigation and testing and engineering with both theory and experience (figure 12). Mr. Connors provided a detailed review of the evaluation process culminating in a preliminary structure report, the existing foundation types, subsurface/substructure investigation methods, and the use of engineering judgment.

| Source: MassDOT |
Figure 12. Diagram. Is reuse of a foundation different than new?
Mr. William Kramer, State Foundations and Geotechnical Engineer at IDOT Bureau of Bridges and Structures, provided an overview of Illinois’ past and present policies on foundation capacity for reuse. Illinois has a formal policy on reuse because: (1) it has been difficult to prove bridges designed under old American Association of State Highway Officials (AASHTO) codes meet current code, (2) it is difficult to justify the expense to replace when no evidence of poor performance exists, (3) consultants often prefer to make conservative judgments to protect liability, and (4) the public demand to stretch limited tax dollars and provide consistent judgments required IDOT to develop formal policy for foundation reuse.
Illinois has an elaborate methodology for evaluating foundation reuse. Mr. Kramer provided background on the past practice, the need for change, and an overview of the new policy issued in 2008. The new policy allows for an abbreviated analysis when the substructure is in a good or repairable condition and the dead load increase is less than 15 percent. A summary of the new policy for capacity tables for spread footings and piles is shown in figure 13. A detailed analysis is required when the dead load will increase more than 15 percent. Details of the procedures are shown in Mr. Kramer´s presentation.

| Source: IDOT |
Figure 13. Diagram. Foundation capacity tables for spread footings and piles.(16)
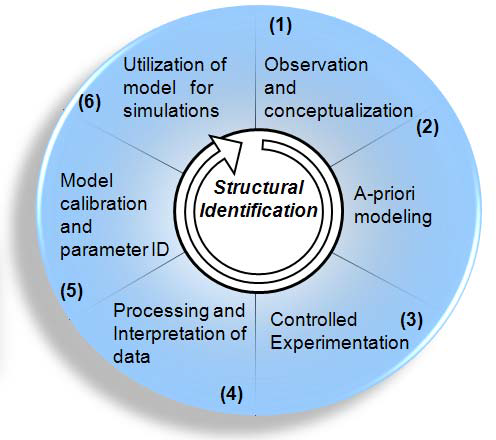
Professor A. Emin Aktan of Drexel University provided a presentation on structural identification in reusing bridge substructures. Professor Atkan provided background on the six steps of structural identification, which entails an integration of analysis and experimentation to reduce uncertainty by calibrating a finite element model of a bridge (see figure 14).(17) The process was detailed in an example. This process is being applied in the LTBP Program and is also detailed in the American Society of Civil Engineers (ASCE) book, Structural Identification of Constructed Systems.(17) Some key takeaways from the presentation are that reality is always 25 percent removed from our idealization of global behavior, and different time periods provide different behavior perspectives.

| © A. Emin Aktan |
Figure 14. Diagram. Six steps of structural identification.(17)
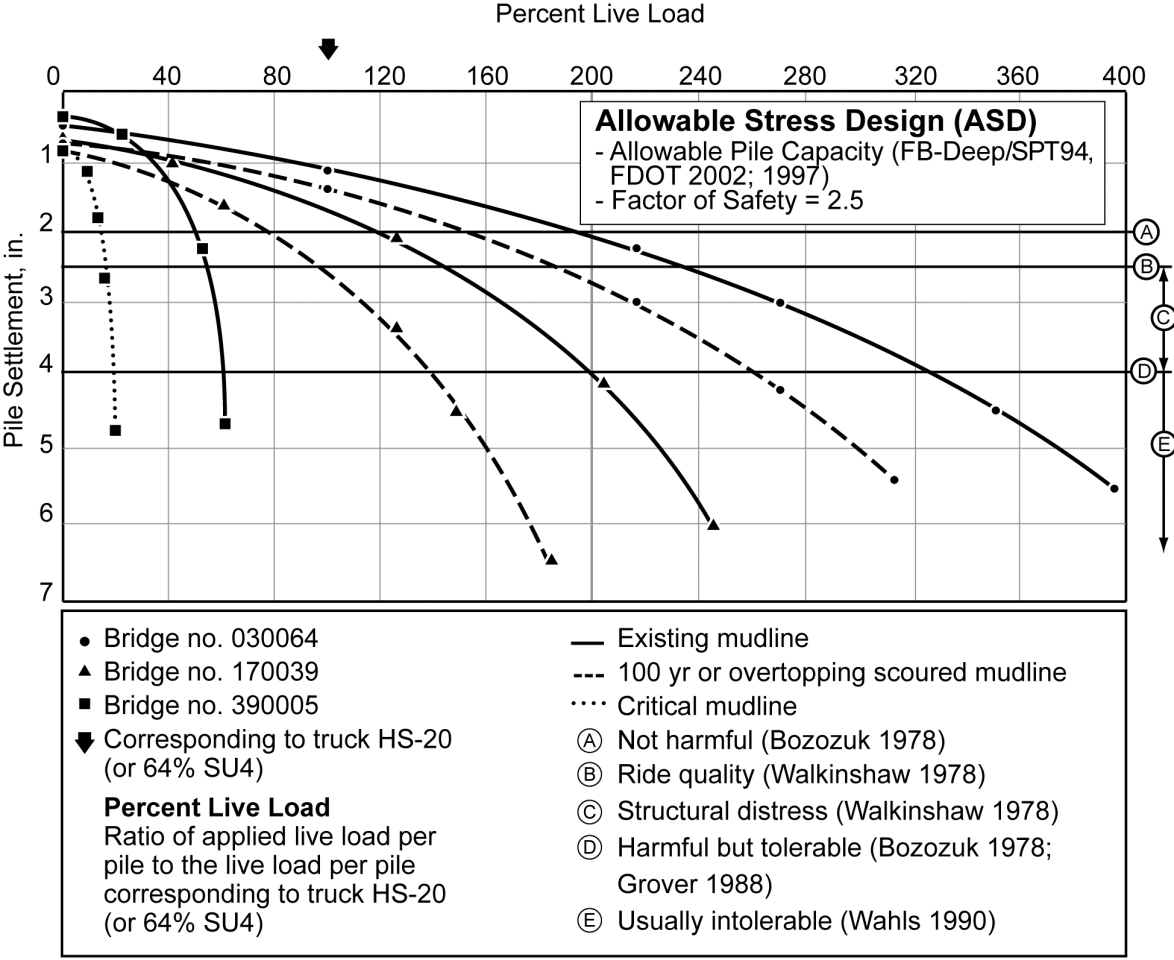
Dr. Hisham N. Sunna of Ayres Associates, Inc., provided a review of the load rating of pile-supported bridges. The available load rating methodologies for the superstructure and the substructure were reviewed, indicating that structural bridge load rating is traditionally based on the superstructure components with the substructure being ignored. The presenter reviewed geotechnical performance factors and elaborated on settlement considerations. Dr. Sunna showed an application of settlement considerations to case histories for Allowable Stress Rating (ASR) for determining the allowable live load that can be carried by the bridge (figure 15).(18) Load rating for different bridges was conducted to compare substructure load rating and superstructure load rating and demonstrate dependence of substructure based load rating on the amount of scour at the site. The presentation was concluded that all bridges over waterways should be analyzed for a substructure load rating considering the existing mudline and potential scour; a bridge load rating based only on the superstructure could cause either catastrophic or functional failure.

| © 2013 American Society of Civil Engineers. Reprinted with permission of ASCE. |
Figure 15. Diagram. Allowable Stress Rating (ASR).(18)
In addition to the presenters, the following also participated in the workshop: