U.S. Department of Transportation
Federal Highway Administration
1200 New Jersey Avenue, SE
Washington, DC 20590
202-366-4000
Federal Highway Administration Research and Technology
Coordinating, Developing, and Delivering Highway Transportation Innovations
 |
| This report is an archived publication and may contain dated technical, contact, and link information |
|
Publication Number: FHWA-HRT-10-037
Date: October 2010 |
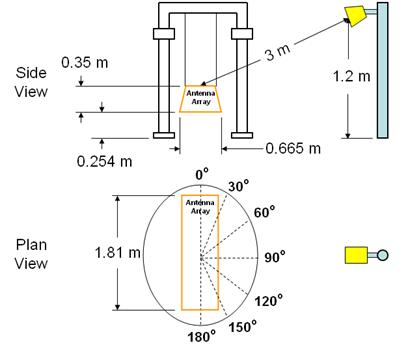
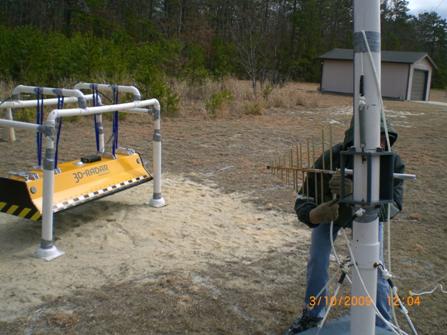
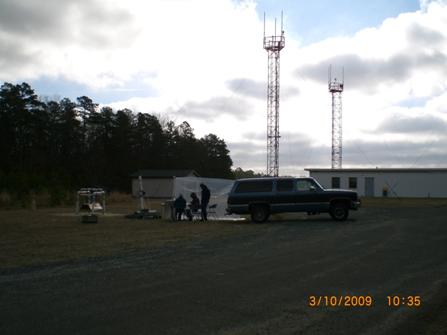
Step Frequency Ground Penetrating Radar Characterization and Federal Evaluation TestsTest DesignSF GPR emissions characterization testing was conducted using the configuration shown in figure 2 and figure 3 and pictured in figure 4 and figure 5. The side view in figure 2 illustrates the maximum 9.84-ft (3-m) distance that was maintained between the SF GPR array under test and the emission measurement antennas. A biconic antenna was used to measure frequencies in the 50–299-MHz range, a log periodic antenna was used to measure frequencies in the 300–2,000-MHz range, and a horn antenna was used to measure frequencies in the 2,001–3,000-MHz range. Detailed make and model information for the test equipment is provided below. Figure 2 illustrates the seven angles that the SF GPR antenna array was aligned with for each test configuration to determine the orientation corresponding to maximum emissions. Due to antenna array symmetry, angles from 0 to 180 degrees were representative. As the test plan required, the antenna array was always directed at the ground and was suspended 10 inches (254 mm) above a standard sand pit. Emission measurement equipment included the following:
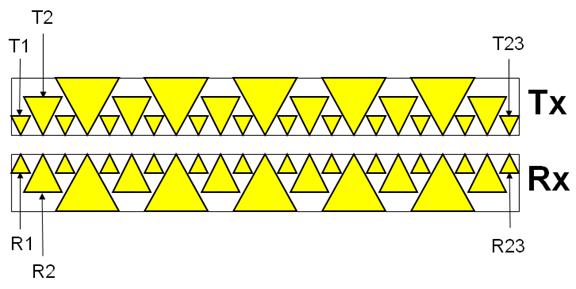
The SF GPR system consists of a laptop computer, a rack mountable radar control unit, a 26.24-ft (8-m)-long cable bundle, and an antenna array that has 23 antenna elements (see figure 6). The SF GPR emission characterization test procedure follows:
Maximum SF GPR emissions corresponding to the worst case orientation of the SF GPR antenna array relative to the emissions measurement antenna were determined by comparing emission measurement plots for each unnotched measurement configuration in the frequency range of interest and selecting the configuration corresponding to the maximum emissions. Another set of measurements was made using the same procedure previously defined, but for these measurements, the number of active antenna array elements in the SF GPR array varied. These measurements were made in the event that Federal agencies would analyze emission characteristics when a subset of antenna array elements is active. The original test scenario, using all antenna array elements, represents worst case emissions. Therefore, the supplemental measurements are only expected to be used for a deeper analysis of SF GPR emission characteristics if needed.
1ft = 0.305 m Text Description
1ft = 0.305 m Text Description
Text Description
Text Description
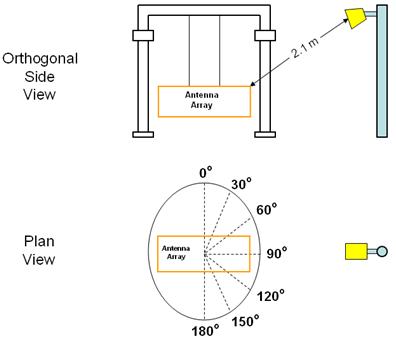
Text Description Additional follow-up emission measurements were made using procedures described in the test report in appendix E. The minimum distance between the SF GPR antenna array and the measurement antenna was 6.88 ft (2.1 m), as illustrated in figure 3. This distance often corresponded to the orientation where maximum emissions were measured. |