U.S. Department of Transportation
Federal Highway Administration
1200 New Jersey Avenue, SE
Washington, DC 20590
202-366-4000
Federal Highway Administration Research and Technology
Coordinating, Developing, and Delivering Highway Transportation Innovations
| REPORT |
| This report is an archived publication and may contain dated technical, contact, and link information |
|
| Publication Number: FHWA-HRT-11-064 Date: November 2011 |
Publication Number: FHWA-HRT-11-064 Date: November 2011 |
Performance measurement through quantifiable MOEs is not an end unto itself. Rather, MOEs are used to determine the extent to which the proposed project and its alternatives meet the project need and purpose. MOEs should be selected prior to selection of the analytical approach and tools because they are critical to determining the extent to which project objectives have been achieved.
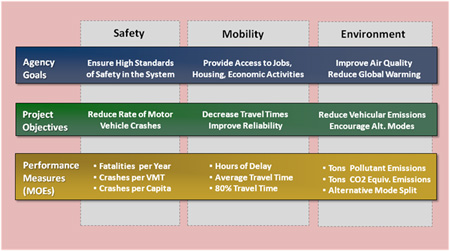
MOEs should not be selected in a vacuum. They should be related to the purpose of the project and the general goals of the agency. Figure 7 shows how the selected MOEs can be related to the project objectives and how the project objectives can be related to broad agency goals. The relationship is much like a pyramid, starting at the top with a few goals related to specific topics (safety, mobility, environment, etc.). One or more project objectives may then be related to that goal. Several MOEs are typically required to determine the degree to which the proposed project meets its objectives.
Note: Figure shows only exceptionally brief summaries of project objectives. Actual objectives would be more specific.
Figure 7. Chart. Relationship of agency goals, project objectives, performance measures, and MOEs.
There are a wide variety of MOEs available to the manager and analyst. In regards to traffic performance measurement, the MOEs fall into seven broad categories: measures of utilization, travel time, delay, speed, stops, queues, and density (see table 2).(1) In addition, there are traffic-related MOEs, collisions, and emissions, which address safety and the environment.
MOE Type |
Bottleneck and |
System Measures |
Indices of Performance |
|---|---|---|---|
Utilization |
Vehicles per hour, V/C or D/C |
PMT, VMT |
V/C or D/C, level of service |
Time |
Mean travel time, 80 percent travel time |
PHT, VHT |
Travel time index, planning time index |
Delay |
Mean delay/vehicle |
PHD, VHD |
Level of service |
Speed |
Mean |
VMT/VHT, PMT/PHT |
Percent free-flow speed, level of service |
Stops |
Mean stops/vehicle |
Total stops |
Probability of stopping |
Queue |
Mean, 95 percent |
Stopped delay |
Queue storage ratio |
Density |
Mean |
N/A |
Level of service |
Collisions |
Collisions/million VMT |
N/A |
Actual/typical facility rate |
Emissions |
Tons/day |
Tons/day |
N/A |
Notes: V/C and D/C are the volume/capacity ratio and demand/capacity ratio, respectively. PMT, PHT, and PHD are person-miles traveled, person-hours traveled, and person-hours of delay, respectively. VMT, VHT, VHD are the vehicular equivalent of the person measures. The queue storage ratio is the ratio of the predicted queue length to the available storage length. N/A indicates not applicable.
Each MOE type, such as measures of utilization, is expressed differently depending on whether the focus is on a specific facility or on the system. In the case of measures of utilization, the MOEs for a specific facility may be vehicles per hour, volume/capacity ratio, or demand/capacity ratio. At the system level, it is typical to aggregate these facility-specific measures into accumulated PMT or VMT. Measurements of volume/capacity ratio are generally of little value at the system level because all transportation systems have a great deal of spare capacity when considered as a whole. For the same reason, average volume/capacity at the facility level is of less value than the maximum volume/capacity ratio at any bottleneck in the facility.
Each type of MOE can also be expressed in the form of an index relating the MOE to some target standard value. The purpose of the indices is to facilitate communication of the quality of the performance (good, OK, bad) to decisionmakers less familiar with typical or acceptable values for the MOE. In the case of measures of utilization, the usual index is the volume/capacity ratio or the demand/capacity ratio. The demand/capacity ratio is usually preferable because it provides better information than the capacity-constrained volume/capacity ratio. Volume, being a counted value in the field, cannot exceed the physical capacity of the bottleneck. A maximum bottleneck demand/capacity ratio below 1.00 suggests the facility has spare capacity. The ratios may be supplemented with a letter grade, A–F, indicating the level of service.
More on MOEs and performance measurement in general can be found on the following FHWA sites:
In the remainder of this chapter, the basic traffic performance MOE types are discussed with the intent that when each category of MOE is mentioned, the category includes all of the facility-, system-, and index-specific variations within each MOE type identified in table 2.
While the project purpose is constant throughout the project development life cycle, the purpose of the traffic analysis varies slightly at each stage. Thus, the MOEs will vary in order to address slightly different analysis objectives at each stage.
At this early stage of the project development cycle, the analysis objectives are to develop a conceptual design for the project and to sketch out possible alternatives. The focus is on rapid analysis considering system effects, with details of the project to be determined at each stage of project development. The temporal focus is primarily 20 years or more in the future. The MOEs to support the conceptual design process are generally system MOEs to ensure the project is achieving its purpose and facility MOEs to aid in sizing the project. As shown in table 3, the MOEs that are appropriate at this stage of the analysis include PMT, PHT, person-hours of delay (PHD), VMT, VHT, vehicle-hours of delay (VHD), mean speed, collision rate, and tons of emissions.
At the project clearance stage, the objective is to develop a preliminary design for the project in sufficient detail to enable comparison of its benefits and environmental impacts to those of its alternatives. The MOEs appropriate at this stage of analysis are primarily facility-specific MOEs, with some system MOEs to aid in the environmental analysis. The temporal focus is both short-term (construction and opening day of project) and long-term (25 years after project completion). The project clearance stage involves communication of the analysis results with decisionmakers and stakeholders as well as with the general public. Thus, there is heavy use of index MOEs, such as level of service, to make it readily apparent to the non-technical person whether the performance will be acceptable or not. As shown in table 3, the MOEs that are appropriate at this stage of the analysis include volumes, demand/capacity ratios, mean travel time, level of service, mean speed, collision rate, and tons of emissions.
An emerging issue for project analysis is to identify measures of facility reliability, such as the expected 80 percentile (or other percentile) highest travel time for the facility. For the convenience of communicating the results to decisionmakers, reliability may be expressed in terms of the planning time index, the ratio of extra time required to the off-peak free-flow travel time to ensure that the driver arrives on time with a certain degree of certainty (e.g., 95 percent).
At the PS&E stage, the focus is on project design details. The MOEs at this stage are focused on the specific design elements of the project and not the overall facility. MOEs sensitive to project design details (segments, intersections, merge, diverge, etc.) are critical at this stage. As shown in table 3, the MOEs that are appropriate at this stage of the analysis include volume/capacity ratios, level of service, and the queue storage ratio. The objective of project design is usually to ensure that the facility is sized to handle the forecasted demands. In this situation, the demands are constrained by the capacities of the facilities feeding the project. The project is designed to serve the volumes that can arrive at the project site, not the potential demands that might arrive if the surrounding infrastructure was improved.
During construction, the focus is on safely moving traffic through or around the construction site. A certain amount of temporary delay and queuing is expected. The focus is less on achieving a specific traffic performance objective than on the best possible setup within the constraints of safely constructing the project.
As shown in table 3, basic MOEs are appropriate at this stage of the analysis to facilitate rapid computation when dealing with construction traffic handling and detours. They include volume/capacity ratios, delay, and queue storage ratios. Most other MOEs were already computed and evaluated during the PS&E stage when the construction traffic plans were developed.
Once a facility is open and operating, the focus returns to obtaining the best possible traffic performance within the constraints of the project design. The geographic focus is the facility, and the temporal focus is day-to-day operations. As shown in table 3, the facility-specific MOEs are appropriate at this stage of the analysis, including vehicles per hour, travel times, delay, speed, stops per vehicle, queue storage ratios, and densities. Delay, speed, stops per vehicle, and queue storage are important in signal coordination analyses. Ramp delay, freeway mainline densities, and ramp queue storage are important for ramp metering analyses. Mean and 80 percent travel times are important for active transportation and demand management evaluations. Vehicles per hour processed by the facility are a measure of the facility's productivity.
Table 3. Typical MOEs by analysis stage.
Dimension |
Project Initiation |
Project Clearance |
PS&E |
Construction |
Operations |
|---|---|---|---|---|---|
Utilization |
VMT, PMT |
VPH, D/C |
V/C |
V/C |
VPH |
Time |
VHT, PHT |
Mean, 80 percent |
N/A |
N/A |
Mean, 80 percent |
Delay |
VHD, PHD |
LOS |
LOS |
Delay/vehicle |
Delay/vehicle |
Speed |
Mean |
LOS, Mean |
LOS |
N/A |
Mean |
Stops |
N/A |
N/A |
N/A |
N/A |
Stops/vehicle |
Queue |
N/A |
N/A |
95 percent QSR |
95 percent QSR |
95 percent QSR |
Density |
N/A |
LOS |
LOS |
N/A |
Mean |
Collisions |
Rate |
Rate |
N/A |
N/A |
N/A |
Emissions |
Tons |
Tons |
N/A |
N/A |
N/A |
VPH = vehicles per hour, D/C = demand/capacity ratio, V/C = volume/capacity ratio, LOS = level of service, QSR = queue storage ratio, N/A = not applicable.
As shown in table 4, each traffic analysis tool category is designed to produce a particular set of MOEs suitable for the project development stage for which the tool is targeted. There is also significant overlap in the MOEs produced by the tool categories. Sketch planning and travel demand models are designed to produce system-level MOEs, although facility-specific MOEs can also be obtained from travel demand models. Deterministic HCM-based tools are designed to produce bottleneck-specific MOEs as well as facility-specific MOEs. Traffic control optimization tools generally focus on facility-specific MOEs. Traffic simulation models produce facility- and system-specific MOEs.
Table 4. MOEs by tool category.
Dimension |
Sketch Planning Tools |
Travel Demand Models |
Deterministic HCM-Based Tools |
Optimization Tools |
Simulation Models |
|---|---|---|---|---|---|
Utilization |
VMT, PMT |
VMT, PMT, D/C |
D/C |
V/C |
VMT, V/C |
Time |
VHT, PHT |
VHT, PHT |
Mean |
Mean |
VHT, Mean |
Delay |
VHD, PHD |
VHD, PHD |
Delay/vehicle, LOS |
Delay/vehicle |
VHD, Delay/vehicle |
Speed |
Mean |
Mean |
Mean, LOS |
Mean |
Mean |
Stops |
N/A |
N/A |
Stops/vehicle |
Stops/vehicle |
Stops/vehicle |
Queue |
N/A |
N/A |
95 percent QSR |
95 percent QSR |
95 percent QSR |
Density |
N/A |
N/A |
Mean, LOS |
Mean |
Mean |
Collisionsa |
N/A |
a |
a |
a |
a |
Emissionsa |
N/A |
a |
a |
a |
a |
a Collisions and emissions are not usually directly predicted by the tool types described in this chart. The outputs of the traffic analysis tools usually must be input into the appropriate highway safety or emissions analysis software.
D/C = demand/capacity ratio, V/C = volume/capacity ratio, LOS = level of service, QSR = queue storage ratio,
N/A = not applicable.
Reconciling Tool Category MOEs
The key to reconciling MOEs between tools is to remember the focus and expertise of the tool (see figure 4). While a travel demand model can produce estimates of facility operation, that is not its focus nor its particular expertise. The HCM-type tools can also produce facility MOEs, but that is neither their focus nor their expertise. Simulation models and optimization models are the best source of facility-specific operations MOEs.
Reconciling MOEs between tools requires identifying the level of analysis being performed (bottleneck, facility, system) and which tools are best suited for that level of analysis. The MOEs produced by the less appropriate tool for the level of analysis should be considered less reliable than those produced by the appropriate tool.
Generally, it is best to report the MOEs produced by the more appropriate tool and discard the results produced by the less appropriate tool (see chapter 5 for more details). While it is certainly desirable to ensure that the results from both tools are similar, it is not worth the effort to make them identical. For example, the analyst might report the system-level demands and performance produced by the travel demand model but would report the operations results produced by the simulation model when reporting results for a specific facility. Both the demand and simulation models should agree that there is congestion on the facility, but they need not (and generally cannot be made to) agree precisely on the number of seconds of delay.
As previously explained, the objectives of the traffic analysis vary slightly by stage of project development. Thus, only rarely will the manager be able to select MOEs that are appropriate for every stage of the project development life cycle. Still, the manager can choose the appropriate MOEs for each stage of analysis, recognize when they will overlap and when they will supplement each other, and develop an analysis approach to address consistency issues as they arise.
For the early stages of the project development process (project initiation and project clearance), the manager should select MOEs that are appropriate for the system level of analysis. For the later stages of the project development process (project clearance, PS&E, construction, and operation), the manager should select MOEs appropriate for the facility level of analysis. Typical MOEs for each level of analysis are given in table 2.
Challenges of the Project Clearance Stage
The project clearance stage is unique in that both system-level and facility-specific MOEs are required. In addition, this stage requires extensive communication of results with decisionmakers and stakeholders; thus, the manager needs to identify indices for facilitating this communication.
The manager must employ a system analysis tool and a facility-specific tool to provide the broad-range MOEs required at the project clearance stage. The system-level tool can produce facility-specific results, but these will not be consistent with the facility-specific tool. These potentially inconsistent results must be translated into a consistent set of facility and system indices (such as level of service or demand/capacity ratio) for decisionmakers.
Reconciling MOEs at the Project Clearance Stage
In many cases, the facility will be a very small component of the system, and the facility performance results predicted by the system analysis tool will be similar to those produced by facility analysis tool. In this situation, the discrepancies are minor and can be ignored. The analyst simply reports the facility tool results for the facility and the system tool results for the system. The indices for each level of analysis are computed from the appropriate tool results.
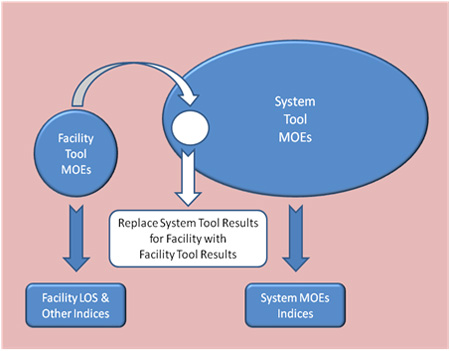
Figure 8 shows one approach that can be used to generate consistent facility and system results when the facility is a significant component of the system performance or when discrepancies between the tools are great. In essence, the analyst uses the facility tool to generate and report the facility results. The system results are reported from the system-level tool but only after removing the facility-level results computed by the system-level tool and replacing them with the facility-level results produced by the facility tool. The system MOE indices are then computed from the modified system-level results.
Figure 8. Chart. Reconciling facility MOEs, system MOEs, and indices.
The philosophy behind this approach is to use the most accurate tool to report the appropriate results, and together, the combined results will be more accurate for the system than the results of either tool alone.
This hypothetical case study is a continuation of the HOV/HOT lanes case study described in the previous chapter. The project need and purpose have already been prepared. The manager is in the process of developing the overall PDAP and needs to identify the proposed MOEs for the various stages of the project and to develop an approach for dealing with potential inconsistencies in the MOEs that may arise during the stages of the analysis process. A preliminary set of MOEs was identified in the previous chapter. This discussion elaborates and refines them in light of the material in this chapter.
The initial project concept was to construct HOV lanes. A potential alternative to this project is to initially construct the HOV lanes and then convert them later to HOT lanes with associated ITS infrastructure improvements. Another potential alternative is to use the freeway median for a future extension of rail service either in addition to or in-lieu of the HOV lanes.
The project manager must develop two sets of MOEs. Both sets must be sufficient to distinguish the relative benefits of the proposed project and its potential alternatives. One set, the system-level MOEs will be for the early stages of project development and for the environmental analyses during the project clearance stage. The second set of MOEs will be for the project (facility)-specific analyses needed for project clearance, PS&E, and later stages of the project development process. Both sets are summarized in table 5 and discussed in more detail in the following sections.
Table 5. MOEs for HOV/HOT lanes case study.
Project Purpose |
System-Level MOEs |
Facility-Level MOEs |
|---|---|---|
Reduce recurrent and |
VHD, average speed (mi/h) |
Average delay/vehicle, average speed, level of service |
Encourage HOV and transit use |
Mode split HOV, transit |
VPH HOVs, transit passengers |
Support regional air quality attainment goals |
Vehicle emissions |
(Report at system level only) |
Improve safety for motorists and agency maintenance workers |
(Report at facility level only) |
Collision rate per million VMT, collision rate during construction |
VPH = vehicles per hour.
Selection of System-Level MOEs
The system-level MOEs are proposed for the project initiation stage and for the environmental analysis in the project clearance stage.
Measuring Reductions in Recurrent and Non-Recurrent Congestion
To measure the reduction in congestion (and to support the objective of encouraging HOV and transit use), the accumulated PHD is selected for the system-level MOE. Computation of system-level non-recurrent congestion is not practical with the available tools, so no system-level MOE for non-recurrent congestion is proposed. A useful indicator of the system benefits for decisionmakers is a change in system average speed, so this index is proposed as well. It is relatively easy to compute from typical system analysis tool outputs (the ratio of PMT/PHT).
Measuring Changes in HOV and Transit Use
At the system level, the daily percent of trips made by mode (the mode split) is a convenient MOE. It is commonly reported by most travel demand models. The home-based work mode split is a reasonable indicator of peak-period mode choice and (depending on the mode choice model used) is likely to be most sensitive to changes in congestion.
Measuring Support of Regional Air Quality Goals
VMT by average speed for the system can be input into an emissions model to determine the effects on regional emissions. The desired MOEs, however, are changes in the tons of regional emissions coming from vehicular sources.
Measuring Safety Improvements
Generally, collision rates and the specific facility characteristics affecting them are not well known at the system level. Consequently, the focus is on reporting safety results for the specific facility rather than for the system as a whole.
Selection of Facility-Level MOEs
Facility-level MOEs are used for the project clearance and later stages.
Measuring Reductions in Recurrent and Non-Recurrent Congestion
To measure reductions in congestion, the average delay per vehicle during the morning and evening peak hours on the facility is selected. To aid decisionmakers, the peak hours' level of service and average speed are also reported. Given the lack of tried and true tools for predicting the variability of travel time and the lack of agency experience with predicting reliability, the manager has elected not to report any specific travel time reliability measures.
Measuring Changes in HOV and Transit Use
At the facility level, mode choice can be reported but is more difficult to obtain from most travel demand models. A more convenient measure at the facility level is the number of HOV vehicles, their average occupancy, and the number bus passengers using the facility.
Measuring Support of Regional Air Quality Goals
Air quality is a regional measure. It is less meaningful at the facility level, unless carbon monoxide hotspots are a concern. If a facility-specific measure is desired, then the facility VMT by speed bin can be used by an emissions model to compute facility-specific emissions.
Measuring Safety Improvements
The facility-specific collision history and design features can be used to estimate collision rates during and after construction.
Reconciliation Across and Within Stages
As previously noted, the facility analysis tool produces facility-level MOEs and the system analysis tool produces system-level MOEs. In this case, the regional travel demand model is used to compute the system-level MOEs. The regional freeway system is so large compared to the project facility that discrepancies in the facility-level performance between the system and facility analysis tools are unlikely to significantly affect the system results. Consequently, the regional travel demand model results for PMT, PHT, and PHD are reported without modification.
Quality Assurance to Reconcile Tools
As part of the quality assurance program developed with the PDAP, the manager identifies a task to compare the predicted average speed for the length of the facility (within the project limits) from the regional travel demand model and from the facility HCM-style tool to verify that the predicted morning and evening peak performance is similar. (Prior to performing this check, the analyst should have verified that the HCM-type tool was given the correct peak-hour demands produced by the regional demand model.)
Should significant differences in predicted speeds be observed, the analyst would review the capacities and free-flow speeds coded into the two models and revise the demand model values to cause the demand model to better match the speeds predicted by the HCM-type tool. Since the two tool types use different methodologies to predict average speed, it is neither necessary nor desirable that the tools use identical free-flow speeds and capacities. The objective is to get the two tools to predict similar speeds for the selected analysis periods, forecast years, and project alternatives. However, should there still be wide discrepancies after this check, the analyst may consider developing a custom speed-flow equation for the subject facility to better reconcile the two models. A wholesale change of speed-flow equations for all facilities in the demand model should be avoided because it will change the original demand model validation. The revised speeds and capacities will cause the demand model to modify its predicted demands. These revised demands (if significantly different) should be entered into the HCM-type tool before a second comparison of the two models is performed.