U.S. Department of Transportation
Federal Highway Administration
1200 New Jersey Avenue, SE
Washington, DC 20590
202-366-4000
Federal Highway Administration Research and Technology
Coordinating, Developing, and Delivering Highway Transportation Innovations
 |
| This report is an archived publication and may contain dated technical, contact, and link information |
|
Publication Number: FHWA-HRT-04-109
Date: September 2004 |
University: University at Albany, State University of New York (SUNYA)
Name of University Researcher Preparing Report: David R. Fitzjarrald, Atmospheric Sciences Research Center, SUNYA
NWS WFO: Albany, NY
DOT Office: New York State Department of Transportation (NYSDOT)
Name of Primary DOT Collaborators: Joe Doherty, formerly Anthony Sambuca
UCAR Award No.: S01-24243
The objectives of the project were to:
Useful progress was made on some of the original objectives. Though the team members at NYSDOT provided steady encouragement and goodwill, they became understaffed during the course of this project. As a result, the major focus of the project shifted from the points listed above to an effort to download data from a few sample NYSDOT RWIS sites. Researchers attempted to audit data quality from the RWIS sites by comparison with nearby NWS sites (the forth objective listed). The process was done manually for the most part; details were outlined in an earlier interim report. The three stations identified in figure 22 were analyzed, and their regression statistics are shown in table 23.
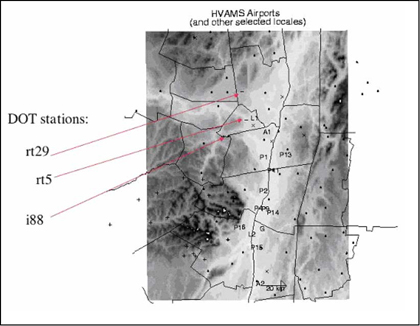 Notes: Stations P1 through P9 are NCAR weather stations deployed during October 2003 as part of the SUNYA Hudson Valley Ambient Meteorological Study. Red arrows indicate stations that were compared to NWS sites. |
| Figure 22. NYSDOT RWIS stations for which manually downloaded data have been analyzed. |
| Station | Period | Temperature | Humidity | Wind Speed | |||
|---|---|---|---|---|---|---|---|
| Intercept | Slope | Intercept | Slope | Intercept | Slope | ||
| i88 | 1- 95, 2002 | -1.2 | 1.00 | 0.5 | 0.79 | 3.1 | 0.88 |
| 195-366, 2002 | -1.2 | 1.00 | 0.2 | 0.88 | 1.7 | 0.30 | |
| 1-100, 2003 | -1.0 | 0.97 | 0.1 | 0.97 | 1.8 | 0.38 | |
| rt5 | 1-195, 2002 | 0.4 | 0.92 | 0.4 | 0.85 | 2.6 | 0.50 |
| 195-366, 2002 | 0.3 | 0.93 | 0.3 | 0.87 | 2.1 | 0.14 | |
| 1-200, 2003 | -0.2 | 0.94 | 0.2 | 0.91 | 2.2 | 0.19 | |
| rt29 | 1-195, 2002 | -1.4 | 0.99 | 0.2 | 0.89 | 2.1 | 0.55 |
| 195-366, 2002 | -1.2 | 0.98 | 0.1 | 0.89 | 1.5 | 0.18 | |
| 1-200, 2003 | -1.2 | 0.98 | 0.1 | 0.89 | 1.5 | 0.22 | |
Progress was made in determining how individual RWIS station reports differ from those regularly reported by the NWS at the Albany, NY, airport. This comparison is important, because forecasters currently rely on such "Class 1" stations for information. In a companion project, the Hudson Valley Ambient Meteorological Study (HVAMS), SUNYA deployed five HOBO®weather stations and nine sophisticated surface meteorological stations on loan from NCAR (at P1–P9 in figure 22).
RWIS stations are not sited ideally for capturing wind and temperature characteristics of the wider region; in fact, they were not designed to do so. The stations are often in locations near obstacles that affect wind and temperature measurements (such as foliage, structures or terrain) (figure 23).
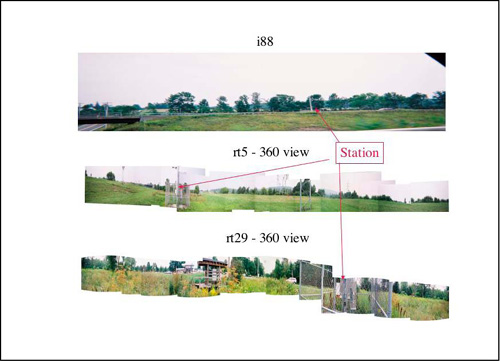 |
| Figure 23. Panoramic views of three of the weather stations studied. |
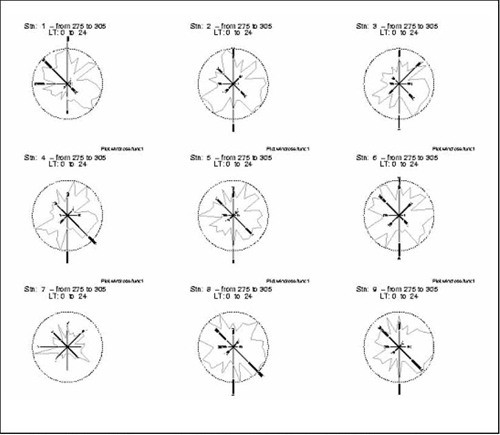
Figure 24 illustrates the kinds of analyses researchers attempted with the Statewide network of RWIS sites (the sixth and seventh objectives). Each station is illustrated by the "transmission factor" in gray (essentially the degree of blockage compared to an unobstructed station, the circle) and a "wind rose" (the solid bars) that shows the observed distribution of wind speed and direction. The key point is to illustrate the two competing ambitions inherent in this type of project. On one hand, NWS wants surface information that is as representative as possible of the area for it to be relevant to understanding the wider weather event. On the other hand, the State DOT wants to know the conditions directly at the road surface. Researchers will continue this work even though the COMET project is complete.
|
Notes: Stations P1 through P9 correspond to the stations depicted in figure 22. |
| Figure 24. Wind roses and transmission factors for surface weather stations. |
One obstacle to creating the New York Integrated Weather Data Network (related to the first three objectives) is continued delays in installing new RWIS sites and issues with the older RWIS sites that remain under the proprietary SCAN®software. For 2 years, SUNYA researchers acquired data through a tedious manual process, and data quality is still not up to standard. NYSDOT personnel are aware of the problems and are working with SCAN® manufacturers as they can, in an environment of drastically reduced resources. The details of these problems were described in the COMET project interim report of August 2003.
Researchers encountered a number of difficulties dealing with the contractor for the NYSDOT RWIS sites, as detailed in the interim report. The authors believe that data acquisition glitches are not fundamental; the glitches could be resolved eventually if State DOT personnel worked more diligently with the RWIS contractor. However, this work could not be completed by the end of this COMET project. Data assembled up to this point will be folded into the other surface data obtained during HVAMS. Thus, though the project with COMET is now over, certain aspects of the effort will continue. Data gathered to date, along with the NOAA's ASOS station reports, have been collated and are available at the researchers' anonymous file transfer protocol (ftp) site for public access.
Though NYSDOT's program to establish the network of low cost stations has been delayed indefinitely (fifth objective), making this task unachievable, researchers will continue to explore this possibility after the end of this particular grant.
In regard to the eighth objective, the plan was for SUNYA to begin research related to natural and artificial surface state prediction for the local area when the data were available in real time. SUNYA would have sought input from NWS staff in developing one-dimensional energy balance models that predict surface temperatures and state (i.e., wet, dry, icy, snowy) by determining the exchange of energy between the surface, the atmosphere above it, and the ground below it. The idea was to apply the models to both natural surfaces such as fields, and artificial surfaces such as roads, gaining valuable insight into the differences between the energy balances of different surfaces.
This work was postponed when researchers realized that the RWIS data downloads did not include information about the road surface temperature. The road temperature sensors are installed, and the observations appear in certain graphical displays. However, road temperature information did not survive the "exporting" command to the SUNYA database.
With the publication of the SUNY SLABS model paper, researchers are now in a position to apply this work to road surface state modeling.(3) However, for this and the remaining tasks not detailed, researchers cannot reasonably proceed until an archive of data from many stations is available. It was not anticipated that the major effort would be the initial data acquisition step; therefore, researchers have not been able to develop a database from a large number of stations.
In this study, the team of students and staff from the SUNYA Atmospheric Sciences Research Center (ASRC) did most of the data acquisition and analysis work. Throughout the project, NYSDOT personnel were very cooperative. In November 2002, NYSDOT contracted consultants to facilitate data availability. These consultants visited ASRC/SUNYA and the NWS WFO in Albany, NY; there was a subsequent meeting to solidify data requests. This work is still ongoing. Through the NYSDOT efforts, researchers logged onto NYSDOT computers, downloaded data from a small number of stations, and established the protocols for possible future work. One NWS partner helped demonstrate how additional surface information could be integrated into the NWS standard.
The SUNYA team will continue to work with the RWIS data it has. Without explicit resources, this will be done as work that can serve several broader goals. After the NYSDOT RWIS data network matures and data are readily available, the team will return to this problem.
This effort shows that the same data can serve several disparate purposes. Both NYSDOT and NWS have mandated responsibilities that require them to maintain a narrowly defined view regarding how data are managed. The mandates of weather forecasting and road surface treatments lead both institutions to seek real-time displays of information, and they have less interest in the history of events. The key element is to identify repeated patterns, such as stretches of roads prone to weather-related difficulties, and use this selective microclimatology to make generalizable models of road state and local meteorological effects that benefit both operational groups.