U.S. Department of Transportation
Federal Highway Administration
1200 New Jersey Avenue, SE
Washington, DC 20590
202-366-4000
Federal Highway Administration Research and Technology
Coordinating, Developing, and Delivering Highway Transportation Innovations
 |
| This report is an archived publication and may contain dated technical, contact, and link information |
|
Publication Number: FHWA-HRT-04-109
Date: September 2004 |
University: Desert Research Instate (DRI), University of Nevada System
Name of University Researcher Preparing Report: Darko Koracin, Ph.D.
NWS WFO: Reno, NV
Name of Primary NWS Collaborators: Mr. Jim Fischer, and formerly by Ms. Mary Cairns
DOT Office: Nevada Department of Transportation (NDOT)
Name of Primary DOT Collaborators: Mr. Richard Nelson, Ms. Inda Denise, and Ms. Pamela Klessig
Cooperative Project, UCAR Award No. S01-32790
Prediction of mesoscale weather features is extremely difficult where small-scale terrain features create large variations in weather over small distances. Locally high winds and heavy snow induced by the orographic features, and flash floods that occur in small drainage basins are examples of mesoscale weather features in the Western United States. To better evaluate these small-scale features, a dense network of weather observations is desirable. The addition of reliable and good quality State DOT weather stations that report at temporal resolutions of typically one hour provides data in areas critical to the protection of life and property.
According to our proposal, the primary goals of this project were to:
The proposed project was originally divided into the following main tasks. Partners with primary responsibility for each task are indicated in parentheses:
This multidisciplinary project was a valuable experience for the collaborating partners: NDOT, the NWS WFO in Reno, NV, and the DRI. The project resulted in significant advancements by accomplishing the following proposed main objectives:
NDOT Perspective: RWIS Network
NWS Perspective: Using NDOT Data to Improve Mesoscale Forecasts in Complex Terrain
DRI Perspective: Using NDOT Data to Improve Mesoscale Forecasts in Complex Terrain
DRI Perspective: Testing and Improving the NDOT Pavement Temperature Model
There is a significant need to improve road-related weather forecasts from the point of view of NDOT operations, and from a traffic and economic perspective. To address this issue, NDOT has implemented a variety of snow and ice control strategies, including developing a RWIS. The system includes a network of remotely located environmental sensor stations that collect, process, and disseminate information on road and weather conditions relevant to highway transportation.
Several major questions arise:
In the beginning of the project, researchers established the links and a data stream from the NDOT weather stations network to DRI and NWS. Programs were developed at DRI to automatically access and download the data from NDOT computers and integrate the data into the database of the Western Regional Climate Center at DRI. The operational Web site has been developed on the DRI server computer at http://www.ndot.dri.edu.
This site provides an interactive graphical display of the data. It is in continuous operation and receives all available NDOT data in two different formats and sampling intervals (10 and 15 minutes). Incoming data is archived. Researchers have been working with the NDOT staff to ensure a continuous stream of information and to include the newly established NDOT stations in DRI's Western Regional Climate Center information system. However, at the current time, some stations are not operational, some have changed their transmission software, some have not been transferred to DRI, and some are still reporting.
The DRI Web site provides access to statistical and graphical analyses of current and past data, including time series, wind roses, monthly and daily statistics, and the ability to download data of interest. Figure 10 shows the main page of the Web site with stations that are available for statistical and graphical analysis.
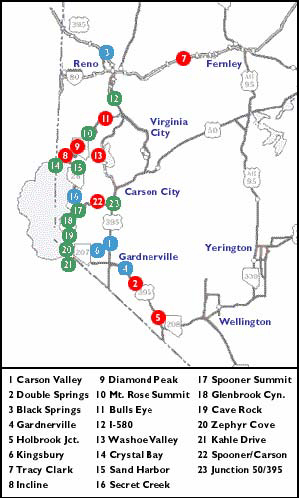 |
| Figure 10. Locations of the NDOT stations that are available for analysis on the DRI Web site. |
Recently, NDOT has undertaken major steps to reorganize their network of operational stations. Eleven sites have been upgraded, and five new sites have been installed. The Remote Processing Unit (RPU) type was upgraded from the Zeno® or Vaisala Milos models to the Vailsala ROSA Weather Station RPU. The Zeno® RPUs were used with the now defunct coastal system.
The Milos system will soon be obsolete, and replacement parts will be unavailable. However, parts salvaged from the upgraded sites will be available for troubleshooting the remaining sites operating on the Milos RPUs.
The 11 Nevada sites that were upgraded cover the following: Black Springs, Cave Rock, Diamond Peak, Gardnerville, Holbrook Junction, Kahle Drive, Mount Rose, Secret Creek, Spooner Summit, Tracy Clark, and the U.S. I-395/U.S. I-50 junction. The five new sites that are now functional include Highland Flats, U.S. I-580 at the NDOT Reno, NV, yard, Moundhouse, Toulon, and Walker Lake. With these sites, there are now 21 operational sites in District II. Eight sites are operational in District III, and work continues to bring additional sites online.
A new server has been installed to provide a redundant backup in the event of a major failure. In addition, the new server will provide an increased hard drive memory capacity and will operate at higher speeds.
The first goal was to establish a data assimilation system. This was the most difficult goal because of the state of technology when the project began. Frequent computer crashes and the use of dial-up modems between the NWS and NDOT challenged the information technology (IT) staff of both NWS and NDOT. By the second year of the project, file transfer protocol (FTP) procedures were set up, and faster computers were installed at both NWS and NDOT, which improved the reliability of data assimilation. Both NWS and DRI archived the data at the Western Region Climate center.
Data collection continues today and has been expanded to other areas of the State outside of the local Reno, NV, mesonet area. This change in scope to this project was not anticipated when the project was started.
The second goal was to improve NWS operational forecasts through better model guidance and knowledge. As mentioned in the proposal, NWS is in the process of implementing an NDFD. The proposal mentioned the resolution of this database would be less than 5.4 nm (10 km) and, indeed at this time it is at 1.3 nm (2.5 km) and will be reduced to 0.67 nm (1.25 km) some time in the future. This gives the NWS forecaster the ability to forecast weather at spatial and temporal resolutions far greater than previously possible. However, high resolution forecast models are necessary for guidance. Initialization of these models and the NDFD relies on a dense network of surface data, including the NDOT sites.
The NWS in Reno is using a local model at 4.9 nm (9 km) resolution and hourly time steps for some of the sensible weather elements in the NDFD, including wind and temperatures. The University of Utah's ADAS model has become a starting point for verifying the NDFD data, and a side benefit of the project is that NDOT data is entered into this model through Utah's MesoWest database.
Verification of high wind warnings and improved fire weather forecasts came as a direct result of this data. As an example, on June 30, 2000, a wildfire near Reno, NV, started near the Mt. Rose highway, where several of the NDOT sensors are located. Weather forecasters used the NDOT data to support fire weather forecasts for that fire. Also, several high wind warnings were verified using the Washoe Valley NDOT sensor. This sensor is sited in a particularly windy area, and several times a year trucks overturn due to high winds along this stretch of highway.
One of the main goals of this proposed study was to establish a data assimilation system for the MM5 at DRI. Figure 11 shows a schematic of the data assimilation and the weather forecasting system that uses NDOT data to improve model initial conditions. The improved weather forecasts were then used to improve results from the NDOT Pavement Temperature Model.
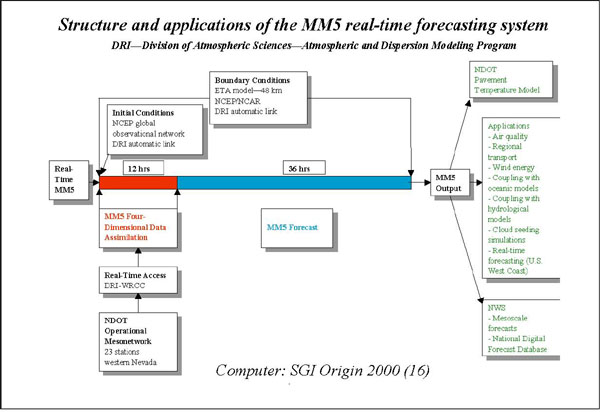 |
| Figure 11. A schematic of the DRI-developed real-time forecasting system that assimilates NDOT data in the first 12 hours of the pre-forecasting time. (NCEP is the National Centers for Environmental Prediction, NCAR is the National Center for Atmospheric Research, and SGI® represents Silicon Graphics Incorporated) |
To achieve the proposed objectives of the study, we applied our developed system shown in figure 11 to two winter storm cases. The forecasting periods were:
Case 1: Mesoscale modeling using NDOT data for March 7–9, 2002
Since the reporting and quality of data improved in the beginning of 2002, FDDA tests focused on a case study of a significant snowstorm that occurred during March 7–9, 2002. During that time, 11 stations were reporting. During the same period, the National Center for Atmospheric Research (NCAR) in Boulder, CO, and DRI were conducting the Integrated Sounding System field program in the Reno, NV, and Washoe, NV, basins. Surface and upper air measurements were collected at two locations from February 26 to March 26, 2002.
A heavy snowstorm occurred in the Sierra Nevada Mountains during March 6–8, 2002, with a maximum snow-water equivalent of 77.97 centimeters (cm) measured on March 8 at the Central Sierra Snow Lab in the Donner Pass area near Truckee, CA. A frontal system passed over the Reno area on March 8 at 02:00 universal time coordinated (UTC) with measured rain amounts of 5 to 10 millimeters (mm). The system was associated with a strong southerly flow preceding the front. It appears that this frontal system was merging with the significant moisture advection from southern California and over the Central California Valley. Radar images showed wide areas of convective precipitation moving from the valley over the Sierras. The precipitation started over the Sierras on March 6 and propagated into the Reno area later on March 7. Severe driving conditions on I-80 due to gusty winds and snow were reported in the area, especially east of Reno near Fallon, NV.
This snowstorm event has been simulated with the DRI MM5 real-time operational model using a coarse grid with 18-km horizontal resolution (133 x 121 x 28 grid points) and a nested grid with a horizontal resolution of 6 km (148 x 169 x 28 grid points). The setup of the MM5 modeling domains is shown in figure 12.
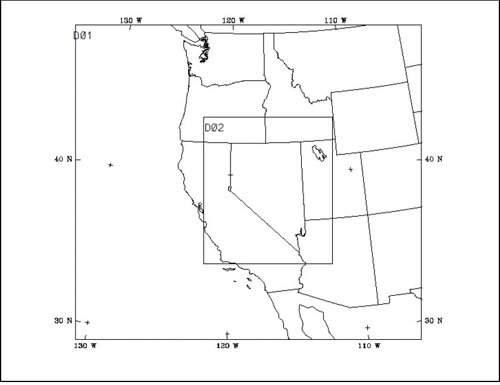 |
| Figure 12. Geographical setup of the real-time MM5 forecasting domains. |
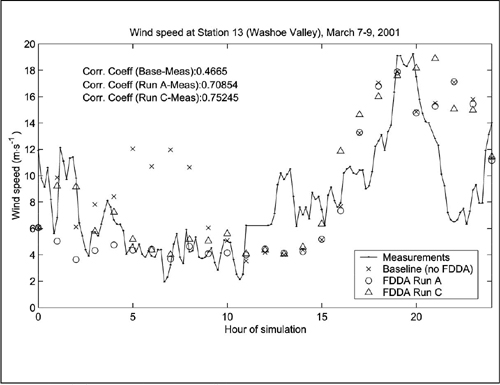
The model was able to forecast a frontal system passing through Reno, NV, on March 8, 2002 between 00:00 and 02:00 UTC. The main objective of the study in this period was to use FDDA to improve the accuracy of the MM5 forecasts. Results indicate that the two major FDDA parameters are the nudging coefficient and the radius of influence of the data that is being assimilated into the model.5 In addition, it is important to use an optimum set of stations; however, it should be emphasized that each of the surface stations has micro location specifics and generally is not representative for the larger area that needs to be captured by the model. Figure 13 shows a wind speed time series comparing NDOT Station 13 data (Washoe Valley, 39°16' 26.28" N, 119°49' 7.90"W) with the model results without data assimilation (base case) and with several FDDA runs with varied nudging coefficients, radii of influence1, and a number of selected stations entered into the FDDA system.
|
Run A: radius of influence = 240 km, nudging coefficient = 4e-3. |
| Figure 13. Time series of wind speeds measured at NDOT Washoe Valley station and simulated with MM5 without FDDA, with Run A FDDA options, and with Run C FDDA options. |
The figure clearly shows the efficiency of using NDOT data in the FDDA mode to improve the accuracy of forecasts. Both the A and C FDDA tests agree better with measurements than the MM5 run without data assimilation (baseline simulation). The correlation coefficient is significantly greater in the FDDA cases (0.71 and 0.75) compared to the baseline case without data assimilation (0.47).
Case 2: Mesoscale Modeling Using NDOT Data for March 1–2, 2003
The system was also tested on a case from winter 2002/2003. An unusually late winter storm occurred in western Nevada in the beginning of April 2003. The storm was characterized by an intense frontal system, high winds, a significant drop in temperature, and snow showers. The severity of the weather conditions can be illustrated by the radiosonde observation taken before and during the storm (Figure 14).
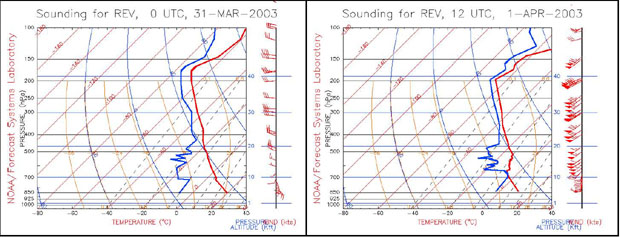 |
| Figure 14. Vertical profiles of temperature, dewpoint temperature, and winds measured by radiosonde in Reno, NV, on March 31, 2003 at 00 UTC (4 p.m. local time) (left panel) and on April 1, 2003 at 12 UTC (4 a.m. local time) (right panel). |
The figure shows a large temperature drop below 500 millibars (mb) during the storm as compared to the pre-frontal sounding. There was a significant increase of moisture in all tropospheric layers and consequent increase of atmospheric instability, clouds, and precipitation. The westerly winds increased significantly in the atmospheric boundary layer and at all elevations, with peaks to about 80–90 knots aloft.
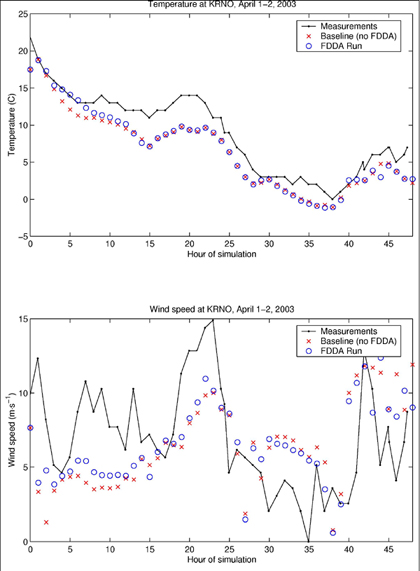
Figure 15 shows a time series of measured and simulated air temperature and wind speeds for the April 2003 case. The figure shows the MM5 simulations for a baseline run and an FDDA run. The simulations were able to reproduce the observed strong, almost monotonic drop, in temperature of about 20°C within 36 hours. The model runs that used assimilated NDOT data compared better with measurements for both temperature and wind speed.
 |
|
Figure 15. Time series of temperature (upper panel) and wind speed (lower panel) at the Reno, NV, station for the period from April 1–2, 2003. |
In the later phase of the study, researchers obtained the code for the pavement temperature forecast model. The model was installed and setup on a computer. For the remaining time on the project, researchers tested the code and examined various input data options. In particular, they focused on meteorological input parameters such as air temperature, dewpoint temperature, humidity, cloudiness, radiation, and precipitation.
NDOT has been using an IceCasttmi 6Pavement Model to coordinate its winter operations. IceCast is a numerical model of surface pavement temperature and surface conditions. This is essentially a surface-heat balance model, in which the surface temperature responds to changes in the various heat fluxes that affect the pavement. A schematic of the basic components of the model is shown in figure 16.
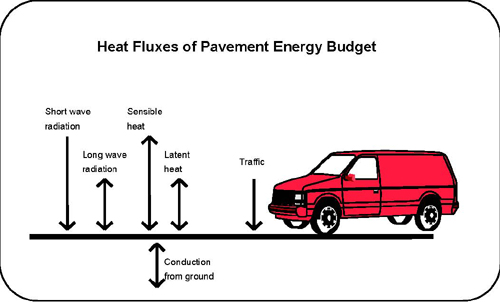 |
| Figure 16. A schematic of the NDOT pavement temperature model with its major physical components. |
The main inputs to the pavement temperature model are technological and meteorological parameters. To the authors' knowledge, the sensitivity of the forecasted pavement temperature on the meteorological inputs is not known or documented. Consequently, researchers examined the effects of changes in the meteorological input parameters on the forecasted pavement temperature obtained by IceCast. In particular, they examined how the minimum pavement temperature would change if each of the meteorological parameters was changed.
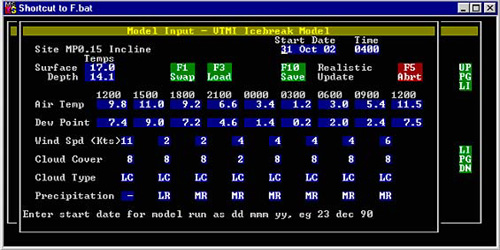 |
| Figure 17. Computer screen with a menu for predicted meteorological parameters to be input for the pavement temperature model run. |
These necessary meteorological inputs have been extracted from the MM5 real-time forecasts for the period of interest at all locations at which the pavement model will generate forecasts. Figure 18 shows the stations for which the NDOT data exist for the test case.
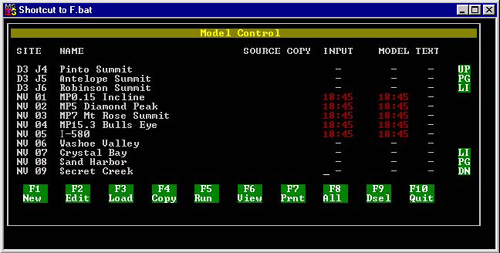 |
| Figure 18. Computer menu screen with a list of stations for which the pavement temperature forecast can be obtained. |
After all data are input, the model computes the predicted pavement temperature at each of the considered stations. An example of a time series of the pavement temperature at the Incline Village station is shown in Figure 19.
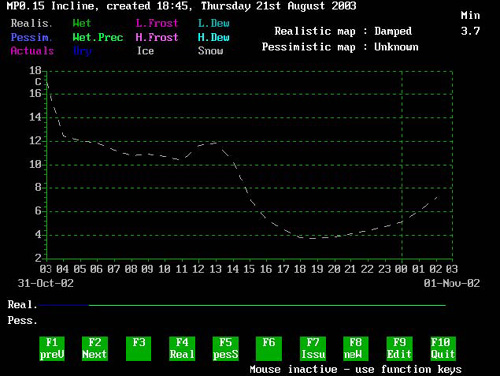 |
| Figure 19. A time series of the forecasted pavement temperature at the Incline Village station for the test case for the period of 3 a.m. on October 31, 2002, to 3 a.m. on November 1, 2002. |
The first step of testing the effects of the meteorological input on the pavement temperature model took the MM5 results for the first case study (March 7–9, 2002) as a baseline simulation. Then researchers changed each of the input meteorological parameters by a certain value and ran the pavement model for each of these cases. The final results are shown in figure 20. Various line colors and symbols indicate sensitivity tests in which meteorological variables were changed with respect to the baseline run. The specific change for each test is shown in the legend on the right side of figure 20. These tests resulted in a large variation in the minimum pavement temperature, ranging from –7 to –12°C.
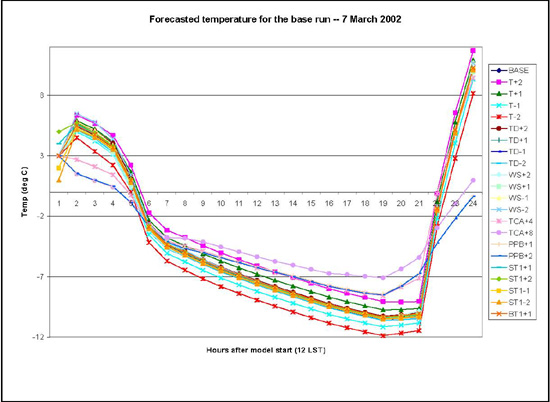 |
| Figure 20. Time series of the pavement temperature predicted by the NDOT IceCast Pavement Model for various changes in meteorological input parameters with respect to the baseline run. |
Because the minimum temperature is a crucial parameter for road conditions, researchers analyzed the effects of each input parameter on the minimum pavement temperature. Figure 21 shows results from the sensitivity tests that can be used to identify the most important meteorological inputs for the pavement temperature model.
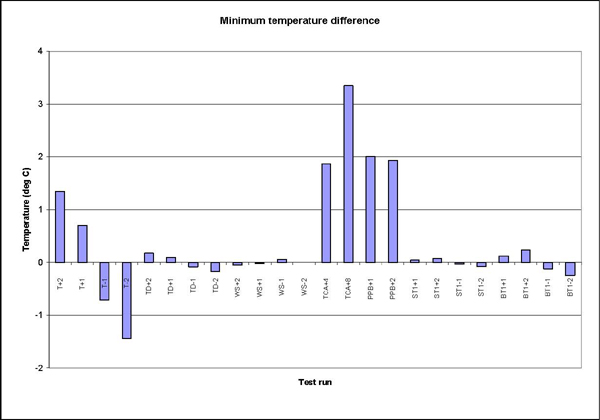
T = temperature; TD = dewpoint; WS = wind speed; TCA = total cloud cover; PPB = precipitation; ST = surface temperature; and BT= depth temperature (-25 cm). |
| Figure 21. Change of the predicted minimum pavement temperature as a function of changing meteorological inputs by step units. |
Figure 21 indicates several important features. Predicted pavement minimum temperature appears to be mostly sensitive to a change in air temperature, as well as to the total cloud cover and precipitation. Inaccuracies in the air temperature of 1 and 2°C induce a change of the minimum pavement temperature of more than 0.5 and 1°C, respectively. Significant underestimation of precipitation can yield a change of the minimum pavement temperature of about 2°C, while inaccurate prediction of cloudiness can yield the change of the minimum pavement temperature of more than 3°C.
The project results were presented at meetings in Washington, DC (September 17, 2002), Albany, NY (Aurora Board Meeting, August 26, 2003), and at the 10thAnnual Workshop on Weather Prediction in the Intermountain West.(2)
Researchers completed all major components of the proposed study as stated in Section 1 and elaborated above, but did not have an opportunity to work with the NDOT to develop a travelers' forecast system. Instead, researchers developed a dedicated Web site that can be used to catalog and access the data and process them numerically and graphically.
The main problems of establishing the NDOT data network and incorporating data into the information network were solved during the first year. However, there are still problems with data recovery, data reliability, nonexistent detailed quality check controls, and interrupted communications.
Regarding the NWS partner, the main problem was that the co-primary investigator left NWS in the summer of 2002, and the collaboration with the NWS Reno, NV, office was interrupted after her departure. Fortunately, the new Science Operations Officer at the NWS Reno, NV, office was helpful in completing the project.
Regarding DRI, the main problem was computational resources. To solve this problem, computers that run the Linux operating system will be used in the future. Researchers learned that the MM5 real-time model setup (forced by the available computer resources) with a horizontal resolution of 18 km and 6 km is not sufficient to resolve details of the mesoscale weather. Resolutions of less than 3–4 km are needed for more accurate mesoscale forecasts.
Researchers demonstrated that assimilating the NDOT data can improve MM5 real-time forecasts and consequently improve the predicted pavement temperature. However, they believe that the use of upper-air measurements such as remote sensing would provide stronger guidance to the model in improving mesoscale forecasts. Even one or two remote sensing instruments (such as wind profilers and acoustic sounders) in the mesoscale area would provide data that would most likely improve the meteorological performance. An additional benefit would be the use of the vertical profile data from these remote sensing instruments to improve NWS operational forecasts.
Links with DRI/NWS/NDOT regarding inputs and use of the NDOT pavement model for sensitivity tests using actual forecast data from the MM5 model were resolved in the final stage of the project. The pavement temperature model was obtained and sensitivity tests were performed as promised in the proposal.
Because operations is the primary line of work for NDOT and NWS, a research component that improves operations is still an additional (secondary) effort.
NDOT's primary role was to provide access to the RWIS meteorological stations, perform and improve necessary sensors and communication protocols, and establish computer links between the DRI's Western Regional Climate Center and NDOT. NDOT has improved the monitoring network significantly and, jointly with DRI, improved data acquisition, data processing, communication software, and the Web-based data presentation.
The NWS was responsible for assimilating data and using it in it the forecast process. This was done and continues to this day. NWS also distributes this data to other interested parties, including the University of Utah and the Western Region Climate Center. This data, when used for verification of high winds, is also archived in the Storm Prediction Center's database as a severe weather report. NWS has gained more experience running local mesoscale models by installing the workstation Eta and MM5 on local Linux machines.
In addition to coordinating the overall project, DRI's primary role was to develop methods of using NDOT data to improve mesoscale forecasts and, consequently, the pavement temperature predictions. DRI managed to operationally incorporate and archive data from the NDOT stations into the database of the DRI Western Regional Climate Center. NDOT data is being included in the University of Utah's MesoWest database, which includes over 3000 automated sites in the western United States. This database has a wide range of uses, including initialization of local mesoscale models such as the MM5 and Meso Eta.
In addition, DRI provided guidance and assistance in designing the sampling times, requirements, and software analysis for the NDOT network data. DRI set up a dedicated Web site for NDOT data access, statistical evaluation, and graphical representation.
DRI gained significant experience and expertise in using the MM5 FDDA technique and demonstrated that the use of the NDOT data improves the accuracy of the mesoscale forecasts in complex terrain.
Due to delays caused by some problems encountered during the execution of the projects (as described in the previous section), there are several issues remaining that should be addressed, if the funding and time are available. The main component to be completed would be to integrate the pavement temperature model with the MM5 real-time operational forecast into the unique forecasting system.
A travelers' forecast, including all aspects of road and traffic conditions, has not been realized. NDOT, NWS, and the community in general would use this forecast. Researchers will continue to work with NDOT to complete the project, which supports the NWS goal of creating new and innovative products. A Web site should be established with all relevant information on weather and road and traffic conditions. This information should be shared with broadcasting companies.
This project was a very valuable experience and provided great benefits in linking the NDOT operations, NWS forecasting, and university (DRI) research and applications. The partnerships formed for this project will be lasting and will go beyond the scope of this particular project. For future projects, it would be valuable to ensure some dedicated time to the NDOT collaborators (whose main priority is to work on direct NDOT operations) to accomplish projected objectives.
Regarding possible future projects, it would be essential to evaluate the quality of the NDOT station data and write detailed quality assurance software that continuously would report the status of all stations in real or near-real time.
A comprehensive evaluation of the use of the NDOT data and a plan for additional possible use should be conducted.
It also would be valuable to perform a comprehensive study to verify mesoscale weather forecasts and actual predictions of the pavement temperature. The particular pavement temperature model used by NDOT should be analyzed critically and compared with other pavement temperature models used worldwide. New techniques such as artificial neural networks (ANNs) should be tested as possible options and improvements.
5 FDDA is a method of including present and past data in a numerical model. The data incorporated in the model continuously correct (nudge) model results toward measured data at the point where the measurements took place and also for model results within a certain radius (the radius of influence) of the measurement point.
1 The model corrects its results strongest at the measurement point and weaker as it goes further from the point within the radius of influence.
6 IceCasttmi is a pavement temperature model of the Vaisala Corporation