U.S. Department of Transportation
Federal Highway Administration
1200 New Jersey Avenue, SE
Washington, DC 20590
202-366-4000
Federal Highway Administration Research and Technology
Coordinating, Developing, and Delivering Highway Transportation Innovations
 |
| This report is an archived publication and may contain dated technical, contact, and link information |
|
Publication Number: FHWA-HRT-04-109
Date: September 2004 |
University: Iowa State University (ISU)
Name of University Researcher Preparing Report: William A. Gallus, Jr.
NWS WFO: Des Moines, IA
Name of Primary NWS Collaborator: Karl A. Jungbluth
DOT Office: Iowa Department of Transportation
Name of Primary DOT Collaborator: Dennis Burkheimer
Cooperative Project, UCAR Award No. S01-32791
The project originally proposed to develop a time-series prediction system for parameters needed as input by a frost deposition model (road surface and air temperatures, air dewpoint, winds) by training an artificial neural network (ANN) on meteorological observations and model output. The project's objectives also included comparing RWIS observations with those of standard ASOS/AWOS instruments to determine the quality of the data. In addition, plans included working with the NWS WFO so that they could use the neural network system to improve forecasting of other parameters.
MOS data were gathered from the NWS NGM model for the 3-year period (1996–1998) that matched the frost observation record period. Researchers also collected an appropriate data set of RWIS measurements. They accessed the RWIS archive valid over this time period, interpolated the data to a standard 20-minute time interval, performed some quality control of the data, and flagged those time periods when gaps between observations exceeded 4 hours or could interfere with important time periods when frost was possible.
The corrected and usable data from both MOS and RWIS observations were organized into a very large database, which was used to train the ANN. The training set used 85 percent of all of the data, with the remaining 15 percent saved as a test set; 181 possible inputs to the model were tested. It was decided that the best approach would be to limit the inputs to the 8–10 found to be most important for each parameter. Programs were developed to collect the data automatically in real-time with a regular 20-minute resolution for future applications.
Staff tested several different neural network configurations to predict the four variables needed as inputs for the frost prediction model—roadway surface temperature, air temperature, dewpoint, and wind speed. Despite the ANN's ability to predict multiple outputs with one model, it can only predict at one point in time. Therefore, researchers determined that the best way to predict the necessary parameters with a time frequency of 20 minutes was to create separate neural network models for each weather parameter. Consequently, 288 neural network models were needed for the 4 weather parameters. Many configurations were tested to determine the best one for each parameter at each time.
When validation was done over the entire training and test set, the ANN predictions correlated well with the RWIS observations and generally performed better than the NGM MOS output alone. However, for the test set, the ANN predictions of temperature and wind speed were better than MOS only for the first few hours of the prediction period (corresponding to forecasts 6–9 hours in the future). MOS forecasts had smaller root mean square errors (RMSE) later in time. The ANN had smaller RMSEs for wind speed, but the smaller average errors were achieved by always forecasting light winds, even when strong winds occurred. MOS does not include a forecast for roadway temperature. Thus, the ANN system provided much better forecasts during daylight hours when compared to the 2-meter MOS air temperature as a proxy for road temperature. At nighttime, the ANN showed a small improvement over the crude estimate based on MOS. In general, the errors with the ANN system were smaller than those obtained from three mesoscale models. The mesoscale models ran with two different sets of initial conditions for the Maintenance Decision Support System (MDSS) project1 in Iowa during the winter of 2003. As in that project, dewpoint errors are much larger than temperature errors.
The ANN output was then tested in the frost deposition model for the winters of 1996–1998, 2001–2002 and 2002–2003. The verification statistics for the winters of 1996–1998 were provided by the Iowa DOT. During this time, "yes" and "no" observations of frost were made by maintenance personal looking out the windows of their vehicles on the way into work. Therefore, great uncertainty is present about the quality of the verification statistics. The ANN-based predictions of frost for this period were not particularly good. False alarm rates were very high—generally .90 to .98 at most stations tested. Probability of detection tended to be in the .2 to .6 range. Although the lack of skill in the forecasts was likely partly related to poor verification data, it was observed that the ANN system often predicted a dewpoint exceeding the air temperature. This is a physically impossible condition, and it stems from the independent nature of the ANN models forecasting each parameter.
For the winter of 2001–2002, frost verification data was available from an Iowa DOT-sponsored project in Ames, IA, where Iowa State University (ISU) students closely monitored a bridge in the region during the early morning hours. These "yes" and "no" frost observations are believed to be highly accurate, although frost is a very microscale phenomena, again complicating interpretation of verification data. For this period, the ANN predictions were very accurate, nearly matching the forecasts made after the fact when RWIS data from Ames, IA, were fed to the frost deposition model. Thus, for this period, the ANN forecast approached the "best" value that might be expected. False alarm rates (FAR),2 though still high, were around 0.56. The probability of detection (POD)3 was 0.57. Even more promising, the forecasts were much more skillful than those of the private forecasting firm that had been contracted by the Iowa DOT to forecast frost during this winter.
In the winter of 2002–2003, the Ames, IA, frost verification project was expanded using Aurora4 funding, so that three bridges were monitored. This again complicated verification. Data for verification were not available until the end of the COMET project, and thus verification statistics are preliminary. It appeared that forecast skill was much less in 2002– 03 than in the previous winter, with the FAR rising to 0.79, and the POD falling to 0.30. Nonetheless, the threat score, a combined measure of skill, was still comparable to that of the private firm the previous winter. At the time of this report, no other verification data was available from 2002–2003 for comparison to the ANN.
In summary, the ANN forecasting system showed promise, and the performance during the 2001–2002 winter was very encouraging. The fact the system earned much better scores than a contracted forecasting agency also was considered a success. However, some other winters exhibited much worse performance of the ANN system. The independent nature of the predictions for different parameters allows for some nonphysical situations to be predicted. An improved ANN system in the future could predict the dewpoint depression instead of temperature and dewpoint as separate quantities. This would avoid the problem of unrealistic forecasts and may help improve performance.
Detailed comparisons of RWIS and AWOS/ASOS observations were performed. During the COMET project, a separate initiative was established at ISU to combine all mesoscale data into one convenient mesonetwork, known as the Iowa Environmental Mesonet (IEM). Several meetings occurred at ISU that included NWS Des Moines personnel, Iowa DOT personnel, and other interested parties from State agencies. Establishing the IEM enhanced the ability to compare RWIS observations to more standard meteorological observations of surface conditions, particularly ASOS readings.
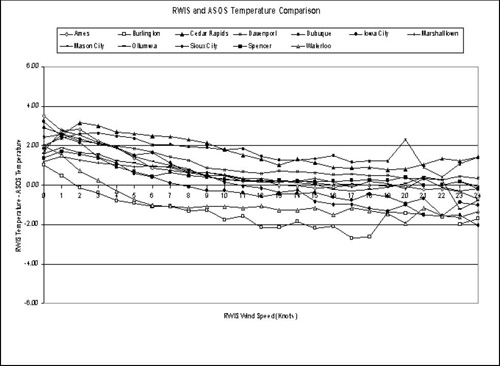
A thorough comparison was performed for several weather parameters by averaging RWIS and ASOS or AWOS data over an entire year. The comparisons suggest that RWIS temperature readings have a high bias when wind speeds are light, with the worst problem at the lightest wind (figure 7). This behavior is expected because RWIS sensors are not aspirated, while ASOS and AWOS are aspirated.
 |
|
Figure 7. Comparison of RWIS temperatures with ASOS temperatures as a function of RWIS wind speed for 12 stations. |
RWIS winds also typically read a few knots less than AWOS/ASOS (figure 8) at the stations where RWIS sensors were within 8.7 nautical miles (nm) (16.1 kilometers (km)) of AWOS or ASOS sensors. Although both platforms are designed to record wind at the same elevation (32.8feet (ft) or 10 meters (m)), many RWIS platforms are sited in ditches that may somewhat shelter the instruments. Average wind speeds were computed for RWIS and ASOS instruments as a function of wind direction (octants) at 12 stations. The impact of siting clearly can be seen when average wind speed differences vary from around zero at a particular site for a given wind direction to roughly 3 knots for other directions, a roughly 40 percent decrease in magnitude from the ASOS values. The RWIS values are less than the ASOS for most directions at all sites.
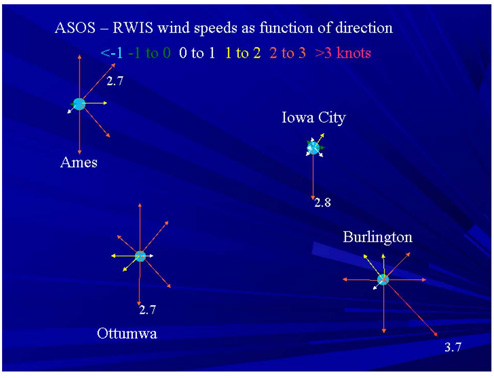 |
| Figure 8. Comparison of ASOS-RWIS wind speeds as a function of direction for four stations. |
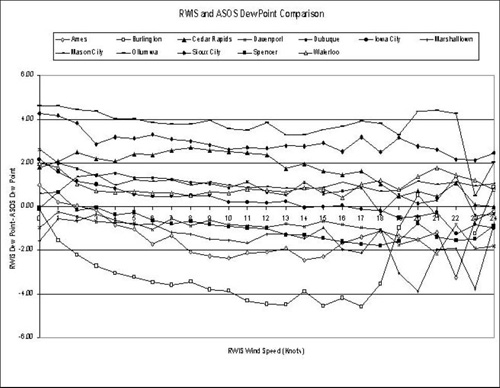
Comparisons of other parameters as a function of hour of the day or of wind speed also were performed. See figure 9 for the comparison of dewpoints. It appears that systematic differences can be quantified; this should allow for calibration to improve use of the combined data set. At the time of this report, a paper on the comparison was being developed. Some of the results were discussed at COMET/FHWA meetings in Washington, DC, in September 2002 and in Albany, NY, in August 2003.
 |
|
Figure 9. Comparison of RWIS dewpoint temperatures with
ASOS dewpoint temperatures as a function of RWIS wind speed for 12 stations. |
In addition to the detailed comparisons discussed above, researchers established a Web site that allows direct comparisons between the different measuring systems in real time. It can be accessed at http://mesonet.agron.iastate.edu/compare/. Some results from these comparisons were published in the preprints of the 18thInternational Conference on Interactive Information and Processing Systems (IIPS) in Orlando, FL, January 2002.
The graduate student also explored an additional use of neural networks designed to assist the NWS Des Moines office in forecasting. A neural network predictive system for warm season quantitative precipitation forecasting (QPF) was designed. For this neural network system, the technique of Hall et al. was followed.(1A neural network was trained on data collected from the NWS Eta model and soundings valid for both Omaha, NE, and Davenport, IA, (DVN) over the warm seasons of 1998–2001. More than 30 variables were used as input parameters in the model. Results using just the Omaha (OMA) data were very encouraging, so more than 400 cases from Davenport (DVN) were added to expand the number of patterns used by the neural network. The expansion was necessary because early results implied some memorization or over parameterization might have been occurring. Results using the OMA and DVN data together indicated that the neural network system still performed better than either the operational Eta model, or 10-km meso-Eta simulations in predicting 24-hour rainfall, particularly for heavier amounts that are generally unpredictable in grid point models. However, combining the data seemed to harm the results, because errors were larger than using OMA alone.
Results from the Omaha, NE, training were presented at the 18thInternational Conference on IIPS in Orlando, FL, in January 2002. A discussion of all results was given at the U.S. Weather Research Program Science Symposium in Boulder, CO, in April 2002 and at the World Weather Research Programme's QPF Conference held in September 2002 in Reading, United Kingdom. The neural network system based on the combined data was run in real time during summer 2002, and results were made available to the NWS via a Web page. In this real-time test period, the system was altered to allow inputs directly from the Eta model instead of a mixture of model and rawinsonde output. This allowed forecasts to be made at grid points across Iowa. This output was also made available via the Web page. The summer 2002 test, however, indicated a high bias in the neural network predictions. It appears that some calibration would be necessary to improve the forecasts.
There were no changes to scope of this project. Researchers benefited from a running start on the neural network modeling and by the fact the IEM project allowed for easier-than-expected comparison of RWIS observations to ASOS and AWOS.
No serious problems were encountered in conducting the research, apart from some Microsoft Windows®operating system-related computer crashes that occasionally caused data losses.
The primary method of interaction during this project occurred through occasional meetings, phone calls, and e-mails with the NWS Des Moines office and the Iowa DOT. The vast majority of the work, because it involved very site-specific neural network software, occurred at ISU. The Iowa DOT's involvement extended beyond the 2.5 years of this project, because they provided the 1996–1998 frost observations before the start of the COMET project.
Creating a neural network forecasting system is very labor intensive. Much of the project period was used to gather all necessary data, quality control the data, and enter it into the appropriately formatted input tables required by the ANN software. Although extensive testing was performed to find the best neural network models for each parameter, there are enough degrees of freedom to the problem that additional improvements would be likely if more experimenting could be done with the ANN software.
A future project evaluating the forecasting skill of a combined MOS-ANN system could benefit both the Iowa DOT and NWS. In addition, it may be possible to run an ensemble of MOS and ANN systems. The mean would likely provide the most valuable input to the frost deposition model. Also, an ongoing project at ISU has hinted that a mesoscale model such as MM5 may have more skill than the NGM-MOS that was used to train this project's ANN. It would be very interesting to test the performance of an ANN system that used MM5 output for training instead of NGM-MOS. When this project began, there were only 3 years of RWIS data useful for training. That period has now nearly doubled. With all ANN systems, the more data to train on, the better the forecast skill. In summary, this project clearly showed that with more study, artificial intelligence systems such as neural networks may offer valuable improvements in forecasting.
Although researchers were able to follow the original scope of work closely without major problems, it was still difficult to emphasize one core project of significant benefit to both the Iowa DOT and NWS partners. In fact, of the five groups that received funding, this was the only group whose main focus was not primarily to create a mesonet (merger of DOT data with NWS and other data sources). The creation of the mesonet is perhaps the only project that seems to benefit both partners roughly equally. Even this project included a task involving mesonet applications—the comparison of RWIS data with ASOS and AWOS. This project may have differed from the others, because the Iowa DOT has a long history of being at the cutting edge of initiatives. Researchers had access to the Iowa DOT RWIS data before the COMET request for proposal, and the establishment of the Iowa mesonet was likely the furthest along of any such effort in the Nation. It is possible that future combined COMET/FHWA projects will primarily assist the Iowa DOT or the NWS, but not both, unless the project simply manipulates multiple data sources. Traditional COMET projects benefit the NWS. Future FHWA collaborations may yield very little interaction and direct benefit to the NWS. For this project, the data comparison was believed to help the NWS, and they were welcome to use the ANN system. However, the system was designed to forecast road frost, which is something the NWS is not permitted to do. Thus, at best, the NWS would only be able to use the software system secondarily.
1 MDSS: A large, multiagency project that began with a prototype experiment in Iowa in winter 2002-03. The goal was an automated system that uses weather data as accurately as possible and that is easy to read and understand, and that recommends courses of action for road maintenance.
2 FAR: A measure of how often an event is forecast and fails to materialize; lower numbers are desirable.
3 POD: A measure of how often an event is forecast and does occur; higher numbers are desirable.
4 Aurora is an international program of collaborative research, development and deployment in the field of road weather information systems (RWIS), serving the interests and needs of public agencies.

