U.S. Department of Transportation
Federal Highway Administration
1200 New Jersey Avenue, SE
Washington, DC 20590
202-366-4000
Federal Highway Administration Research and Technology
Coordinating, Developing, and Delivering Highway Transportation Innovations
 |
| This report is an archived publication and may contain dated technical, contact, and link information |
|
Publication Number: FHWA-HRT-04-131
Date: September 2004 |
The purpose of the sensitivity analysis was to determine which weather-related traffic parameters have the greatest impact on the quality of traffic flow. It was necessary to identify the most sensitive weather-related parameters to develop the guidelines for using CORSIM in modeling adverse weather conditions.
The sensitivity study showed how these parameters impacted the quality of traffic flow. Various geometric configurations and congestion levels were tested to get a complete assessment of the overall sensitivity of a parameter.
The sensitivity study started with a baseline case created using the default values for the parameters. The sensitivity study focused on changing one parameter value at a time, regenerating the MOEs, and comparing the new MOEs to the baseline case.
This method was found to be limiting, but within the scope of this project. A potentially more detailed and realistic sensitivity test would be to change multiple parameter values at once, to model specific weather events. This method was not within the scope of the project and would result in exponentially increased data processing and analysis efforts. It should be considered for future sensitivity testing efforts.
The sensitivity study was divided into two major groups: sensitivity of parameters on freeway facilities using Freeway Simulation (FRESIM), which is the simulator within CORSIM that models all freeway facilities; and sensitivity of parameters on arterial streets using Network Simulation (NETSIM), which is the simulator within CORSIM that models all arterial and local streets.
A number of different geometric scenarios, or networks, were developed to test the sensitivity of the parameters under various roadway configurations using the FRESIM model in CORSIM. For example, a parameter may not show any sensitivity on a basic freeway segment, but show high sensitivity on a short weaving area. The networks developed for the FRESIM sensitivity analysis are shown in table 8.
All networks were assumed to have ideal conditions as defined in the HCM, including 3.65-m travel lanes, level grade, no horizontal curves, and no heavy trucks.(2) All freeway segments were assumed to have a free-flow speed of 113 km/h, while all on- and off-ramps were assumed to have a free-flow speed of 72 km/h. Also, an analysis period of one hour was used for all simulation runs.
Table 8. FRESIM Sensitivity Analysis Networks.
Network Name |
Description |
|---|---|
| One-lane basic segment |
One-lane freeway with no on-or off-ramps, 1.6 km long. |
Two-lane basic segment |
Same as the one-lane basic segment, except with two freeway lanes. |
Three-lane basic segment |
Same as the one-lane basic segment, except with three freeway lanes. |
Two-lane merge area |
Two-lane freeway with a single on-ramp, with a ramp volume of 500 veh/h and 230 m acceleration lane. |
Three-lane merge area |
Same as the two-lane merge area, except with three freeway lanes. |
Two-lane diverge area |
Two-lane freeway with a single off-ramp, with an exiting ramp volume of between 300 and 750 veh/h (fixed at 15% of freeway volume) and 230 m deceleration lane. |
Three-lane diverge area |
Same as the two-lane diverge area, except with three freeway lanes. |
Two-lane weave area |
Two-lane freeway with an on-ramp and off-ramp separated by 300 m, on-ramp volume of 500 veh/h, off-ramp volume of between 375 and 825 veh/h (fixed at 15% of freeway volume), and single auxiliary lane connecting the on- and off-ramps. |
Three-lane weave area |
Same as the two-lane weave area, except with three freeway lanes. |
System |
5.15-m, three-lane freeway system including two merge areas (each with 150-m acceleration lanes), one diverge area (with a 150-m deceleration lane), and one weave area (with a 300-m auxiliary lane). |
For each roadway network, the sensitivity of four different congestion levels was tested by incrementally increasing the entering volume (or traffic demand) on the freeway. The four congestion levels tested are shown in table 9.
Table 9. Congestion Levels for FRESIM Sensitivity Analysis.
Congestion Level |
Description |
|---|---|
| Low |
1000 veh/h/lane, equivalent to a volume/capacity (V/C) ratio of 0.42. |
| Medium |
1500 veh/h/lane, equivalent to a V/C ratio of 0.63. |
| High |
2000 veh/h/lane, equivalent to a V/C ratio of 0.83. |
| Very high |
2400 veh/h/lane, equivalent to a V/C ratio of 1.0. |
The HCM estimates the capacity of a basic freeway segment with a free-flow speed of 113 km/h to be 2400 veh/h/lane assuming ideal conditions.(2) In FRESIM, the upper bound of capacity can be limited by using the minimum separation for generation of vehicles parameter. For the sensitivity tests, this value was fixed at 1.5 seconds (default is 1.6 seconds), which equates to a maximum entering volume of 2400 veh/h/lane. The capacity can be limited by the driver behavior logic in some cases; this behavior was seen in the sensitivity study as discussed below.
Testing at V/C ratios above 1.0 was not conducted for the freeway sensitivity tests. With values above 1.0, it was impossible to create a congested state on a basic freeway segment without creating a downstream bottleneck. Because simple basic and merge/diverge networks were used in this study, any demand volume over capacity would still operate at capacity, while creating congested conditions further upstream. Future research into the sensitivity of freeway parameters under overcapacity conditions should be considered, based on the results shown in this study.
The MOEs used to quantify the effects of parameter changes on the quality of traffic flow are shown in table 10.
Table 10. FRESIM MOEs for Sensitivity Analysis.
Measure of Effectiveness |
Description |
|---|---|
Throughput (veh/h/lane) |
Measures the volume of vehicles traveling through a uniform segment. By gradually increasing the entering demand volume, the capacity of the segment was estimated by noting at what point the actual volume no longer matched the entering demand volume. This MOE was used for the basic, merge, diverge, and weave networks. However, it was not used for the system network because there are different segment types within the system, and each segment type has a different capacity. |
Vehicle-kilometers of travel (veh-km/h) |
Measures the number of vehicles traveling through a segment or multiple segments while taking into account the length of the segments. This MOE, which often is used for freeway system analyses, was only used for the system network as a surrogate to throughput, as it indirectly measures the capacity of the system while also accounting for the length of the network. |
Average speed (km/h) |
Measures the average space mean speed over the entire freeway network. This MOE was used on all test networks. |
Average density (veh/km/lane) |
Measures the average density over the entire freeway network. This MOE was used on all test networks. |
Average delay (sec/veh) |
Measures the difference in actual travel time and desired travel time (based on the free-flow speed). This MOE was used on all test networks. |
The MOEs listed in table 10 were summarized only within the portion of the network that captured the extent of the congestion and experienced the most change in MOEs from one congestion level to the next. Table 11 lists the MOE collection area for each network.
Table 11. FRESIM MOE Collection Areas.
Network Name |
MOE Collection Area |
|---|---|
One-lane basic segment |
Entire 1.6-km length of the freeway segment. |
Two-lane basic segment |
Same as one-lane basic segment. |
Three-lane basic segment |
Same as one-lane basic segment. |
Two-lane merge area |
The length of freeway (including the acceleration lane) beginning with the on-ramp gore area and extending downstream 460 m. This distance was used because the HCM states that 460 m is generally the area of influence at merge and diverge areas; this was found to be fairly accurate based on visual inspection of the CORSIM animation for the merge area networks. |
Three-lane merge area |
Same as two-lane merge area. |
Three-lane diverge area |
The 1220 m length of freeway starting at the off-ramp gore area and extending upstream 1220 m. The area of influence was increased to 1220 m because vehicles on the freeway began changing lanes to get in the proper lane 760 m upstream of the actual diverge area itself (based on the 760 m default off-ramp reaction point parameter), which created congestion between 760 and approximately 1220 m upstream of the diverge area. |
Three-lane diverge area |
Same as two-lane diverge area. |
Two-lane weave area |
The freeway lanes and auxiliary lane within the 300-m weave area. |
Three-lane weave area |
Same as two-lane weave area. |
System |
The entire 5.1 km/h freeway segment, including the auxiliary lanes associated with the on- and off-ramps, but not the ramps themselves. |
The FRESIM sensitivity study focused on the car following, lane changing, and free-flow speed parameters, because the other driver behavior parameters shown in table 7 apply to intersections on surface streets. Also, the majority of the other parameters listed in tables 3 through 7 have major impacts on the quality of traffic flow, so they already are known to be very sensitive parameters. For example, reducing the number of lanes from three to two due to a lane blockage, changing a signal control to emergency flashing due to a power outage, or reducing the traffic demand by 20 percent due to a major snowstorm all have major impacts on the quality of traffic flow. Such events are easily discernable as having a major effect on traffic flow, but the more subtle changes in car following and lane changing behavior are not quite as obvious, and are therefore the focus of this sensitivity study.
Tables 12 through 14 display the FRESIM parameters included in the sensitivity analysis. Each parameter was tested at the default value, along with four other values representing incrementally more conservative driver behavior, as would be the case with increasingly severe weather conditions. As a result, the sensitivity tests were one-sided in that they only tested values to one side of the default value. However, a few parameters were tested on both sides, because it was not clear which side represented the more conservative driver behavior (e.g., anticipatory lane change distance).
The car following parameters were tested on the basic segment (one-lane, two-lane, and three-lane), and system networks. The basic segment networks were used to isolate the sensitivity of the car following parameters (without the MOEs being influenced by factors associated with merging or diverging), while the system network was used to show the sensitivity within the context of a real-world network consisting of merges, diverges, and weave areas. Table 12 shows car following FRESIM parameters included in the sensitivity analysis.
Table 12. Car Following FRESIM Parameters Included in Sensitivity Analysis.
FRESIM Parameter |
Definition |
|---|---|
Car following sensitivity factor |
This factor is the primary user input in calculating the desired time (in seconds) headway between a leader-follower vehicle pair. A higher value means more space between vehicles. A different value is specified for each driver type (default = 1.25 to 0.35 s based on driver type, mean = 0.80 s). |
Car following sensitivity multiplier |
A link-specific multiplier of the car-following sensitivity factor (default = 100%). The multiplier is applied to all driver types and therefore changes the overall mean of the sensitivity factor. This value can be used to calibrate car following behavior on a link-by-link basis. |
Pitt car following constant |
The minimum distance between the rear of the lead vehicle and front of the following vehicle, regardless of vehicle speed (default = 3.05 m). |
Lag acceleration/ deceleration time |
The time delay (due to perception/reaction time) for motorists when starting to accelerate or decelerate (default = 0.3 s). |
Maximum non-emergency deceleration |
The maximum deceleration on level grade and dry pavement in non-emergency conditions (i.e., normal lane changing and car following behavior). Reflects driving habits and not capability of the vehicle (default = 2.44 m/s2). |
Jerk value |
The maximum change in acceleration between consecutive intervals (default = 2.13 m/s3). A higher value results in more aggressive driver behavior. |
The lane changing parameters were tested on all of the networks described in table 8, with the exception of the basic one-lane segment network, because lane changes are not possible on a one-lane segment. All other networks test various types of lane change environments, including mandatory lane changes at on- and off-ramps, discretionary lane changes on a basic freeway segment, and anticipatory lane changes upstream of merge areas. Refer to the TSIS Version 5.1 User's Guide(12) and Halati, Lieu, and Walker(13) for a detailed description of the FRESIM vehicle movement logic. The lane changing FRESIM parameters included in the sensitivity analysis are displayed in table 13.
Table 13. Lane Changing FRESIM Parameters Included in Sensitivity Analysis
FRESIM Parameter |
Definition |
|---|---|
Time to complete lane change |
The time to complete a lane change maneuver (default = 2.0 s). Increasing this value results in more extended, smooth lane changes. |
Advantage threshold for discretionary lane change |
Used to calculate the relative advantage in making a discretionary lane change (default = 0.4). The advantage (measured in speed and volume) in changing lanes must be greater than the condition in the current lane by a factor of 0.4. Increasing this value decreases the number of lane changes. |
Discretionary lane change multiplier |
A multiplier used in calculating the desire for discretionary lane changes (default = 0.5). Increasing this value increases the desire for discretionary lane changes. |
Gap acceptance parameter |
Used to determine the acceptable gap for mandatory lane changes (default = 3). A higher value represents less aggressive driver behavior and fewer lane changes. |
Percent cooperative drivers |
Percentage of drivers desiring to yield the right-of-way to vehicles attempting to merge ahead of them (default = 20%). |
Maximum non-emergency deceleration |
The maximum deceleration on level grade and dry pavement in non-emergency conditions (i.e., normal lane changing and car following behavior). Reflects driving habits and not capability of the vehicle (default = 2.44 m/s2). |
Maximum emergency deceleration |
The maximum deceleration on level grade and dry pavement in emergency conditions (i.e., sudden stop to prevent a collision). Reflects driving habits and not capability of the vehicle (default = 4.57 m/s2). |
Leader's maximum deceleration as perceived by follower |
The maximum deceleration of the lead vehicle in an adjacent lane as perceived by a potential lane-changing vehicle, which is used to determine whether a gap in the adjacent lane is acceptable (default = 4.57 m/s2). |
Anticipatory lane change speed |
Vehicles upstream of a merge area will change lanes to avoid the area if the speed of the acceleration lane falls below this threshold (default = 2/3 free-flow speed). |
Anticipatory lane change distance |
Vehicles upstream of a merge area begin to react (in terms of a potential lane change to avoid congestion related to the merge area) this distance in advance of the acceleration lane (default = 458 m). |
The two free-flow speed parameters were tested on all of the test networks. Table 14 shows the free-flow speed FRESIM parameters included in the sensitivity analysis.
Table 14. Free-Flow Speed FRESIM Parameters Included in Sensitivity Analysis.
FRESIM Parameter |
Definition |
|---|---|
Mean free-flow speed |
The desired mean speed of vehicles in the absence of any impedance due to other vehicles or traffic control devices (link specific). |
Free-flow speed multiplier |
A percentage multiplier for each driver type of the mean free-flow speed. A more aggressive driver type receives a higher multiplier to represent a higher free-flow speed. Together, the multipliers provide a distribution of free-flow speed by driver type (default = 88–112% based on driver type). |
A number of different geometric scenarios, or networks, were developed to test the sensitivity of the parameters under various roadway configurations using the NETSIM model in CORSIM. The networks developed for the NETSIM sensitivity analysis are shown in table 15. Figures 3 and 4 show the two intersection networks as viewed in the Traffic Editor (TRAFED), the input editor interface for Traffic Software Integrated System (TSIS).
Table 15. NETSIM Sensitivity Analysis Networks.
Network Name |
Description |
|---|---|
One-lane basic segment |
One-lane arterial segment (no intersections or driveways) of 1.6 km in length and free-flow speed of 72 km/h. |
Two-lane basic segment |
Same as the one-lane basic segment, except with two arterial lanes. |
Three-lane basic segment |
Same as the one-lane basic segment, except with three arterial lanes. |
Single suburban intersection |
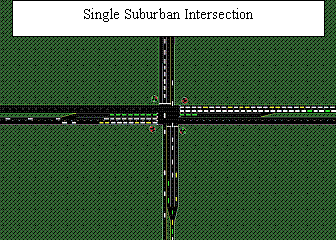
Five-lane arterial with free-flow speed of 72 km/h intersecting a three-lane collector street with free-flow speed of 48 km/h. The intersection is controlled by a fully actuated traffic signal with protected left-turn phasing, 76-m left-turn bays on all approaches, and a maximum cycle length of 120 s (if all phases max out). This intersection is typical of those found on major arterials in a suburban setting. Figure 3 displays the suburban intersection in TRAFED). |
Single urban intersection |
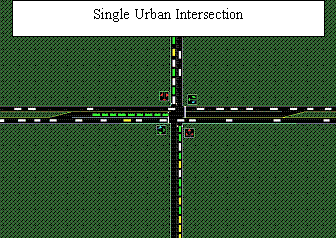
Three-lane collector intersecting a two-lane collector, both with free-flow speeds of 48 km/h. The intersection is controlled by a pretimed traffic signal with two phases (one for each roadway with permitted left-turn phasing), 46-m left-turn bays on all approaches, and a fixed cycle length of 80 s. This intersection is typical of those found in urban or downtown settings. Figure 3 displays the urban intersection in TRAFED). |
System |
3.2-m arterial corridor with four traffic signals at 610-m spacing. The arterial has a free-flow speed of 72 km/h with two through lanes in each direction and 76-m left-turn bays at the traffic signals, and the intersecting minor streets are one lane in each direction with 76-m left- and right-turn bays at the intersections. The traffic signals are controlled by a semiactuated, coordinated plan with a 120-s cycle. |
All networks were assumed to have ideal conditions as defined in the HCM, which includes 3.66-m travel lanes, level grade, no horizontal curves, and no heavy trucks.(2) An analysis period of 1 hour was used for all simulation runs.
For each test network, the sensitivity to four different congestion levels was tested by incrementally increasing the entering volume (or traffic demand) on the entry links. The four congestion levels tested on the basic one-, two-, and three-lane networks are listed in table 16.
Table 16. Congestion Levels for NETSIM Sensitivity Analysis.
Congestion Level |
Description |
|---|---|
| Low |
800 veh/h/lane, equivalent to a V/C ratio of 0.4. |
| Medium |
1200 veh/h/lane, equivalent to a V/C ratio of 0.6. |
| High |
1600 veh/h/lane, equivalent to a V/C ratio of 0.8. |
| Very high |
2000 veh/h/lane, equivalent to a V/C ratio of 1.0. |
The HCM does not provide guidance on the segment capacity of arterial streets, mainly because the capacity on arterials is determined by traffic signals and not the segment characteristics between traffic signals. However, it is clear that the segment capacity of arterials is generally lower than on freeways due to the lower free-flow speeds and increased friction effects (driveway access, on-street parking, narrow lanes, turning vehicles, etc.). Thus, a capacity of 2000 veh/h/lane was assumed for the basic arterial test networks based on a free-flow speed of 72 km/h. Even though this is just an estimate, the purpose of this study is to test relative sensitivity of different parameters and not to determine the absolute value of capacity or other MOEs.
As mentioned previously in the FRESIM analysis methodology, the minimum separation for generation of vehicles parameter can be used to limit the upper bound of capacity. However, this parameter is not available in NETSIM. As a result, segment volumes as high as 2700 veh/h/lane on a one-lane arterial and 2600 veh/h/lane on a two-lane arterial, assuming a free-flow speed of 72 km/h, were achieved in the current version of NETSIM. These values are higher than the capacity of typical freeways and are not realistic for an arterial segment. Based on this, it is recommended that the minimum separation for generation of vehicles parameter be available in NETSIM with an appropriate default value reflecting a realistic capacity of arterials, such as 1.8 s (equivalent to 2000 veh/h/lane).
For the single suburban intersection, single urban intersection, and system networks, the entering demand volume on all approaches was incrementally increased to achieve V/C ratios of approximately 0.6, 0.8, 1.0, and 1.1. The highest volume scenario was limited to a V/C ratio of 1.1 because ratios higher than 1.1 resulted in queue spillback beyond the limits of the network; therefore, the MOEs would not reflect the extent of the congestion.
Table 17 displays the MOEs used to measure the quality of traffic flow under the various network and volume scenarios for the NETSIM cases.
Table 17. NETSIM MOEs for Sensitivity Analysis.
| Measure of Effectiveness | Description |
|---|---|
| Throughput (veh/h/lane) |
Measures the volume of vehicles traveling through a uniform segment or intersection. By gradually increasing the entering demand volume, the capacity of the segment or intersection can be estimated by noting at what point the actual volume no longer matches the entering demand volume. This MOE was used on the all networks except the system network. |
Vehicle-kilometers of travel (veh-km/h) |
Measures the number of vehicles traveling through a segment or multiple segments while accounting for the length of the segments. This MOE, which is often used for system analyses, was used for the system network only as a surrogate to throughput, as it indirectly measures the capacity of the system when incrementally increasing the entering demand volume, until the vehicle-miles of travel no longer increases at a commensurate rate. |
Average speed (km/h) |
Measures the average space mean speed over the entire network. This MOE was used on the basic and system networks. However, it was not used on the single intersection networks, because stopped delay was deemed a more appropriate MOE at an intersection level. |
Stopped delay (s/veh) |
Measures the time spent stopped due to the effects of a traffic signal. This MOE was used on the single suburban and urban intersection networks because it measures the quality of service given by a traffic signal. Control delay was not used here because it is a function of the free-flow speed, and free-flow speed is a parameter in the sensitivity analysis. Thus, control delay would not give a consistent comparison when testing the free-flow speed. |
Average delay (s/veh) |
Measures the difference in actual travel time and desired travel time. This MOE, used on all test networks, takes into account delays due to traffic control devices and to the interaction with adjacent vehicles. |
Number of lane changes (lane changes/h) |
Measures the total number of lane changes made on the network. This MOE, used on all test networks, is not a direct measure of the quality of traffic flow, but it was included because it is a helpful measure in understanding why the other MOEs did or did not change significantly and how the parameters affect lane changing behavior. |
The MOEs listed in table 17 were only summarized within the portion of the network that captured the extent of the congestion and experienced the most change in MOEs from one congestion level to the next. Table 18 lists the MOE collection area for each network.
The simulation parameters chosen for the arterial sensitivity testing included the car following, lane changing, free-flow speed, discharge headway, startup lost time, and turning speed parameters within NETSIM. As mentioned previously in the FRESIM analysis methodology, the majority of other parameters identified in section 4 as being impacted by weather events already are known to have a major impacts on the quality of traffic flow; therefore they were not included in this sensitivity analysis.
Table 18. NETSIM MOE Collection Areas.
Network Name |
MOE Collection Area |
|---|---|
| One-lane basic segment |
The entire 1.6-km length of the segment. |
| Two-lane basic segment |
Same as the one-lane basic segment. |
| Three-lane basic segment |
Same as the one-lane basic segment. |
| Single suburban intersection |
Averaged (weighted based on the approach volume) over all intersection approaches. |
| Single urban intersection |
Averaged (weighted based on the approach volume) over all intersection approaches. |
| System |
Averaged over the major street links only. |
Tables 19 through 24 display the NETSIM parameters included in the arterial sensitivity analysis. Each parameter was tested at the default value, along with four other values representing incrementally more conservative driver behavior, as would be the case with increasingly severe weather conditions. As a result, the sensitivity tests were one-sided in that they only test values to one side of the default value. However, a few parameters were tested on both sides because it was not clear which side represented the more conservative driver behavior.
NETSIM only has one car following parameter, compared to six in FRESIM. In NETSIM, the impacts of traffic control devices and lane changing maneuvers to prepare for downstream turning movements often control the vehicle movement logic. Thus, a detailed car following logic in NETSIM is not as critical to modeling realistic traffic flow as it is in FRESIM. On the other hand, the lane changing logic in NETSIM is quite detailed, reflected in the fact that there are 15 NETSIM lane changing parameters. Refer to the TSIS Version 5.1 User's Guide(12) and Halati, Lieu, and Walker(13) for a detailed description of the vehicle movement logic in NETSIM. Table 19 shows the car following NETSIM parameter included in the sensitivity analysis.
Table 19. Car Following NETSIM Parameter Included in Sensitivity Analysis.
NETSIM Parameter |
Definition |
|---|---|
| Time to react to sudden deceleration of lead vehicle |
The amount of time for a driver to begin decelerating after the leader begins a sudden deceleration due to perception/reaction time (default = 1.0 s). |
The lane changing parameters were tested on all the test networks, except the basic one-lane and urban intersection networks (one through lane in each direction) because lane changes are not possible on one-lane roadways. Table 20 shows the lane changing NETSIM parameters included in the sensitivity analysis.
Table 20. Lane Changing NETSIM Parameters Included in Sensitivity Analysis.
NETSIM Parameter |
Definition |
|---|---|
Driver type factor |
This factor is used to calculate a driver's "intolerable" speed—the speed below which a driver begins looking for a lane change (default = 25). A higher value means drivers will have a higher intolerable speed and thus will look for lane changes more often. |
Urgency threshold |
A driver's desire to change lanes becomes more urgent as he or she gets closer to the object requiring a lane change (lane drop or slow-moving leader). After a driver's urgency factor (based on driver aggressiveness and distance to lane-change object) exceeds this factor, then the acceptable deceleration for changing lanes begins decreasing (default = 0.2). |
Minimum deceleration for a lane change |
A driver's acceptable deceleration (or risk) for lane changes varies depending on his or her urgency. This value defines the acceptable deceleration when a driver's urgency for changing lanes is very low. Decreasing this value decreases the amount of risk a driver is willing to take and thus decreases the number of lane changes (default = 1.52 m/s2). |
Difference in minimum /maximum deceleration for mandatory lane changes |
A driver's acceptable deceleration (or risk) for mandatory lane changes can vary depending on his or her urgency. This factor, measuring the difference in the minimum and maximum acceptable decelerations, defines how much the acceptable deceleration can vary. The default value (3.05 m/s2) means the minimum and maximum acceptable acceleration can vary as much as 3.05 m/s2. |
Difference in minimum/ maximum deceleration for discretionary lane changes |
A driver's acceptable deceleration (or risk) for discretionary lane changes can vary depending on his or her urgency. This factor, measuring the difference in the minimum and maximum acceptable decelerations, defines how much the acceptable deceleration can vary. The default value (1.52 m/s2) means the minimum and maximum acceptable acceleration can vary as much as 1.52 m/s2. |
Safety factor |
This factor represents the amount of caution by a lane changer (default = 0.8). For example, if the minimum acceptable deceleration is 3.05 m/s2, then the acceptable deceleration with the safety factor is 10 x 0.8 = 2.44 m/s2. |
Headway at which all vehicles attempt lane change |
The headway below which all drivers will attempt a lane change (default = 2.0 s). Increasing this value results in drivers attempting fewer lane changes. |
Headway at which no vehicles attempt lane change |
The headway above which no drivers will attempt a lane change (default = 5.0 s). Increasing this value results in drivers attempting more lane changes. |
Time to react to sudden deceleration of lead vehicle |
This factor is used to calculate a driver's "intolerable" speed—the speed below which a driver begins looking for a lane change (default = 25). A higher value means drivers will have a higher intolerable speed and therefore will look for lane changes more often. |
Duration of a lane change |
The time to complete a lane change maneuver (default = 3.0 s). This is also the minimum time after a lane change is initiated that another lane change can begin. Increasing this value results in more extended, smoother lane changes. |
Percent drivers who cooperate with lane changer |
The percentage of drivers who will slow down to allow a lane change in front of them (default = 50%). Increasing this value results in more lane change opportunities. |
Distance over which drivers perform lane change |
The mean distance for a driver to contemplate and complete a lane change (default = 91.4 m). Higher values result in drivers seeking lane changes over a longer distance and therefore make a smoother lane change. |
Distribution of distance to attempt a lane change |
A percentage multiplier for each driver type of the mean lane change distance (default ranges from 125–75%). |
Deceleration of lead vehicle |
The maximum deceleration rate of a lead vehicle (default = 3.66 m/s2). A higher value results in fewer acceptable gaps (because followers will require larger gaps) and fewer lane changes. |
Deceleration of following vehicle |
The maximum deceleration rate of a following vehicle (default = 3.66 m/s2). A higher value means followers will accept smaller gaps and therefore make more lane changes. |
The free-flow speed parameters were tested on all the test networks. The two NETSIM free-flow speed parameters are the same as those in FRESIM; however, the default multipliers are slightly different in each model. Table 21 shows the free-flow speed NETSIM parameters included in the sensitivity analysis.
Table 21. Free-Flow Speed NETSIM Parameters Included in Sensitivity Analysis.
NETSIM Parameter |
Definition |
|---|---|
| Mean free-flow speed |
The desired mean speed of vehicles in the absence of any impedance due to other vehicles or traffic control devices (link specific). |
| Free-flow speed multiplier |
A percentage multiplier for each driver type of the mean free-flow speed. A more aggressive driver type receives a higher multiplier to represent a higher free-flow speed. Together, the multipliers provide a distribution of free-flow speed by driver type (default = 75–127 percent based on driver type). |
The queue discharge headway, startup lost time, and turning speed parameters are only applicable at intersections and thus were tested on all the networks except for the basic segment networks. Tables 22 through 24 show the discharge headway, startup lost time, and turning speed NETSIM parameters included in the sensitivity analysis, respectively.
Table 22. Discharge Headway NETSIM Parameters Included in Sensitivity Analysis.
NETSIM Parameter |
Definition |
|---|---|
| Mean discharge headway |
The mean headway between vehicles discharging from a standing queue (mean = 1.8 s). |
| Discharge headway multiplier |
A percentage multiplier for each driver type of the mean discharge headway (default ranges from 170–50%). |
Table 23. Startup Lost Time NETSIM Parameters Included in Sensitivity Analysis.
NETSIM Parameter |
Definition |
|---|---|
| Mean startup delay |
The mean delay (due to perception/reaction time) of the first vehicle in a queue due to a traffic signal (default = 2.0 s). |
| Startup lost time multiplier |
A percentage multiplier for each driver type of the mean startup delay (ranges from 218–23%). |
Table 24. Turning Speed NETSIM Parameters Included in Sensitivity Analysis.
NETSIM Parameter |
Definition |
|---|---|
| Maximum allowable left-turn speed |
The speed at which vehicles making a left turn will travel through the turn if unimpeded by other vehicles (default = 6.71 m/s). |
| Maximum allowable right-turn speed |
The speed at which vehicles making a right turn will travel through the turn if unimpeded by other vehicles (default = 3.96 m/s). |
Overall, approximately 45,000 individual CORSIM simulation runs were processed for the sensitivity analysis: 25,000 in FRESIM and 20,000 in NETSIM. The need for the large number of runs becomes clear when considering the following for the FRESIM runs:
Due to the large number of simulation runs, the process of creating the CORSIM input files and summarizing the output files was largely automated. The data processing was completed through four steps, described below.
Step 1—Create the CORSIM input files.
A customized script (in both Microsoft® Visual Basic® and C++®) was created that automatically generated new TRF files by taking a base input file and changing one or more parameters at a time. As a result, thousands of input files could be created with a single "Do Loop" command, changing the value of one or more parameters multiple times. A spreadsheet was created with all the desired network-congestion level-parameter value combinations, which was read by the script to create the input files.
Step 2—Run CORSIM 10 times for each input file, and create an output file summarizing the relevant MOEs from the 10 runs.
The multirun function available in TSIS 5.1 (the simulation environment that includes CORSIM) was used to run CORSIM 10 times for each input file. The "Output Processor" function available in TSIS was also used to create an output file in Microsoft® Excel® format summarizing the mean and standard deviations of the MOEs for the 10 runs. The random number seeds were changed for each of the 10 runs.
Step 3—Copy all relevant MOE data from the output files into a single database.
Customized Microsoft® Visual Basic® macros were created that copied the relevant MOE data from the thousands of output files into two databases, one each for the FRESIM and NETSIM runs. The macros also calculated t-values to test the statistical significance of the results (at a 95 percent confidence interval).
Step 4—Create a one-page summary of MOEs for each parameter-network combination.
One-page summaries for each parameter-network combination (e.g., sensitivity of the car following factor on basic two-lane freeway) were created using customized Microsoft® Visual Basic® macros that read the values from the database created in step 3.
The end product of the data processing is a one-page summary for each parameter-network combination (e.g., sensitivity of mean free-flow speed on basic one-lane freeway network). These one-page summaries provided a useful tool for evaluating the sensitivity of each parameter. Tables 25 through 29 and figures 5 through 9 display a sample of the information available on a single one-page summary (formatting requirements of the report precluded the original format of the one-page summary from being displayed). The results from these figures and tables represent the results of testing the car following sensitivity multiplier on the FRESIM system network, which, as will be discussed later, is one of the most sensitive parameters tested.
Table 25. General Information for Sample Sensitivity Test.
| Component |
Description |
|---|---|
Parameter name |
Car following sensitivity multiplier |
Parameter type |
Car following |
Test network |
System |
Model |
FRESIM |
Input level |
Link |
TRAFED location |
Double-click a link -> "General" tab |
Record type/field(s): |
Record type 20/Field 17 |
Default value |
100 |
Sensitivity range |
100, 125, 150, 175, 200 |
Definition |
This value adjusts the car following sensitivity factor by a multiplier for all vehicles on a given link. The car following sensitivity factor is the primary variable in determining the desired headway of a vehicle following another vehicle. |
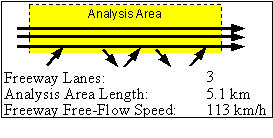
Figure 5. Analysis Area Information for Sample Sensitivity Test.
Table 26. Vehicle-Kilometers Traveled Table for Sample Sensitivity Test.
| Entering Volume (veh/h/ln) |
VEHICLE-KILOMETERS OF TRAVEL (veh-km/hr) |
||||
|---|---|---|---|---|---|
| Car Following Sensitivity Multiplier |
|||||
100 * |
125 |
150 |
175 |
200 |
|
| 1000 |
17728 |
17733 (0%) |
17731 (0%) |
17724 (0%) |
17724 (0%) |
| 1500 |
24787 |
24770 (0%) |
24733 (0%) |
24740 (0%) |
23930 (-3%) |
| 2000 |
31102 |
29363 (-6%) |
27945 (-10%) |
26066 (-16%) |
23939 (-23%) |
| 2500 |
31058 |
29309 (-6%) |
27898 (-10%) |
26036 (-16%) |
24004 (-23%) |
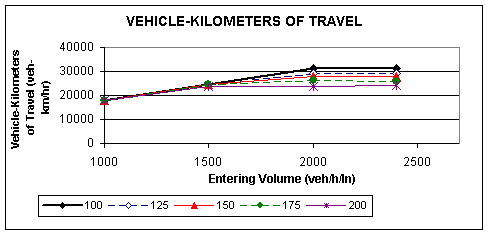
Table 27. Average Speed Table for Sample Sensitivity Test.
| Entering Volume (veh/h/ln) |
AVERAGE SPEED (km/h) |
||||
|---|---|---|---|---|---|
| Car Following Sensitivity Multiplier |
|||||
100 * |
125 |
150 |
175 |
200 |
|
| 1000 |
107.0 |
107.0 (-1%) |
106.0 (-1%) |
105.0 (-2%) |
104.0 (-3%) |
| 1500 |
105.0 |
103.0 (-2%) |
100.0 (-5%) |
92.1 (-12%) |
61.4 (-42%) |
| 2000 |
81.0 |
66.3 (-18%) |
62.2 (-23%) |
58.1 (-28%) |
53.2 (-34%) |
| 2500 |
72.7 |
66.6 (-8%) |
62.7 (-14%) |
57.6 (-21%) |
54.0 (-26%) |
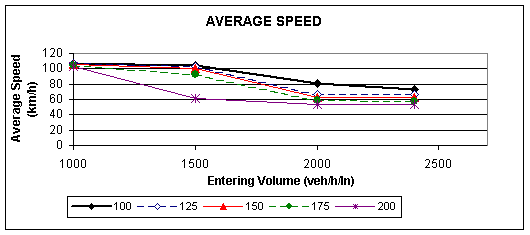
Figure 7. Average Speed Graph for Sample Sensitivity Test.
Table 28. Average Delay Table for Sample Sensitivity Test.
| Entering Volume (veh/h/ln) |
AVERAGE DELAY (s/veh) |
||||
|---|---|---|---|---|---|
| Car Following Sensitivity Multiplier |
|||||
100 * |
125 |
150 |
175 |
200 |
|
1000 |
8.1 |
9.1 (12%) |
10.3 (27%) |
12.1 (49%) |
14.2 (74%) |
1500 |
12.0 |
14.8 (24%) |
20.3 (70%) |
36.4 (204%) |
137. (1040%) |
2000 |
63.8 |
114. (78%) |
133. (108%) |
153. (140%) |
182. (186%) |
2500 |
89.5 |
113. (26%) |
130. (46%) |
157. (75%) |
178. (98%) |
Figure 8. Average Delay Graph for Sample Sensitivity Test.
Table 29. Average Density Table for Sample Sensitivity Test.
| Entering Volume (veh/h/ln) |
AVERAGE DENSITY (veh/km/ln) |
||||
|---|---|---|---|---|---|
| Car Following Sensitivity Multiplier |
|||||
100 * |
125 |
150 |
175 |
200 |
|
1000 |
10.9 |
10.9 (1%) |
11.0 (1%) |
11.1 (2%) |
11.3 (4%) |
1500 |
15.5 |
15.8 (2%) |
16.3 (5%) |
17.9 (15%) |
26.5 (71%) |
2000 |
26.2 |
32.6 (24%) |
32.4 (24%) |
31.4 (20%) |
31.4 (20%) |
2500 |
33.0 |
33.2 (1%) |
32.1 (-3%) |
31.7 (-4%) |
31.0 (-6%) |
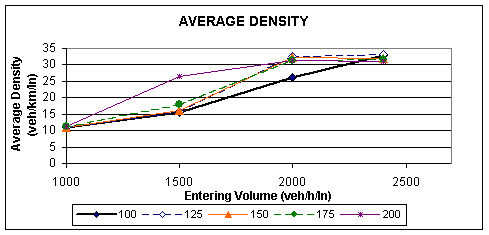
Figure 9. Average Density Graph for Sample Sensitivity Test.
The summary graphs shown above use the entering volumes as the X-axis, which could be different than the actual volumes in the at-capacity scenarios. Thus, the graphs do not match traditional speed-volume-density graphs typically found in the HCM or other traffic flow theory applications. Demand volume was used in this study because the objective was to understand the sensitivity of the parameters under different uniform scenarios, so it was important to keep the X-axis constant to see how the MOEs varied under each parameter value. Using the actual volume in the X-axis would make it more difficult to directly compare the results of each parameter value, especially when the parameter values experience a slightly different actual volume for the at-capacity scenarios.
The sensitivity test results for each parameter-network scenario were examined and a number of general trends from the sensitivity study were observed, including:
As stated earlier, the majority of the sensitivity tests were designed as one-sided tests, meaning the parameter values were varied on one side of the default value to represent more cautious driver behavior, as would be expected during adverse weather. Based on this one-sided methodology, it was expected that the parameters would experience a general degradation in MOEs (i.e., average speed decreasing and average delay increasing) when changing the parameter values to represent more conservative driver behavior. However, this was not always the case. In fact, the parameters were divided into three "sensitivity groups" based on their general effect on the MOEs, as shown in table 30.
Table 30. CORSIM Parameter Sensitivity Groups.
Sensitivity Group |
Description |
|---|---|
| Expected |
Parameter values that consistently produced degradation in MOEs. |
| Inconsistent |
Parameter values that showed no consistent trend between more conservative driver behavior and MOEs. |
| No effect |
Parameter values that had virtually no effect on the MOEs in any of the network-congestion level scenarios. |
Figures 10 through 12 show the sensitivity of average speed on the freeway system network for three parameters representing each sensitivity group. As shown in these figures, the Pitt car following constant follows a consistent and expected trend, the maximum emergency deceleration does not follow a consistent trend, and the jerk value shows no sensitivity at all.
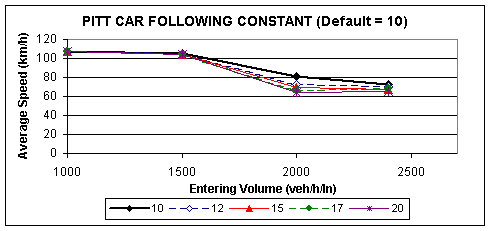
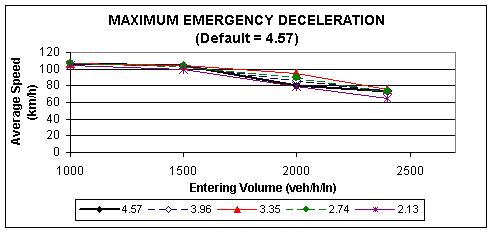
Figure 11 . Sensitivity of Maximum Emergency Deceleration on Freeway System Network-
Example of "Inconsistent" Sensitivity Group.
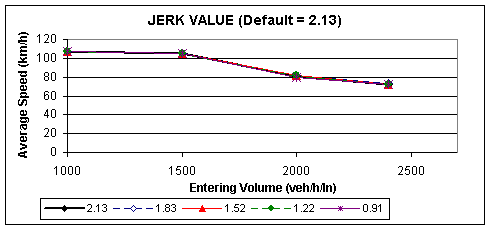
Figure 12. Sensitivity of Jerk Value on Freeway System Network-
Example of "No Effect" Sensitivity Group.
Tables 31 through 33 summarize the general sensitivity of each freeway parameter tested, based on the sensitivity group and general level of sensitivity. Low, medium, or high sensitivity levels are based on an evaluation of the overall sensitivity of the parameter values in each network-congestion level scenario. These are based on relative differences between the parameters and not an absolute sensitivity level.
Table 31 summarizes the sensitivity of each FRESIM car following parameter.
Table 31. General Sensitivity of FRESIM Car Following Parameters.
Parameter |
Parameter Values |
Sensitivity Group |
Sensitivity Level |
Comments |
|---|---|---|---|---|
| Car following sensitivity factor |
0.3,* 0.2, 0.1, 0.0** |
No Effect |
Low |
This parameter overall has little sensitivity when changing the standard deviation of the sensitivity factor by driver types (but keeping the mean constant). |
| Car following sensitivity multiplier |
100,* 125, 150, 175, 200 |
Expected |
High |
The most sensitive car following parameter. Value of 125 yields statistically different MOEs than default at medium congestion levels (V/C of 0.63 and higher). |
| Pitt car following constant |
10,* 12, 15, 17, 20 |
Expected |
Medium |
CORSIM only allows values from 3 to 10. A modification was made to allow larger values. A value of 12 yields statistically different MOEs than default at higher congestion levels (V/C of 0.83 and higher). |
| Lag acceleration /deceleration time |
1, 3,* 5, 7, 9 |
Expected |
Medium |
MOEs worsen as value increases. Value of 5 yields statistically different MOEs on system network than default value. Value of 1 much more sensitive than other values. |
| Jerk value |
2.14,*1.83, 1.52, 1.22, 0.91 |
No Effect |
Low |
Values show no statistically significant sensitivity under any network-congestion level scenario. |
The Pitt car following constant and lag acceleration/deceleration time parameters, while not as sensitive as the car following sensitivity multiplier, showed consistent and expected results. They also should be considered when attempting to calibrate car following behavior. A Pitt car following constant value of 3.66 m yielded statistically degraded MOEs when compared to the default, but generally only at the higher congestion scenarios (entering volume of 2000 veh/h/lane or higher). (Note: The current version of CORSIM only allows values of the Pitt constant to vary from 3 to 10. A modification was made to allow larger values for this study.) The lag acceleration/deceleration time values of 5.0 s or higher showed statistical differences at an entering volume of 2000 veh/h/lane on the system network, but the values were statistically different only at the highest congestion level (2400 veh/h/lane) on the basic segment networks.
The jerk value and car following sensitivity factor showed no sensitivity under any of the scenarios. However, this does not imply that these parameters have no sensitivity whatsoever. In fact, further testing with different networks and/or at a more detailed analysis level would provide a more complete depiction of the parameter's sensitivity and might reveal a sensitivity that was not evident in these scenarios.
Table 32 summarizes the sensitivity of each FRESIM lane changing parameter. The lane changing parameters were generally not as stable as the car following parameters, as many produced no clear trends in the MOEs. Some parameters produced a clear trend in one network, but then the opposite trend in another network (e.g., anticipatory lane change speed). On the other hand, other parameters consistently showed no clear trend in every network (e.g., maximum emergency deceleration). It was interesting that the maximum emergency deceleration and the leader's maximum deceleration as perceived by follower parameters had identical impacts on the MOEs in every network and volume level, prompting the question of why there are two different parameters in the model that yield identical results.
The time to complete lane change parameter produced consistent and expected results at a medium level of sensitivity. Based on this finding, this parameter should be considered first when attempting to calibrate lane changing behavior. The advantage threshold for discretionary lane change, discretionary lane change multiplier, gap acceptance parameter, and percent cooperative drivers parameters showed no sensitivity under any of the scenarios. However, as stated previously, it should not be inferred that these parameters have no sensitivity whatsoever, but rather a more detailed analysis should be completed under different networks and/or a more detailed analysis level to get a more complete depiction of the true parameter sensitivity.
Table 32. General Sensitivity of FRESIM Lane Changing Parameters.
| Parameter |
Parameter Values | Sensitivity Group |
Sensitivity Level | Comments |
|---|---|---|---|---|
| Time to complete lane change |
2.0,* 2.5, 3.0, 3.5, 4.0 |
Expected |
Medium |
Value of 3.0 yields statistically different MOEs for most networks at higher congestion levels. |
| Advantage threshold for discretionary lane change |
0.4,* 0.5, 0.6, 0.7, 0.8 |
No Effect |
Low |
This parameter overall has little sensitivity, with the exception of average delay at the highest congestion level. |
| Discretionary lane change multiplier |
5,* 4, 3, 2, 1 |
No Effect |
Low |
This parameter overall has little sensitivity. |
| Gap acceptance parameter |
3,* 4, 5, 6 |
No Effect |
Low |
This parameter overall has little sensitivity. |
| Percent cooperative drivers |
20,* 30, 40, 50, 100 |
No Effect |
Low |
This parameter has very little sensitivity, even at the maximum value (100). |
| Maximum non-emergency deceleration |
2.44,* 2.13, 1.83, 1.52, 1.22 |
Inconsistent |
Medium |
MOEs improve as value decreases. Value of 1.83 yields statistically different MOEs on most scenarios. |
| Maximum emergency deceleration |
4.57,* 3.96, 3.35, 2.74, 2.13 |
Inconsistent |
Medium |
MOEs improve as value decreases, except for a value of 2.13, which often yields worse MOEs. |
| Leader's maximum deceleration as perceived by follower |
4.57,* 3.96, 3.35, 2.74, 2.13 |
Inconsistent |
Medium |
Identical results as maximum emergency deceleration parameter. |
| Anticipatory lane change distance |
762, 610, 457,* 305, 152 |
Inconsistent |
Medium |
No clear trend between distance and MOEs (different trend in each network). |
| Anticipatory lane change speed |
69,* 56, 48, 40, 32 |
Inconsistent |
Medium |
No clear trend between this parameter and MOEs. System and merge networks show improvement in MOEs as speed decreases, but weave network shows degradation in MOEs. |
Table 33 summarizes the sensitivity of each FRESIM free-flow speed parameter.
Table 33. General Sensitivity of FRESIM Free-Flow Speed Parameters.
| Parameter | Parameter Values |
Sensitivity Group |
Sensitivity Level | Comments |
|---|---|---|---|---|
| Mean free-flow speed |
113,* 97, 81, 64, 48 |
Expected |
High |
The most sensitive of all parameters tested. A value of 60 yielded statistically different MOEs than the default value for all networks. |
| Free-flow speed multiplier ** |
0.78,* 0.54, 0.27, 0.00** |
Inconsistent |
Medium |
No clear trend between standard deviation and MOEs (different trend in each network). Basic networks have high sensitivity at higher congestion levels but other networks show little sensitivity. |
The mean free-flow speed parameter was the most sensitive of all parameters studied. A free-flow speed of 97 km/h yielded statistically different results under all scenarios compared to the default value (113 km/h). This sensitivity study confirms past research showing that the free-flow speed parameter is a crucial parameter to alter when modeling weather events on freeway networks. However, the free-flow speed multiplier parameter, which was tested by changing the distribution of speed by driver type while maintaining the same mean speed, showed no clear trend in its impact on the MOEs. Further, changing the multipliers so that each driver type has the same free-flow speed (or zero standard deviation) yielded average speeds equal to the free-flow speed on the basic segment networks, which is an unrealistic result at the higher volume levels because all other test scenarios showed a gradual decrease in average speed with an increase in entering volume.
The sensitivity results for each NETSIM parameter-network scenario, like the example results shown in tables 25 through 29 and figures 5 through 9, were examined and a number of trends from the sensitivity study were observed, including:
Tables 34 through 39 summarize the general sensitivity of each network parameter tested based on the sensitivity group (refer to table 30) and general level of sensitivity.
Table 34 displays the general sensitivity of the NETSIM car following parameter.
Table 34. General Sensitivity of NETSIM Car Following Parameters.
| Parameter |
Parameter Values |
Sensitivity Group |
Sensitivity Level |
Comments |
|---|---|---|---|---|
| Time to react to sudden deceleration of lead vehicle |
0.5, 1.0,* 1.5, 2.0, 2.5 |
Expected |
High |
Values of 1.5 and higher yield statistically degraded MOEs with basic and system networks under all congestion levels. Intersection networks show slightly less sensitivity. |
As described previously, there is not a detailed car following model in NETSIM, primarily because the movement of vehicles on surface streets are controlled more by lane changing behavior and reacting to traffic control devices than by basic car following behavior. For the time to react to sudden deceleration of lead vehicle parameter, significant degradation in the MOEs were observed as the parameter value increased for the basic segment and system networks. However, for the single intersection networks, especially the urban intersection, the parameter changes had little effect on the MOEs. The small effect on the intersection networks is logical, given that vehicle movement likely was controlled mainly by reaction to the traffic signal and queues upstream of the signal.
It should be noted that the time to react to sudden deceleration of lead vehicle parameter also affects lane changing behavior, as seen in the next section.
Table 35 displays the general sensitivity of the NETSIM lane changing parameters.
Table 35. General Sensitivity of NETSIM Lane Changing Parameters.
| Parameter |
Parameter Values |
Sensitivity Group |
Sensitivity Level | Comments |
|---|---|---|---|---|
| Driver type factor |
15, 25,* 35, 45, 50 |
No Effect |
Low |
No sensitivity, not even at a value of 50, to any network-congestion level combination. |
| Urgency threshold |
2,* 2.5, 3, 4, 5 |
No Effect |
Low |
Very low sensitivity. In a few cases, a value of 5 yielded differences of 2-3% from default value, but never at statistically significant level. |
| Minimum deceleration for a lane change |
1.52,* 1.22, 0.91, 0.61, 0.30 |
Expected |
Medium |
Statistically significant decreases in number of lane changes (up to 20%), but none for other MOEs. |
| Difference in minimum/maximum deceleration for mandatory lane changes |
3.05,* 2.74, 2.13, 1.83, 1.52 |
No Effect |
Low |
Very low sensitivity. MOEs did not change at statistically significant level in any network-congestion level combination. |
| Difference in minimum /maximum deceleration for discretionary lane changes |
1.52,* 1.22, 0.91, 0.61, 0.30 |
No Effect |
Low |
Statistical increase in the number of lane changes in some cases under non-congestion level (up to 10%). Very low sensitivity on other MOEs. |
| Safety factor |
0.80,* 0.75, 0.70, 0.65, 0.60 |
No Effect |
Low |
Moderate reduction in number of lane changes when safety factor is 0.6 and volumes are high (4-6% reduction). A few cases yielded differences of 1-3%, but no statistical significance. |
| Headway at which all vehicles attempt lane change |
2.0,* 1.8, 1.5, 1.2, 1.0 |
No Effect |
Low |
Very low sensitivity. The number of lane changes decreased in all networks (0-4%). Very low sensitivity on other MOEs. |
| Headway at which no vehicles attempt lane change |
5.0,* 4.5, 4.0, 3.5, 3.0 |
No Effect |
Low |
Very low sensitivity. The number of lane changes decreased in all networks (maximum 2%). Very low sensitivity on other MOEs. |
| Time to react to sudden deceleration of lead vehicle |
0.5, 1.0,* 1.5, 2.0, 2.5 |
Expected |
High |
Values of 1.5 and higher yield statistically degraded MOEs with basic and system networks under all congestion levels. Intersection networks show slightly less sensitivity. |
| Duration of a lane change |
3,* 5, 6, 7, 8 |
No Effect |
Low |
Low sensitivity. The number of lane changes decreased slightly (5% maximum at the significant level). Very low sensitivity on other MOEs. |
| Percent drivers who cooperate with lane changer |
10, 25, 50,* 75, 100 |
No Effect |
Low |
At value of 10, the number of lane changes drops by up to 12%. A maximum 10% increase in average speed on the suburban intersection with a value of 100 (not a statistically significant difference). |
| Distance over which drivers perform lane change |
91.4,* 152, 214, 274, 335 |
No Effect |
Low |
Very low sensitivity. |
| Distribution of distance to attempt a lane change |
17.1,* 11.4, 6.1, 0.0** |
No Effect |
Low |
No sensitivity was shown, not even a 1% difference at a standard deviation of 0.0. |
| Deceleration of lead vehicle |
3.66,* 3.35, 3.05 |
Expected |
Medium |
The number of lane changes decreased dramatically, as much as 100%. The basic networks experienced statistical decreases in average speed (2-4%) and delay (up to 20%). |
| Deceleration of following vehicle |
3.66,* 3.35, 3.05 |
Expected |
Medium |
The number of lane changes decreased dramatically, as much as 90%. The basic networks experienced statistical decreases in average speed (1-6%) and delay (up to 44%). |
As shown in the table, there are 15 lane changing parameters in NETSIM. Of these parameters, 11 had very little sensitivity overall on the MOEs. Typically these parameters had some small, quantifiable change on the number of lane changes, but had very little impact (and not statistically significant) on the other MOEs. This study does not prove that these parameters have no sensitivity whatsoever. Testing of different networks or use of different MOEs could reveal additional sensitivity not discovered in this study. For example, examination of more disaggregate MOEs, such as vehicle trajectory data, could reveal sensitivity of the parameters at a level that is not possible with aggregate MOEs such as average speed over an entire link.
The time to react to sudden deceleration of lead vehicle parameter impacted the number of lane changes dramatically (up to 90 percent increase on the basic segment networks and 30 percent on the other networks). The other MOEs changed at a more modest, but still significant, level.
The minimum deceleration for a lane change had a moderate impact on the number of lane changes (up to 20 percent change), but no statistically significant changes in the other MOEs.
The deceleration of lead vehicle and deceleration of following vehicle parameters showed a medium level of sensitivity (relative to the other parameters), with a significant decrease in the number of lane changes and more moderate, but still statistically significant, change in average speed and average delay. It is interesting that CORSIM will not allow users to enter a value for these parameters less than 3.05 (allowable range of 3.05 to 4.57). Future consideration should be given to widening this allowable range, given that it is one of the few lane changing parameters that has a quantifiable impact on MOEs.
Table 36 displays the general sensitivity of the NETSIM free-flow speed parameters.
Table 36. General Sensitivity of NETSIM Free-Flow Speed Parameters.
| Parameter |
Parameter Values | Sensitivity Group |
Sensitivity Level | Comments |
|---|---|---|---|---|
| Mean free-flow speed |
72,* 64, 56, 48, 40 |
Expected |
High |
Average speed and delay changed significantly at all congestion levels (average speed reduced 12% at 64 km/h and 46% at 40 km/h), but throughput was not as sensitive (no statistical differences). |
| Free-flow speed multiplier |
16,* 11.4, 5.4, 0.0** |
Inconsistent |
Medium |
Reducing the standard deviation improves the MOEs on the basic segment networks (up to 25% increase in average speed), but no statistical differences on other networks. |
The mean free-flow speed parameter was the most sensitive of all NETSIM parameters studied. For example, lowering the mean free-flow speed from 72 to 40 km/h resulted in a 450 percent increase in total delay and 45 percent decrease in average speed on the basic two-lane segment. This finding that the MOEs are very sensitive to changes in free-flow speed is similar to that found in the FRESIM sensitivity analysis.
The free-flow speed multiplier represents a distribution of free-flow speeds based on driver type. It was found that more uniform free-flow speeds (lower standard deviation) resulted in fewer lane changes. In addition, the other MOEs (except for throughput) improved on the basic segment networks (up to 25 percent increase in average speed), but no statistically significant changes were found on the other networks. The free-flow speed multiplier did not affect the throughput on the basic one-, two-, and three-lane segment networks. The improvement on the basic segment networks were similar to that found in the FRESIM sensitivity analysis.
Table 37 displays the general sensitivity of the NETSIM discharge headway parameters.
The mean discharge headway is a very sensitive NETSIM parameter, as shown in the table. Generally, as the discharge headway increased, the MOEs became more degraded. Stopped delay was the most affected MOE (up to 1800 percent increases), while the number of lane changes was the least affected MOE (maximum change of 20 percent).
Changing the distribution of the discharge headway multiplier (while maintaining the same mean value) did not statistically impact any of the networks during any congestion level.
Table 37. General Sensitivity of NETSIM Discharge Headway Parameters.
| Parameter |
Parameter Values | Sensitivity Group | Sensitivity Level |
Comments |
|---|---|---|---|---|
| Mean discharge headway |
1.9,* 2.2, 2.5, 2.7, 3.0 |
Expected |
High |
Stop delay increased 1300%, and throughput decreased 35% at 3.0 on the suburban intersection. |
| Discharge headway multiplier |
33.7,* 20.2, 10.1, 0.0** |
No Effect |
Low |
No statistical differences were observed in any network-congestion level combination. |
Table 38 displays the general sensitivity of the NETSIM startup delay parameters.
Table 38. General Sensitivity of NETSIM Startup Delay Parameters.
| Parameter |
Parameter Values | Sensitivity Group | Sensitivity Level |
Comments |
|---|---|---|---|---|
| Mean startup delay |
1.3,* 1.5, 1.7, 1.9, 2.1 |
Expected |
High |
Stop delay increased 47%, and throughput decreased only slightly (2%) at a value of 2.1 on the suburban intersection. |
| Startup delay multiplier |
55,* 37, 16.8, 0.0** |
No Effect |
Low |
No statistical differences were observed in any network-congestion level combination. |
The startup delay parameters had a similar effect on the MOEs as the discharge headway parameters, but with slightly less severity because this parameter only affects the first few vehicles in a queue. For example, throughput and the number of lane changes were impacted minimally (maximum of 2 and 6 percent, respectively). Generally, as the startup delay increased, the MOEs subsequently degraded. Stop delay was the most affected MOE (increases of up to 47 percent), while average speed dropped only up to 10 percent. The changes in average delays were impacted as well (up to 37 percent). The changes in average delays were greatest in the urban network, while the system network was the least impacted network overall.
Changing the distribution of the startup delay multiplier (while maintaining the same mean value) did not statistically impact any of the networks during any congestion level.
Table 39 displays the general sensitivity of the NETSIM turning speed parameters.
Table 39. General Sensitivity of NETSIM Turning Speed Parameters.
| Parameter |
Parameter Values | Sensitivity Group | Sensitivity Level |
Comments |
|---|---|---|---|---|
| Maximum allowable left-turn speed |
35,* 29, 23, 16, 10 |
Expected |
Medium |
The largest difference was a 12% increase (which was statistically significant) in stopped delay at 9.7 km/h on the urban intersection. |
| Maximum allowable right-turn speed |
21,* 18, 15, 11, 8 |
Expected |
Medium |
The largest difference was a 15% increase (which was statistically significant) in stopped delay at 8 km/h on the urban intersection. |
Decreasing the turning speeds produced an expected degradation in the MOEs. The MOEs were most affected at the higher congestion levels, as vehicles were more closely spaced and thus delayed more by vehicles turning at a slower rate. Stopped delay was the most affected MOE, as stopped delays increased approximately 10 to 15 percent on the urban intersection during the highest congestion levels. The left- and right-turning speeds were approximately equally sensitive on the test networks.
The purpose of the sensitivity study was to identify the most sensitive weather-related parameters in CORSIM. The study focused on car following, lane changing, and free-flow speed parameters on freeways (FRESIM) and car following, lane changing, free-flow speed, discharge headway, startup lost time, and turning speed parameters on arterial streets (NETSIM). Each test parameter was modeled on various geometric networks and congestion (volume) levels using the default value and then changing the value to represent incrementally more conservative driver behavior, as would occur under adverse weather. The MOEs produced by the default value were then compared to the MOEs produced with the changed parameter values to determine the level of sensitivity the parameter has on the MOEs.
One interesting result of the study was that a number of parameters had little or no impact on the MOEs. Table 40 summarizes the tested parameters that had no effect on the MOEs.
As table 40 shows, lane changing parameters were the majority of the parameters with no sensitivity. In fact, 11 of the 15 lane changing parameters in NETSIM showed no sensitivity. These nonsensitive parameters should be the focus of further research, because it is not clear why many of them did not have a greater impact on the MOEs. However, this study does not prove that these parameters have no sensitivity whatsoever. Testing different networks or using different MOEs could reveal additional sensitivity not discovered in this study. For example, examining more disaggregate MOEs, such as vehicle trajectory data, could reveal sensitivity of the parameters at a level which is not possible with aggregate MOEs, such as average speed over an entire link. The fact that most of these lane changing parameters had at least some small impact on the number of lane changes shows that the parameters were affecting traffic operations to some degree.
Table 40. Traffic Parameters with No Effect on MOEs.
| Parameter Category | Parameter |
|---|---|
| FRESIM | |
| Car following |
|
| Lane changing |
|
| NETSIM | |
| Car following |
|
| Lane changing |
|
| Discharge headway |
|
| Startup lost time |
|
| Turning speed |
|
In addition to the nonsensitive parameters, a number of FRESIM lane changing parameters had an "inconsistent" impact on the MOEs, named so because they had no consistent impact on the MOEs. These inconsistent parameters included the maximum non-emergency deceleration, maximum emergency deceleration, leader's maximum deceleration as perceived by follower, anticipatory lane change distance, and anticipatory lane change speed. These parameters should also be the focus of more detailed research to further determine how they function within the various model algorithms and exactly what impact they have on traffic operations.
Table 41 summarizes those parameters that had both an expected effect on the MOEs and were categorized as either having a medium or high effect on the MOEs (relative to the other parameters). This table is important because it identifies the key weather-related driver behavior parameters that should be altered when trying to model weather events in CORSIM. As stated earlier, this study does not recommend specific values to use for these parameters during various weather events, but it does identify these parameters as the most sensitive, and therefore should be the focus when calibrating a model for a specific weather event. A traffic analyst should first focus on the parameters with a high sensitivity level, and if further calibration is needed, could use those with a medium sensitivity level.
Table 41. Traffic Parameters with Expected and Medium-to-High Effect on MOEs.
| Parameter Category | Parameter |
|---|---|
| FRESIM | |
| Car following |
|
| Lane changing |
|
| Free-flow speed |
|
| NETSIM | |
| Car following |
|
| Lane changing |
|
| Free-flow speed |
|
| Discharge headway |
|
| Startup lost time |
|
| Turning speed |
|
Note: Values in parenthesis (high, medium, or low) represent the sensitivity level of the parameter, with a parameter in italics representing a high sensitivity level.
Due to the large number of networks and variables tested in the sensitivity study, a number of additional findings and recommendations were made that were somewhat unrelated to the task of determining the most sensitive parameters, but nonetheless were thought to be important for CORSIM users in general. These findings can be summarized as follows:

