U.S. Department of Transportation
Federal Highway Administration
1200 New Jersey Avenue, SE
Washington, DC 20590
202-366-4000
Federal Highway Administration Research and Technology
Coordinating, Developing, and Delivering Highway Transportation Innovations
 |
| This report is an archived publication and may contain dated technical, contact, and link information |
|
Publication Number: FHWA-RD-03-065
Date: September 2004 |
||||||||||||||||||||||||||||||||||
In-Vehicle Display Icons and Other Information Elements: Volume IPDF Version (8.33 MB)
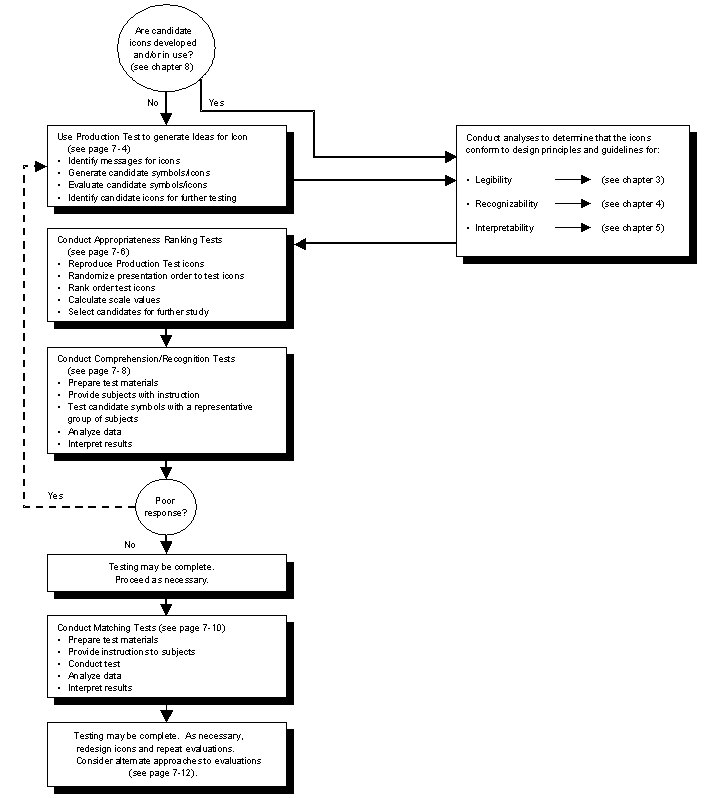
PDF files can be viewed with the Acrobat® Reader® CHAPTER 7: EVALUATING IN-VEHICLE ICONSOVERVIEW OF GENERAL PROCEDURES FOR EVALUATING IN-VEHICLE ICONSIntroduction: Evaluating icons refers to the general process of determining whether an icon, or an integrated set of icons, meets specific criteria in areas such as legibility, recognition, interpretation, and driver preferences. Developing useful and effective icons requires evaluation. A rigorous and iterative evaluation phase in icon design increases the likelihood that the implementation of the icon in the in-vehicle environment will improve driving and system performance and not negatively impact driver safety.
Figure 7.1 Overview of Procedures for Evaluating In-Vehicle Icons Discussion: General procedures for evaluating icons have been presented in a number of data sources, including references 1, 2, 3, and 4. Importantly, the procedures outlined in this chapter reflect an integrated approach to icon evaluation. That is, each evaluation procedure (Production Test, Appropriateness Ranking Test, Comprehension/ Recognition Test, and Matching Test) addresses different research objectives and represents a key step in an overall process of developing legible, recognizable, and interpretable in-vehicle icons. Evaluations of individual icons may not require going through the entire evaluation process. For example, if the icon development team has 3-5 strong candidate icons in-hand for a particular message, then the Production Test and the Appropriateness Ranking Test may not be needed. Similarly, if high levels of comprehension are obtained in the Comprehension/Recognition Test, then the Matching Test may not be needed. Reference 4 provides guidelines for the development and evaluation of hazard and safety symbols. Many of the guidelines contained in reference 4 for the graphic design of symbols are general, and the recommendations provided for specific symbols are not for in-vehicle applications. However, some of the symbol evaluation procedures suggested in reference 4 are similar to those contained here. Some key differences between the guidelines presented here and those presented in reference 4 are: (1) Production Test is not called out as a formal procedure in reference 4; evaluations begin by selecting or gathering "existing symbol alternatives"; (2) An Appropriateness Ranking procedure is also not specified; instead, a comprehension estimation procedure (in which subjects estimate the percentage of the driving population that would understand a candidate icon ) is used to eliminate poor candidates; (3) Criteria for acceptance following an open-ended Comprehension Test is 85 percent (versus the ISO criteria of 66 percent), with a maximum of 5 percent critical confusions; and (4) a Matching Test is not discussed. While a subset of these evaluation procedures (as well as the alternate procedures described on pages 7-4 through 7-13) may be used, the IVIS developer should be aware of the limitations inherent in such an approach. That is, key issues associated with the effectiveness of a given icon may not be addressed without a complete, integrated approach to in-vehicle icon evaluation. Design Issues: All evaluations of in-vehicle icons should be performed using test subjects who are representative of the driving public. Key demographic variables include age and gender. Age effects, in particular, can be expected for icon evaluations. Thus, individual evaluations should use a mix of younger and older test subjects. Also, representative non-English speakers should be included in testing. Cross References: General Development Process for In-Vehicle Icons, p. 2-2; Production Test, p. 7-4; Appropriateness Ranking Test, p. 7-6; Comprehension/Recognition Test, p. 7-8; Matching Test, p. 7-10; Additional Symbol Evaluation Approaches, p. 7-12 References:
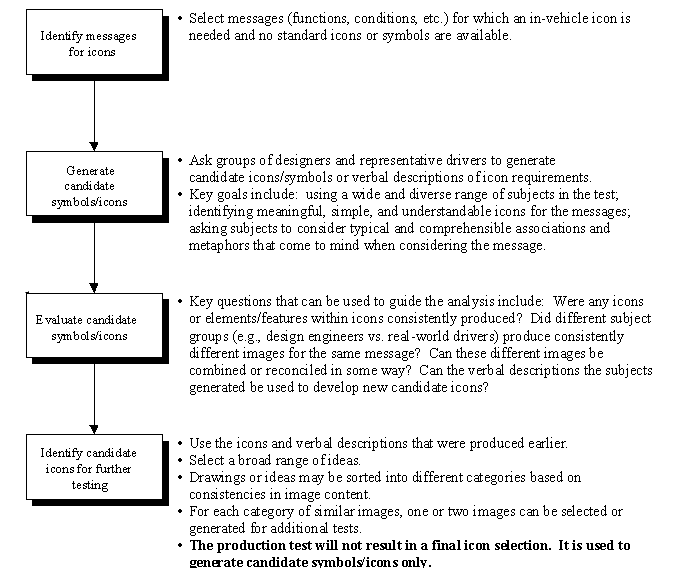
PRODUCTION TESTIntroduction: The production test refers to an icon evaluation approach in which a broad range of candidate symbols for a concept or referent (i.e., in-vehicle message) are generated. It is used when no symbols for a given message exist (reference 1). In this test, subjects are asked to draw symbols that they think represent a particular message. The output of the production test is a number of graphic or symbolic representations of a message that are considered effective and comprehensible by individual subjects. The production test will not result in a final icon selection. It is used to generate candidate symbols/icons only.
Discussion: Empirical testing of candidate icons requires a variety of candidate symbols to present to subjects. The production test has been identified by reference 1 as a key step in icon development and an important means for generating a wide range of images for subsequent testing. Reference 2 used a production test to generate ideas for symbols for common in-vehicle systems (coolant, fuel, air, oil, transmission, hydraulic, and brake), and specific conditions associated with the system (fluid level, temperature, pressure, and filter). This process generated a wide variety of candidate symbols. Importantly, variation across the symbols reflected characteristics of the subjects themselves. Some were serious, well thought out, and detailed; others were humorous and less thoughtful. Many reflected the type of work performed by the subjects, such as the mechanistic and function-oriented drawings made by subjects who were engineers. Design Issues: The production test is not, by itself, a sufficient means to validate icons or symbols. The overall goal of the production test is to create a number of different candidate symbols as input for the more systematic evaluation approaches such as the comprehension/recognition test. In addition, the production test relies on the participants' ability to conceptualize the referent and generate an icon that includes the attributes of the referent needed for a comprehensible icon. With complex or novel concepts, this may not be an efficient and effective process for icon development. An alternative is to use knowledge elicitation and concept mapping techniques to identify the elements of a comprehensible icon-that is, to conduct structured focus groups or one-on-one interviews with designers to elicit ideas about candidate icons. The objective of concept mapping, as applied to icon development, is to identify attributes of the referent that uniquely specify it and are commonly associated with it. Several structured processes exist to support this activity (see references 3, 4, and 5). In general, these processes begin by identifying concepts associated with a particular activity or system (e.g., in-vehicle routing and navigation). Once general concepts are identified, participants are queried to define distinguishing attributes and relationships. An example question might be: "How would you describe this item?" Once attributes and their relationships have been defined, a series of queries is used to refine them. Example questions might be: "Are there characteristics of this item that are not included in the list?" or "What are the most relevant characteristics in identifying this item?" Attributes identified by several users can be combined to define the features required to enhance icon comprehension. This process can be performed by manually sorting and combining the participants' responses, or by using sophisticated statistical techniques, such as factor and cluster analysis (see references 6 and 7). All evaluations of in-vehicle icons should be performed using test subjects who are representative of the driving public. Key demographic variables include age and gender. Age effects, in particular, can be expected for icon evaluations. Thus, individual evaluations should use a mix of younger and older test subjects. Cross References: Overview of General Procedures for Evaluating In-Vehicle Icons, p. 7-2; Appropriateness Ranking Test, p. 7-6; References:
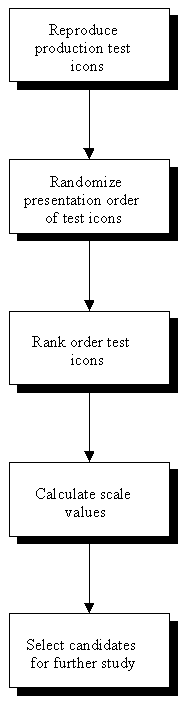
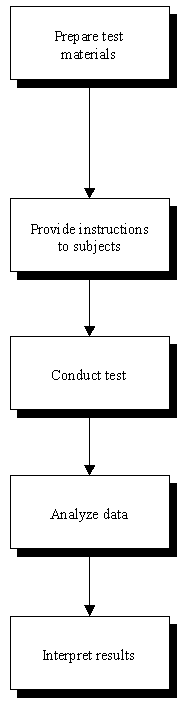
APPROPRIATENESS RANKING TESTIntroduction: The purpose of the appropriateness ranking test is to screen the candidate symbols generated during the production test and select the best for further testing. Essentially, subjects are asked to rank order a set of candidate symbols for a message with respect to their relative appropriateness. Once these ranking data have been gathered, the three candidate symbols with the highest ranking are typically selected for further testing. 
Figure 7-3. Appropriateness Ranking Test Discussion: A preliminary screening of candidate icons for a message is necessary to make further testing of the icons feasible and cost-effective (see also reference 1). The appropriateness ranking test provides an objective, quick, low-cost approach to the task of reducing what can be a large number of candidate icons to a more manageable number of high-potential candidates. The appropriateness ranking test has been successfully used in previous symbol development efforts. For example, in reference 2, six messages were tested using the procedure described above, with between eight and 35 candidate symbols being rank ordered for each message. In this study, the results of the appropriateness ranking test allowed the researchers to reduce, in a systematic manner, the number of these candidates to about three per message. The advantage of converting rank order data to an interval scale of perceived appropriateness is that rank orders alone do not indicate the relative differences among judged stimuli. Thus, mean ranks suggest that differences in perceived appropriateness between, for example, stimuli 1 and 2 are the same as differences between stimuli 2 and 3. The Categorical Scaling Procedure provides the interval data necessary to make informed decisions regarding the true relative appropriateness of candidate icons. Design Issues: When developing candidate icons for the test, consider that driver perception and performance will vary as a function of the medium used to present the test stimuli. That is, display parameters such as resolution, production of color, and luminance can affect responses. In general, the color, brightness, resolution, and size of test icons should be as close as possible to how the icons will be viewed by drivers in the in-vehicle environment. As noted in reference 4, the appropriateness ranking test should not be used to make final selections of icons. Considerable experimental data suggest that more detailed, concrete icons are consistently judged to be more appropriate and given higher ranks than more abstract icons. However, highly detailed icons may lead to increased response times, are more easily confused with other icons, and are not always consistent with the need to provide simple visual information through in-vehicle displays. Thus, the appropriateness ranking test helps to identify candidate icons based on image content only, and cannot address more complex issues such as the comprehensibility of icons in an operational environment. Often, subjects will be unable to distinguish the appropriateness of a given icon from another. Subjects should be instructed that the same ranking (or a tie) can be given to more than one candidate icon. All evaluations of in-vehicle icons should be performed using test subjects who are representative of the driving public. Key demographic variables include age and gender. Age effects, in particular, can be expected for icon evaluations. Thus, individual evaluations should use a mix of younger and older test subjects. Cross References: Overview of General Procedures for Evaluating In-Vehicle Icons, p. 7-2; Production Test, p. 7-4; Comprehension/Recognition Test, p. 7-8; Matching Test, p. 7-10; Additional Symbol Evaluation Approaches, p. 7-12; Tutorials: Analysis of Rank Order Data, p. 9-1 References:
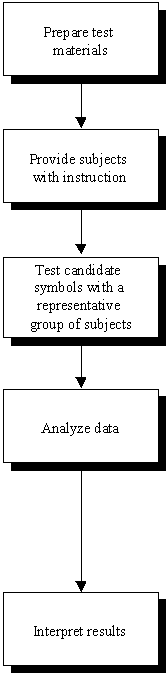
COMPREHENSION/RECOGNITION TESTIntroduction: The comprehension/recognition test refers to an evaluation technique that provides a means to determine which of a number of candidate icons/symbols for a concept are best understood by a sample of subjects who represent the user population. During this test, an icon/symbol is presented to subjects, the context of the icon/symbol is specified (i.e., where they might expect to see the icon, according to reference 1), and subjects are asked to name the object, location, or activity associated with the icon/symbol.
Figure 7-4. Comprehension/Recognition Test Discussion: Reference 1 has been developed as a standard procedure for developing and testing public information symbols. This standard provides a highly detailed set of instructions for testing symbols. Some computational procedures in reference 1, however, are unnecessarily complex and the guidelines presented on the preceding page represent a summary of the procedures listed in references 1 and 3. Design Issues: When developing candidate icons for the test, consider how driver perception and performance will vary as a function of the medium used to present the test stimuli. That is, display parameters such as resolution, production of color, and luminance can affect responses. In general, the color, brightness, resolution, and size of test icons should be as close as possible to how the icons will be viewed by drivers in the in-vehicle environment. All evaluations of in-vehicle icons should be performed using test subjects that are representative of the driving public. Key demographic variables include age and gender. Previous studies have indicated that significant differences exist between younger people and older people in their ability to comprehend symbols (references 4 and 5). Therefore, subjects should be representative of the user population (e.g., half between the ages of 18 and 40 and the other half over 55 years). In real-world driving, icons are presented in the context of certain in-vehicle capabilities and driving circumstances. As such, evaluations of in-vehicle icons should include a description of the context in which icons will be presented and used. However, icon evaluations should avoid providing either too little or too much context to experimental subjects. If too little context is provided, unrealistically low comprehension scores may result from subjects' being unable to connect a visual icon with its many possible meanings. Too much context may yield unrealistically high comprehension scores because the subjects have been cued for a certain response by the specificity of the context. Both extremes should be avoided. In chapter 9, a tutorial entitled "Providing Subjects with Context During Icon Evaluations" provides both procedures and examples associated with providing appropriate context to experimental subjects. Candidate icons should be tested individually, as the focus is on testing absolute comprehension/recognition for individual icons. The goal is not to test confusability across icons (as it is in the matching test). Cross References: Overview of General Procedures for Evaluating In-Vehicle Icons, p. 7-2; Production Test, p. 7-4; Appropriateness Ranking Test, p. 7-6; Matching Test, p. 7-10; Additional Symbol Evaluation Approaches, p. 7-12; Tutorials: Providing Subjects with Context During Icon Evaluations, p. 9-11 References:
MATCHING TESTIntroduction: After the best or most appropriate design for a symbol has been determined, it is important to examine how well that symbol will work within a set and whether the many symbols within the set, can be discriminated from one another without confusion. To do this, a Matching Test is performed. Subjects are shown a sheet with all of the symbols from a set on it, arranged in a matrix, and told the context under which they would use these symbols. Next, subjects are given a referent name and asked to indicate on the matrix which one of the symbols stands for that particular referent. The outcome of the matching test is two measures of symbol effectiveness: the number of correct choices of a particular symbol, and the degree of confusion among symbols.
Figure 7-5. Matching Test Discussion: The Matching Test measures the specific association between the content of an icon and an in-vehicle message when the icon is presented to a subject at the same time as other icons within an icon set (see also reference 1). Subjects are only tested on one icon per symbol set to avoid non-independence of their choices. If multiple icons within a symbol set were tested, individual choices would be dependent on previous choices, thus confounding the results. Data from the Matching Test can be represented in two ways. First, indicate the number of correct choices for a particular symbol by calculating the percentage of correct responses for each symbol/message combination. Second, construct a table with icons in the set as columns and messages as rows. Cell entries can show overall percentages associated with the subjects responses. Thus, incorrect as well as correct responses are depicted in the table (also called a confusion matrix). If the scores from the Matching Test are acceptable to the design team, the testing may be complete. However, if some scores are too low, additional icon development and evaluation may be needed. Design Issues: When developing candidate icons for the test, consider that driver perception and performance will vary as a function of the medium used to present the test stimuli. That is, display parameters such as resolution, production of color, and luminance can affect responses. In general, the color, brightness, resolution, and size of test icons should be as close as possible to how the icons will be viewed by drivers in the in-vehicle environment. Importantly, the Matching Test does not measure any absolute trait of individual symbols, nor measure absolute comprehension or recognition associated with a candidate icon. All measures relate to subjects' ability to match an icon with a message within the context of other related icons. In this regard, icon developers often wish to develop families or groups of icons that share some common purpose or meaning (e.g., collision avoidance). Groups or families of icons typically share some common design element such as color, border, size, or graphic style. The Matching Test may provide an ideal method for evaluating subjects' ability to discriminate between related and nonrelated icons. In real-world driving, icons are presented in the context of certain in-vehicle capabilities and driving circumstances. As such, evaluations of in-vehicle icons should include a description of the context in which they will be presented and used. However, icon evaluations should avoid providing either too little or too much context to experimental subjects. If too little context is provided, unrealistically low comprehension scores may result from subjects' being unable to connect a visual icon with the many possible icon meanings. If too much context is provided, unrealistically high comprehension scores may result because the subjects have been cued for a certain response by the specificity of the context. Both extremes should be avoided. In chapter 9, a tutorial provides both procedures and examples associated with providing appropriate context to experimental subjects. Cross References: Overview of General Procedures for Evaluating In-Vehicle Icons, p. 7-2; Production Test, p. 7-4; Appropriateness Ranking Test, p. 7-6; Comprehension/Recognition Test, p. 7-8; Additional Symbol Evaluation Approaches, p. 7-12; Tutorials: Providing Subjects with Context During Icon Evaluations, p. 9-11 References: 1. Zwaga, H., and Easterby, R. S. (1984). Developing effective symbols for public information. In R. Easterby and H. Zwaga (Eds.), Information design: The design and evaluation of signs and printed material (pp. 277-297). New York: J. Wiley & Sons. ADDITIONAL SYMBOL EVALUATION APPROACHESIntroduction: In addition to the evaluation approaches described in the previous guidelines in this chapter, a number of additional approaches have been suggested and successfully used to evaluate the effectiveness of icons.
Table 7-1. Summary of Additional Symbol Evaluation Approaches
Discussion: In many icon and in-vehicle display development efforts, there is insufficient time or budget available to conduct the sequential, inter-dependent series of evaluations described in the preceding design guidelines. This design guideline, therefore, identifies additional evaluation techniques that have been used and described in the human factors and icon development literature. Design Issues: The selection of an appropriate evaluation approach should reflect specific empirical objectives, as well as the driver messages, expected driving context, and design constraints associated with individual in-vehicle icons or symbols. For example, if human response times to a particular icon are important for its effectiveness, then evaluation should include dependent measures that will capture this information. In this particular case, the optimal icons will be those that satisfy icon comprehension and discrimination with the shortest response time. The evaluation of other icons or sets of icons may focus more on different types of measures and thus will require a completely different type of evaluation process. All evaluations of in-vehicle icons should be performed using test subjects who are representative of the driving public. Key demographic variables include age and gender. Age effects, in particular, can be expected for icon evaluations. Thus, individual evaluations should use a mix of younger and older test subjects. Cross References: Overview of General Procedures for Evaluating In-Vehicle Icons, p. 7-2; Production Test, p. 7-4; Appropriateness Ranking Test, p. 7-6; Comprehension/Recognition Test, p. 7-8; Matching Test, p. 7-10 References:
|