U.S. Department of Transportation
Federal Highway Administration
1200 New Jersey Avenue, SE
Washington, DC 20590
202-366-4000


Skip to content
Facebook iconYouTube iconTwitter iconFlickr iconLinkedInInstagram

Federal Highway Administration Research and Technology
Coordinating, Developing, and Delivering Highway Transportation Innovations

Techbrief
This techbrief is an archived publication and may contain dated technical, contact, and link information
Publication Number: FHWA-HRT-04-092
Date: April 2004

A Review of the Signalized Intersections: Informational Guide

FHWA Contact: Joe Bared,
HRDS-05, (202) 493-3314, Joe.Bared@dot.gov

Introduction

In 2002, 21 percent of crashes and 24 percent of all fatalities and injury collisions occurred at signalized intersections. Because traffic signals play an important role in improving safety at intersections, the Federal Highway Administration (FHWA) has produced a comprehensive guide titled Signalized Intersections: Informational Guide, which provides methods for evaluating the safety and operations of signalized intersections and tools to remedy deficiencies.

The information contained in this guide is based on the latest research available. The guide's information and tools will help practitioners make insightful intersection assessments and understand the tradeoffs of potential improvement measures. Additional resources and references are highlighted for those who wish to learn more about a particular subject.

The guide includes examples of novel treatments and best practices in use by jurisdictions across the United States. These treatments include low-cost measures such as improvements to signal timing and signs, and high-cost measures such as intersection reconstruction or grade separation. Although some treatments apply only to high-volume intersections, information in the guide applies to signalized intersections of all volume levels.

This publication is not intended to replicate or replace traditional traffic engineering documents such as the Manual on Uniform Traffic Control Devices, the Highway Capacity Manual, and the American Association of State Highway and Transportation Officials' A Policy on Geometric Design of Highways and Streets, nor is the guide intended to serve as a standard or policy document.

Overview

The guide takes a holistic approach to address signalized intersections and considers the safety and operational implications of a particular treatment on all system users (including motorists, pedestrians, bicyclists, and transit riders). It is organized into three parts:
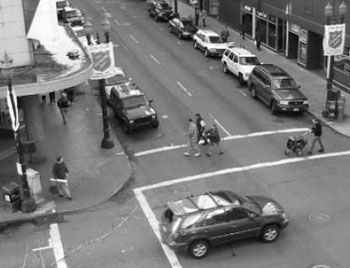
  1. Fundamentals.
  2. Project Process and Analysis Methods.
  3. Treatments.

I. Fundamentals

Chapter 1. Introduction. This section of the guide introduces practitioners to three topic areas, each in its own chapter: road user needs, geometric design, and traffic design and illumination.

Chapter 2. User Needs. This chapter begins with an overview of human factors research and describes the different needs of motorists, pedestrians, and bicyclists. The chapter concludes by discussing how to apply human factors principles to planning, designing, and operating high-volume signalized intersections. For an example of one of these concepts, see figure 1.

Figure 1. Photo. Many people who use crosswalks are traveling at different speeds. Pedestrian walking speeds generally range between 0.8 to 1.8 meters per second (2.5 to 6.0 feet per second). The picture shows a city street with a crosswalk and pedestrians with different speed characteristics. A man pushes a baby stroller, and three other pedestrians crossing the street on a marked crosswalk.
Figure 1. Many people who use crosswalks are traveling at different speeds. Pedestrian walking speeds generally range between 0.8 to 1.8 meters/second (2.5 to 6.0 feet/second).

Chapter 3. Geometric Design.The next chapter presents guidelines for signalized intersections based on a review of technical literature and current design policy in the United States. This chapter addresses principles of channelization; number of intersection approaches; intersection angle; horizontal and vertical alignment; corner radius and curb ramp design; detectable warnings; access control; sight distance; and pedestrian and bicycle facilities. For an example of one of these concepts, see figure 2.

Figure 2. Diagram. A dedicated left-turn lane reduces potential collisions between vehicles that are turning left and those that are moving through the intersection, which increases the capacity of the approach for both types of traffic. The diagram shows a four-lane, four-way intersection. The east/west road has dedicated left-turn lanes to store left turning vehicles to increase approach capacities for all traffic and reduce potential collisions between through- and left-turning vehicles
Figure 2. A dedicated left-turn lane reduces potential collisions between vehicles that are turning left and those that are moving through the intersection, which increases the capacity of the approach for both types of traffic.

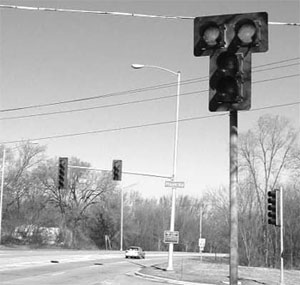
Chapter 4. Traffic Design and Illumination. This chapter highlights the fundamental principles of traffic design and illumination as they apply to signalized intersections. It includes a discussion of traffic signal hardware and software (the infrastructure that assigns vehicular and pedestrian rights-of-way at locations where conflicts or hazardous conditions exist). Properly applying and designing traffic signals are key components in improving an intersection's safety and efficiency. For an example of one of these concepts, see figure 3.

Figure 3. Diagram. Typical phasing diagram illustrating a right-turn overlap. Right turns are operated on overlap phases to increase efficiency for the traffic signal. Overlap outputs are associated with two or more phase combinations. The eight phases are: (1) west-pointing protected left arrow, (2) east/west pedestrian and two east-pointing arrows, straight black protected phase, and left-turning permissive phase, (3) north protected left arrow and east protected right arrow (Overlap A), (4) north/south pedestrian and two south-pointing arrows, straight black protected phase, and left-turning permissive phase arrow, (5) black protected left east arrow, (6) east/west pedestrian phase with two west-pointing arrows, straight protected phase, and right-turning permissive phase, (7) south protected right-turning arrow, and (8) north/south pedestrian phase with two north arrows, straight protected, and right-turning permissive.
Figure 3. Typical phasing diagram illustrating a right-turn overlap.


Common Stakeholder Concerns

Motorists

  • Cycle failure
  • Long delays
  • Queue spillback
  • Poor progression
  • Inefficient signal timing
  • Numerous crashes
  • High crash severity
  • Poor sight distance
  • High vehicle speeds
  • Confusing signs

Pedestrians

  • Inadequate facilities
  • Long wait times
  • Wide crossing distance
  • Fast vehicles
  • Poorly located ramps/push buttons
  • Numerous conflicts with other users
  • Confusion regarding when to begin crossing

Transit Riders

  • Bus stop inaccessible/ poorly located
  • Bus stop impedes vehicle movement
  • Traffic stream merge is difficult

Bicyclists

  • Inadequate facilities
  • Low clearance interval
  • Ineffective lane striping
  • Unsafe/numerous conflicts with vehicles

Facility Managers

  • Local/Statewide policy not met
  • Noncompliance with corridor plan, transportation system plan, comprehensive plan, etc.
  • Construction effects and traffic maintenance
  • Fiscal, land use, and right-of-way constraints

II. Project Process and Analysis Methods

This section of the guide discusses project process, safety analysis methods, and operational analysis methods.

Chapter 5. Project Process. The section begins by describing a standard process for conducting an intersection design/re-design project. First, project managers should identify stakeholders, determine the scope of analysis, collect data, and identify key issues of concern. From this information, the team can develop a problem statement and identify potential countermeasures or treatments, then evaluate potential treatments for feasibility and effectiveness. After practitioners choose a treatment, the improvement is implemented and monitored over time. This chapter includes issues to consider and questions to ask during the design process. For a list of common stakeholder concerns, see text box at right.

Chapter 6. Safety Analysis Methods. Practitioners must carefully consider safety, mobility, cost, and available resources when designing, operating, managing, and rehabilitating roadways. The chapter on safety analysis methods discusses explicit safety considerations and the development of quantifiable safety information to enhance the flexible design process. It also describes a set of tools that professionals can use to assess the safety performance at a signalized intersection. For an example of one of these concepts, see figure 4.

Figure 4. Flowchart. Steps to identify potential problems. This flowchart identifies the steps to perform a safety diagnosis to determine causal factors for collisions in intersections. The steps are: assemble the collision data, perform a collision diagnostic analysis, determine overrepresentation, and conduct a site visit. If the information collected is satisfactory, then the define problem statement box follows. If the information collected is not satisfactory, then the traffic engineer must conduct further studies such as positive guidance (screen the roadways for information deficiencies, expectancy violations and workload issues) and traffic conflict analysis.
Figure 4. Steps to identify potential problems.


Chapter 7. Operational Analysis Methods. The ability to measure, evaluate, and forecast traffic operations is a fundamental element of effectively diagnosing problems and selecting appropriate treatments for signalized intersections. A traffic operations analysis should describe how well an intersection accommodates demand for all user groups. The operational analysis methods chapter describes key elements of signalized intersection operations and provides guidance for evaluating results. Practitioners can use traffic operations analyses at a high level to size a facility and at a refined level to develop signal timing plans. For an example of one of these concepts, see figure 5.

Figure 5. Flowchart. Graphical and tabular summary of the Quick Estimation Method. (1) The first box, movements, shows straight and bent arrows in every direction. Identify the movements and assign hourly traffic volumes per lane. (2) The next step shows signal movement boxes that are to be arranged in a signal-phasing plan. (3) For the critical phase volumes, determine the highest lane volume served in that phase. (4) Then all the critical phase volumes are summed. (5) For the intersection capacity, determine the maximum critical volume that the intersection can accommodate. (6) Next determine the critical volume-to-capacity ratio. (7) The last step is to determine the intersection status from the critical volume-to-capacity ratio.
Figure 5. Graphical and tabular summary of the Quick Estimation Method.

III. Treatments

The guide's final section describes five types of treatments.

Chapter 8. System-Wide Treatments. These apply to roadway segments located within the influence of signalized intersections and to intersections affected by traffic flow along a corridor. These treatments primarily address safety concerns associated with rear-end collisions, turbulence related to vehicles turning midblock from driveways or nonsignalized intersections, and coordination deficiencies associated with how traffic progresses from one location to another. For an example of one of these concepts, see figure 6.

Figure 6. Diagram. Access management requiring U-turns at an unsignalized, directional median opening. The diagram shows a four-leg intersection to the left. Since the vehicle can only turn right from the access road, the turn lane at the unsignalized directional median with channelization islands permits a U-turn so that the driver can travel to the left or east.
Figure 6. Access management requiring U-turns at an unsignalized, directional median opening.

Chapter 9. Intersection-Wide Treatments. This chapter discusses treatments that address non-auto modes, traffic control/signal timing, and illumination. There are five types of intersection-wide treatments: pedestrian, bicycle, transit, traffic control, and illumination. For an example of one of these concepts, see figure 7.

Figure 7. Diagram. Typical lighting layouts. The drawing shows a major four-lane road intersected by a crossroad. The solid luminaries are the four units required for partial lighting, located on the northwest and southeast corners of the main road and at the junctures of the jug handles. The hollow luminaries are spaced farther from the intersection on both sides of the major east/west road and the west side of the crossroad to provide continuous lighting.
Figure 7. Typical lighting layouts.


Chapter 10. Alternative Intersection Treatments. This chapter describes three categories of alternative intersection treatments: intersection reconfiguration, at-grade indirect movements, and grade separation. Many of these treatments are commonplace, while others have seen limited or regional use, but all of them aim to reduce conflict points at the intersection. This enhances safety and operations by reducing the number of phases and conflicting volume at a single location. These reconstruction treatments are often necessary when relatively low-cost treatments such as improving signal timing and signing or adding an auxiliary lane will not solve the existing problem. For an example of one of these concepts, see figure 8.

Figure 8. Diagram. Diagram of a continuous flow intersection. The figure depicts a continuous flow intersection. Left-turning vehicles cross over opposing traffic upstream of the intersection, travel on the left side of opposing traffic up to the intersection, and turn left without conflict from the opposing traffic. The figure provides several example dimensions: 350 ft of left-turn storage upstream of the crossover, a crossover length of 125 ft, a distance between the crossover and the main intersection of 325 ft, a right-turn storage length of 250 ft, and a right-turn acceleration lane of 300 ft.
Figure 8. Diagram of a continuous flow intersection.

Chapter 11. Approach Treatments. These treatments ensure that approaching motorists, bicyclists, or pedestrians can see that an intersection is ahead, and that a traffic signal is controlling the traffic flow. Adequate signs and pavement markings help drivers choose an appropriate lane and travel direction. The pavement on the approaches gives drivers a smooth, skid-resistant surface, with adequate drainage. Intersection approaches ideally should meet at right angles, be at-grade, and free of unnecessary clutter and obstacles. Sight distance for all approaches should be adequate for drivers proceeding through the intersection, particularly those making a left turn. For an example of one of these concepts, see figure 9.

Figure 9. Photo. Photo of signal head using a double red signal indication. The photo shows a signalized intersection with a signal head that has a double-red signal indication on the near side of the intersection. The double-red indications are positioned side-by-side and are centered above the vertical yellow and green indications.
Figure 9. Photo of signal head using a double red signal indication.

Chapter 12. Individual Movement Treatments. These treatments influence how vehicles travel through signalized intersections and how they make left-, right-, and U-turns at these intersections. These treatments also affect variable lane use. Individual movement treatments help reduce rear-end collisions under congested conditions; collisions involving left-turning vehicles; bicycle and pedestrian crashes; and traffic delays. For an example of one of these concepts, see figure 10.

Figure 10. Diagram. Example of positive offset. This diagram shows an example of a positive offset where the left-turn lanes are positioned further to the left, which removes them from the sight lines of opposing left-turn drivers. The diagram on the left shows a normal left turn lane with no offsets. The right diagram shows shaded portions or buffers on both lanes on the right side turn lane parallel to the through travel route. This marking causes left-turning drivers to position closer to the median and improves sight distance.
Figure 10. Example of positive offset.

Various Types of Alternative Treatments

Figure 11. Diagram. Diagram of a median U-turn crossover from the main line with a narrow median. The intersection shows four legs with four lanes of traffic and a turn lane. The medians are narrow, and the pavement is widened using jughandles to accommodate the turning radius of large vehicles making the U-turn.
Figure 11. Diagram of a median U-turn crossover from the main line with a narrow median.

Figure 12. Diagram. Diagram of a jug handle intersection. The diagram shows a four-lane offset intersection with medians. The main road has an angled jug handle that connects to the north/south road. The length of the ramp should be sufficient for traffic volume and storage. Ramps can be one- or two-lane design. Jug handles divert left turning traffic away from the main intersection unto the cross-road.
Figure 12. Diagram of a jughandle intersections


Figure 13. Diagram. Diagram of a quadrant roadway intersection. The diagram shows a quadrant roadway located in the lower left quadrant of the intersection. The quadrant roadway serves all traffic that desires to turn left at the major intersection.
Figure 13. Diagram of a quadrant roadway intersection.


Figure 14. Diagram. Illustration of a split intersection. A split intersection divides the major road into one-way streets, each having a separate intersection with the minor street. The shape of the intersection is similar to that of a diamond interchange but without the grade separation.
Figure 14. Illustration of a split intersection.


Figure 15. Diagram. Illustration of a super-street median crossover. A super-street median crossover can operate with two independent two-phase signals, one for each direction of the major street. For each intersection, the first phase allows protected right turns from the minor street, left turns from the major street, and north/south pedestrian crossings. The second phase allows east/west pedestrian crossings, major street through traffic, and permissive right turns.
Figure 15. Illustration of super-street median crossover.


Figure 16. Diagram. Conflict point diagram for two closely spaced T-intersections. Each T-intersection shows nine total potential conflicts, three each diverging, merging, and crossing. Compared to a four-leg signalized intersection, two closely spaced T-intersections have fewer merge/diverge and left-turn crossing conflicts and no angle crossing conflicts.
Figure 16. Conflict point diagram for two closely spaced T-intersections.

Researcher—This study was performed by Kittelson & Associates, Inc., Synectics Transportation Consultants, Inc., CH2M Hill, Inc., and Ken Courage, in a contract through Battelle, Inc.

Distribution—This TechBrief is being distributed according to a standard distribution. Direct distribution is being made to the Divisions and Resource Centers.

Availability—The report will be available in Fall 2004 and may be obtained from the FHWA Report Center by e-mail to report.center@fhwa.dot.gov, by fax to 301–577–1421, by phone to 301–577–0818, or online at www.fhwa.dot.gov/research/topics/safety/intersections/.

Key Words—Signalized intersections, high volume intersections, unconventional treatments.

Notice—This TechBrief is disseminated under sponsorship of the U.S. Department of Transportation in the interest of information exchange. The TechBrief provides a synopsis of the study’s final publication.

The TechBrief does not establish policies or regulations, nor does it imply FHWA endorsement of the conclusions or recommendations. The U.S. Government assumes no liability for the contents or their use.

Federal Highway Administration | 1200 New Jersey Avenue, SE | Washington, DC 20590 | 202-366-4000
Turner-Fairbank Highway Research Center | 6300 Georgetown Pike | McLean, VA | 22101