U.S. Department of Transportation
Federal Highway Administration
1200 New Jersey Avenue, SE
Washington, DC 20590
202-366-4000
Federal Highway Administration Research and Technology
Coordinating, Developing, and Delivering Highway Transportation Innovations
 |
| This techbrief is an archived publication and may contain dated technical, contact, and link information |
|
Publication Number: FHWA-HRT-07-031
|
|||||||||||||||||||||||||||||||||||||||||||||||||||||||||||||||||||||||||||||||||||||||||||||||||||||||||||||||||||||||||||||||||||||||||||||||||||||||||||||||||||||||||||||||||||||||||||||||||||||||||||||||||||||||||||||||||||||||||||||||||||||||||||||||||||||||||||||||||||||||||||||||||||||||||||||||||||||||||||||||||||||||||||||||||||||||||||||||||||||||||||||||||||||||||||||||||||||||||||||||||||||||||||||||||||||||||||||||||||||||||||||||||||||||||||||||||||||||||||||||||||
Safety Assessment of Interchange Spacing on Urban FreewaysFHWA Contact: Joe Bared, HRDS-05, (202) 493-3314, or PDF Version (207 KB)
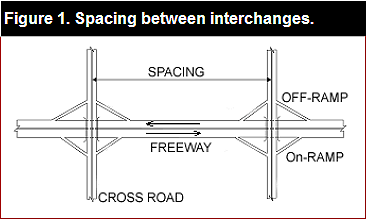
PDF files can be viewed with the Acrobat® Reader® ObjectiveThe decision to build a new interchange between an existing pair of interchanges is made by evaluating whether there is sufficient need for traffic to enter and/or exit the freeway at that location. The obvious intent is to reduce the systemwide travel times and delays for all users by providing convenient freeway access and egress. Although there are ways to evaluate these operational benefits quantitatively, to date researchers have not expressed in measurable terms the compromise in safety, or the increase in crashes per mile of freeway. This knowledge is essential for conducting a comprehensive cost-benefit analysis of new interchange construction projects. To fill this void, we endeavored to study interchange spacing from a safety perspective by estimating regression models to express crash frequencies as a function of highway characteristics, including interchange spacing. We then used the regression models to quantify the crash sensitivity to interchange spacing for fatal and injury crashes. We used data pertaining to freeway sections from 7 urban freeways in California and 10 urban areas in Washington for building the regression models. IntroductionSpacing is defined as the distance between intersecting streets with freeway ramps, as shown in figure 1. According to guidelines of the Access Management Manual (1), a minimum of 4.8 kilometers (km) (3 miles (mi)) of spacing between interchanges is recommended in urban areas for "good route guidance signing and decision distance" under high-speed, high-volume urban/suburban conditions. The manual recommends a minimum of 9.7 km (6 mi) of space in rural areas. The rule of thumb included in the American Association of State Highway and Transportation Officials publication, A Policy on Geometric Design of Highways and Streets (known as the "Green Book") is that there should be a minimum spacing between interchanges of 1.6 km (1 mi) in urban areas and 3.2 km (2 mi) in rural areas between crossroads. Ingham and Burnett (3) have compared interchange spacing guidelines in various countries and have proposed a set of guidelines for Gauteng province in South Africa. Table 1 summarizes their review on spacing guidelines in different countries. Satterly and Berry (4) have developed and tested a model for analyzing the problem of determining the optimum spacing in the context of traffic operations and economics perspective (construction costs and costs to the users). This cursory review of research to date suggests that the problem of interchange spacing has been addressed mainly from an operations perspective, which is the primary consideration in the decision to build a new interchange between a pair of existing interchanges. The only publication found to address the interchange spacing safety problem was based on research conducted in the 1960s by Cirillo (5) on the crash rates on the interstate system in the United States. Among her findings was an indication that the crash rate (number of crashes per 100 million vehicle miles)
V*—design speed in km/h in the section between interchanges increased with the proximity to interchange entry/exit ramps ahead. California Data and Model DevelopmentThe California dataset consists of 95 different spacing observations. The following data were considered for predicting crashes within the identified interchange spacing: -Number of crashes within each identified spacing. -Average annual daily traffic (AADT) on the freeway, onramps, and offramps. -Freeway geometry variables including spacing, whether the freeway is divided or undivided, width of the right and left shoulders, median type and width, number of lanes, presence of high occupancy vehicle (HOV) lanes, and auxiliary lanes. The final selected sample of 95 observations, compiled in table 3, is from 7 California urban freeways: Interstates 5, 10, 15, 80, 580; U.S. Route 101; and State Freeway 99. From 1998 to 2002 in California, the researchers observed 34,788 crashes, of which 32 percent were fatal and injury crashes. While AADT ranged from 50,000 to 274,000 vehicles per day, the average AADT was 166,264 vehicles per day. The spacing varied from 0.9 km to 5.5 km (0.55 mi to 3.44 mi), with an average length of 2.3 km (1.41 mi). For each interchange spacing observation, the researchers extracted corresponding data from the Highway Safety Information System (HSIS) for 5 years of crash records from 1998 to 2002 for all crashes occurring on the freeway. All freeway characteristics also were extracted from HSIS. In the screening process, all observations that had any construction activity within these 5 years, such as adding more lanes, increasing or decreasing the width of the median or shoulder, or construction of a new interchange within the original spacing, were omitted from the sample. The researchers developed the crash models described in equations 1 and 2 using the SAS software. The GENMOD procedure was used to accommodate a negative binomial distribution of crashes in developing regression models for total crashes, and fatal and injury crashes. Total crashes include fatal and injury crashes in addition to property damage. Fatal and injury crashes include fatal crashes, and those involving severe injury, other visible injury, and complaint of pain. Equation 1. Total crash prediction model derived from California crash data.
Equation 2. Fatal and injury crash prediction model derived from California crash data.
Where, in equations 1 and 2: —TC is the total crashes within the freeway interchange spacing segment. —FI is the fatal/injury crashes within the freeway interchange spacing segment (that is, all crashes except property damage only ones). —AADT is the annual average daily traffic of the freeway section measured at the midpoint of the section. —AADT/Lane is the freeway AADT divided by total number of lanes (NUMLANES) at the midpoint of the section. Number of lanes includes through lanes plus HOV and other auxiliary lanes greater than 0.32 km (0.2 mi) long. —SPACING is the segment length from crossroad to crossroad (see figure 1). —RRATIO is total RAMP AADT divided by Freeway AADT. Total ramp AADT is calculated by adding the total onramp AADT and total offramp AADT regardless of the ramp type—diamond, clover leaf, partial cloverleaf, or directional within the spacing segment. —HOV equals 0 for no HOV lane, and 1 for one HOV lane in both directions. —MEDWID is the median width in feet. —MEDTYP equals 0, for paved median, and 1 for unpaved median. —y is number of years. —LN is natural logarithm. The researchers systematically carried out several trials to develop the best model. The models were assessed by the size of the estimated negative binomial dispersion parameter (K) and a pseudo-R2, termed R2α (as defined later). The following models were developed for total crashes and for fatal/injury crashes having the lowest dispersion parameter of K = 0.11 for both types of crashes, and the highest goodness-of-fit measures R2α = 0.68 and 0.67 respectively for total crashes, and fatal and injury crashes. Washington Data and ValidationWashington State data acquired from HSIS have a comparable format to California data, with few limitations. No HOV-lane statistics were available in the Washington data, and median type (paved or unpaved) is highly and significantly correlated with median width. The sample size is 100 observations of spacing on urban freeways, without considering freeway-to-freeway interchanges. The sample includes freeways from nine urban areas. Before combining the Washington and California data, the California model was validated with Washington data using total and fatal and injury crashes. According to the California model, the presence of an HOV lane is associated with a 40 percent increase in freeway crashes in a segment. HOV lanes are located on the left side, and entrances and exits are on the right side. The California model was rerun without these two variables to validate with Washington data and eventually to decide on merging both State samples. Equations 3 and 4 describe the best California prediction models for fatal and injury, and for total crashes. The equations are models for total crashes and fatal and injury crashes rerun with two explanatory variables omitted—HOV and median type. These two variables were not considered because of the high correlations with median width (median type), and because there is no HOV data available in the State of Washington. Still, models are accurate to an acceptable degree when measured by R2. The revised models are equally acceptable, with highly significant coefficients for all independent variables, and with comparable goodness-of-fit measures to the original model. Rα2 values are 0.63 for the total crashes model, and 0.62 for the fatal and injuries model. To assess the similarity of California and Washington data, the researchers estimated several statistical measures after using the revised California models to predict crashes on the Washington spacing segments, including equations 5 through 9. Equations 5 through 9 show statistical validation expressing relationships between datasets from individual States and years. The more the data are related, the more they are statistically valid for prediction in a single, combined model. Using the combined model increases sample size and reduces uncertainty in regression relationships. Equation 3. Revised total crash prediction model derived from California crash data (used to validate Washington data).
Equation 4. Revised fatal and injury prediction model derived from California crash data (used to validate Washington data).
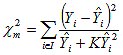
Equation 5. Coefficient of determination.
Equation 6. Mean prediction bias.
Equation 7. Mean absolute deviation.
Equation 8. Mean square error.
Equation 9. Modified chi-square.
Where, in equations 5 through 9: —Yi is observed number of crashes for i-th segment in the WA data. —Ŷi is the predicted number of crashes for i-th WA segment from the CA model. —K is the dispersion parameter of the negative binomial model for California. —n is the number of segments in the WA sample. —I is an integer from 1 to n. Validation results comparing predicted crash frequencies (from the California model) with actual Washington data are shown in table 2. For fatal and injury crashes, the R2 is comparable to that of the revised California model, and the modified chi-square computed score (123.8) is within the 95 percent confidence interval (73.70 to 128.09). As the null hypothesis of equality between the predicted (from the California data) and observed (Washington data) cannot be rejected based on X2 test, the two data samples from both States may be merged to derive a combined crash prediction model for fatal and injury crashes. For total crashes, the modified chi-square is outside the 95 percent confidence interval, and all other validation measure deviations are considerably higher than the deviations for fatal and injury data (MPB, MAD, and MSE). Total crash data for Washington and California are therefore not suitable for merging, because predicted and observed data are significantly different. Combined Model Data and Summary StatisticsWashington and California data were combined to form one dataset containing 195 observations (95 from California and 100 from Washington). Summary statistics of separate and combined data are shown in tables 3 and 4.
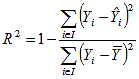
Median and mean spacings between consecutive crossroads are 2.1 and 2.3 km (1.31 and 1.42 mi), with median and mean distance from crossroads to ramp noses 0.39 and 0.42 km (0.24 and 0.26 mi) (standard deviation = 0.15) respectively. Distances from ramp nose to crossroads are an indication that very few interchanges had collector-distributor roads on full cloverleaf interchanges. A review by selected variables between the two States reveals lower Washington values of both independent and dependent variables compared to California data. Average AADT per lane in Washington State was 23 percent lower than in California, and average total ramp AADT was 45 percent lower in the Washington data. Thus, fatal/injury and total crash frequencies are noticeably lower in Washington due to lower AADTs. Pearson's correlation coefficients indicated a very high correlation among freeway AADTs, numbers of lanes, and ramp AADTs. Median type and width also were highly correlated. To improve the model form and meaning, freeway AADT and number of lanes were combined as AADT/lane, and median type was omitted from the model. Most of the variations in the combined models may be attributed to freeway AADT and total ramp AADT, both highly significant variables. Natural log of segment length also is highly significant and had better explanatory power than simply segment length. Although not shown, the "State" indicator variable was not significant. No significant correlations were found between the independent variables log of spacing, log of AADT/lane, and log RAMPAADT. The model fit is satisfactory when assessed by the dispersion parameter-based Ra2 for fatal/injury crashes. Ra2 for the combined new model is 0.71, higher than the original Ra2 for the California model, as shown in table 5. The derived combined model is as shown in equation 10. Equation 10. Combined fatal/Injury model.
Equation 11. Definition of dispersion parameter-based R2a.
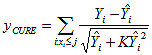
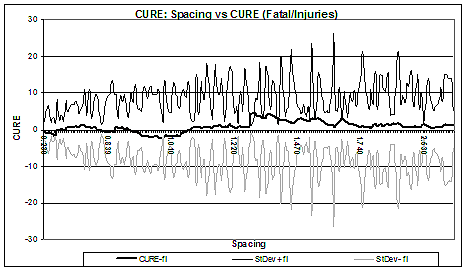
The regression relationship between fatal/injury crashes and explanatory variables predicts crashes based on extended sample and is therefore more evidence-based than the California-only model. CURE PlotsIn a random walk originating at the first observation's scaled residual and ending at the final sum of the scaled residuals for the complete dataset, the cumulative scaled residuals indicate the distance traveled at the end of each step of the walk. These plots indicate that the models are satisfactory; the cumulative residuals are within one standard deviation for most of the observations (see figure 2). Cumulative residual plots (CURE plots) show a cumulative deviation of dependent variable (crashes) versus an independent variable (spacing, freeway AADT per lane, and ramp AADT). CURE and standard deviation values are computed as shown in equations 12 and 13. Equation 12. Definition of cumulative residual.
Equation 13. Definition of standard deviation.
Figure 2. Cumulative scaled residuals versus spacing (CURE plot).
SensitivityTo assess the effects of inserting a new interchange between two existing ones, a comparison among several hypothetical scenarios of interchange spacings and three traffic flow cases is shown in table 6. Four segment lengths are considered, starting from 2.6 km (1.6 mi) and going up to 4.8 km (3 mi), where a new interchange is inserted in the middle for each of the four scenarios. Half of the total ramp AADTs are assumed to be redistributed from existing interchanges to the newly inserted one. Mainline AADTs are assumed unchanged for the existing and split spacings. Assuming all other factors are equal, inserting a new interchange will increase expected fatal/injury crash frequencies from 1.7 to 3.2 for longer spacings. For shorter spacings, the expected increase is from 1.2 to 2.2 fatal/injury crashes per year. Higher crash frequency increases are due to higher freeway AADT per lane and higher total ramp AADT. The sensitivity analysis in table 5 applies only to the freeway expected changes in crashes (when a new interchange is considered in the middle of an existing spacing). It does not account for safety changes on the surface street network affected by the addition of a new interchange access. If travel on the surface street network is reduced and, given that freeway crash rates are noticeably lower than rates for surface streets, the net crash frequencies may break even. It also may be that the addition of a new interchange will have a net overall reduction in crashes. This study does not address surface-street travel demand alterations.
ConclusionsAlthough there are ways to evaluate quantitatively the operational benefits of increasing interchange frequency, a methodology for estimating the safety impacts has not been established. In this research, we have studied the urban freeway interchange spacing problem from a safety perspective, and we have developed a valid fatal/injury crash prediction model using combined data from California and Washington State for urban freeways. These models quantify the sensitivity of crash rates to interchange spacing for fatal and injury crashes. A major value of the model is the ability to evaluate the impact of inserting new interchanges in existing urban freeway interchange spacings. The developed models should help decisionmakers quantify the safety impacts while conducting the cost-benefit analysis for projects involving construction of new interchanges or changes to existing interchanges, such as the closing of an existing interchange. This evaluation is limited to freeway safety, and it excludes consideration of impact on surface streets and their intersections with new ramps. Finally, the sensitivity analysis example provides insights into improving current guidelines for interchange spacing in publications such as the AASHTO Green Book and the Access Management Manual. The models presented in this research should be used with caution, because the data were not sufficient to try several other possible explanatory factors. Omitted variables may cause a bias in the estimates if any of the variables are correlated with those used in the models. This initial research leads us toward the following recommendations for future research:
A multiobjective analysis of optional interchange placement is necessary. This problem involves a thorough analysis of costs and benefits (disutility and utility) in operations and access perspectives, such as where provision of access could lead to less travel time spent on the surface streets, as well as safety impacts using crash prediction models. These costs and benefits could vary with the placement of this new interchange within the existing spacing. Additional InformationFor additional information, contact Joe Bared or Wei Zhang, Office of Safety R&D, 6300 Georgetown Pike, McLean, VA 22101-2296; tel. nos. 202–493–3314, 202–493–3317. References:
|
|||||||||||||||||||||||||||||||||||||||||||||||||||||||||||||||||||||||||||||||||||||||||||||||||||||||||||||||||||||||||||||||||||||||||||||||||||||||||||||||||||||||||||||||||||||||||||||||||||||||||||||||||||||||||||||||||||||||||||||||||||||||||||||||||||||||||||||||||||||||||||||||||||||||||||||||||||||||||||||||||||||||||||||||||||||||||||||||||||||||||||||||||||||||||||||||||||||||||||||||||||||||||||||||||||||||||||||||||||||||||||||||||||||||||||||||||||||||||||||||||||