U.S. Department of Transportation
Federal Highway Administration
1200 New Jersey Avenue, SE
Washington, DC 20590
202-366-4000
Federal Highway Administration Research and Technology
Coordinating, Developing, and Delivering Highway Transportation Innovations
| SUMMARY REPORT |
| This summary report is an archived publication and may contain dated technical, contact, and link information |
|
Publication Number: FHWA-HRT-08-063
Date: September 2008 |
|||||||||||||||||||||||||||||||||||||||||||||||||||||||||||||||||||||||||||||||||||||||||||||||||||||||||||||||||||||||||||||||||||||||||||||||||||||||||||||||||||||||||||||||||||||||||||||||||||||||||||||||||||||||||||||||||||||||||||||||||||||||||||||||||||||||||||||||||||||||||||||||||||||||||||||||||||||||||||||||||||||||||||||||||||||||||||||||||||||||||||||||||||||||||||||||||||||||||||||||||||||||||||||||||||||||||||||||||||||||||||||||||||||||||
Two Low-Cost Safety Concepts for Two-Way Stop-Controlled, Rural Intersections on High-Speed Two-Lane, Two-Way RoadwaysFHWA Contact: Joe Bared, PDF Version (1.75 MB)
PDF files can be viewed with the Acrobat® Reader®
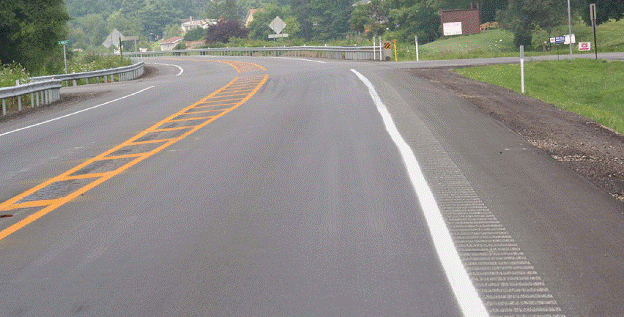
Figure 1. Concept 1.
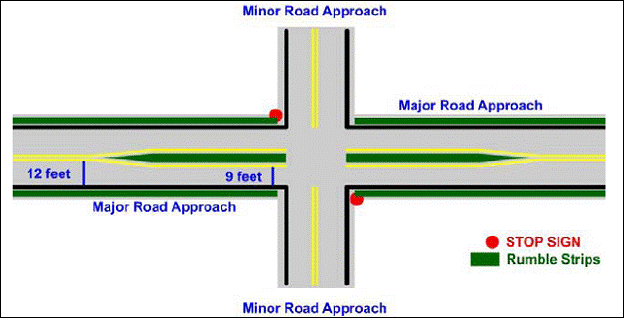
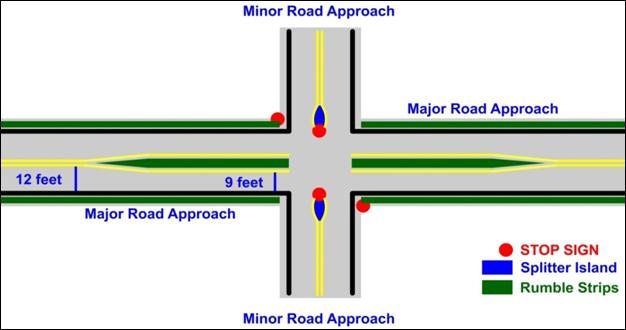
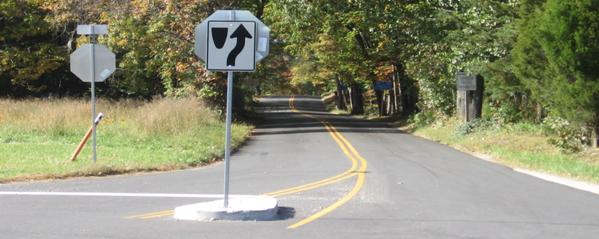
Figure 2. Illustration of concept 1. OVERVIEWThe Federal Highway Administration (FHWA) Office of Safety has identified intersections as one of its safety focus areas. As part of the FHWA efforts to reduce intersection crashes and the related injuries and fatalities, two concepts have been identified: (1) rumble strips on outside shoulders and in a painted yellow median island on major road approaches and (2) channelizing separator islands on side road approaches with supplemental STOP signs. Specifically, the strategies are low-cost countermeasures for intersections at two-lane, twoway roadways with two-way STOP-control (TWSC). The lane narrowing concept (concept 1) features the introduction of rumble strips on the outside shoulders and in a painted yellow median island on the major road approaches (figures 1 and 2).The objective of this first concept is to induce drivers on major roads to reduce approach speeds at intersections by effectively reducing the lane width. The minor road splitter island concept (concept 2) features channelizing separator islands on the side road approaches on which supplemental STOP signs are installed (figures 3 and 4). The objective of the second concept is to provide redundancy of the STOP sign and increase driver-compliance with the STOP sign. A third concept includes the combination of concepts 1 and 2 (figure 5). The concepts have greater potential for effectiveness on intersections of high-speed roadways. However, they can also be applied to intersections with lower posted speed limits. With the cooperation of several transportation agencies, these two strategies were deployed at a limited number of sites in the United States. This paper documents an evaluation of the operational and safety effectiveness of these strategies. INTRODUCTIONIntersections represent a significant safety issue from several perspectives. In 2005, more than 50 percent of all crashes in urban areas and over 30 percent in rural areas were intersectionrelated.(1) Crash severity at intersections is also a concern for certain States; over 60 percent of fatal intersection crashes in Minnesota occur at rural intersections.(2) In addition, specific driver populations, including older and younger drivers, are over-represented in these fatalities.
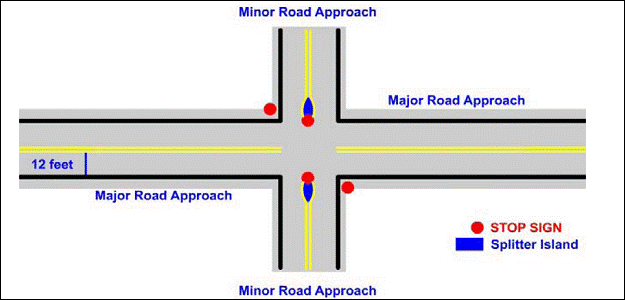
Figure 3. Concept 2.
1 ft = 0.305 m Figure 4. Illustration of concept 2.
1 ft = 0.305 m Figure 5. Illustration of concept 3. Driver compliance with the STOP sign is a major contributing factor of intersection crashes. Statistics for crashes reported at STOP-controlled intersections on rural highways in Minnesota indicate that 26 percent of drivers who were involved in multivehicle crashes ran the STOP sign at the intersection.(3) A recent publication by the National Highway Traffic Safety Administration (NHTSA)(4) indicates that drivers failed to obey the STOP sign for 21 percent of fatal crashes at STOPcontrolled intersections. An additional 23 percent failed to yield to crossing main road traffic. Intersections present several hazards that are different from road segments. First, drivers on the minor road must identify the STOP sign and bring their vehicle to a complete stop at the appropriate location. Each driver's ability to identify the STOP sign can be affected by a number of factors, including the placement, size, and retroreflectivity of the sign. At TWSC intersections, drivers on the minor approach must also identify and select a safe gap for entering the traffic stream on the major road. A driver's ability to judge gaps may be influenced by speeds on the major road (i.e., if speeds on the major road are higher than expected, gaps that appear sufficient may, in fact, be too small). Therefore, strategies for reducing speeds on the major approach and for increasing driver compliance on the minor approach have the potential to enhance safety. Concepts 1 and 2 address the issues of speed on the major road and driver compliance on the minor road, respectively. Concept 1 focuses on reducing speeds on the major approaches by narrowing the lane width and will hereafter be referred to as the lane narrowing concept. While there was no literature related to this exact concept, other studies have shown that the roadway environment can affect drivers' speed. For example, one study indicated that speed perception was greater when the roadway was lined with trees, creating a narrowing effect.(5) With respect to safety, the effects of lane-narrowing techniques have not been studied thoroughly. Regarding the use of rumble strips, shoulder and centerline rumble strips have been shown to enhance safety by reducing run-off-road and cross-over crashes. However, there is a concern that centerline rumble strips could have a negative impact on safety. The shoulder rumble strip application is more common than the centerline rumble strip, and drivers may have a general a priori expectancy to steer left when encountering rumble strips while unaware of their lane position. A recent study(6) verified this concern using a simulator experiment and concluded that some drivers (about 27 percent) initially steered left when encountering centerline rumble strips while unaware of their lane position. While this concern may hold for applications of the lane narrowing concept, the rumble strips are more of a lanenarrowing device than a warning for unaware motorists. For those drivers that are aware of their lane position, the use of rumble strips as a lane-narrowing device should not be a safety issue. It is likely that the concern would only hold for those drivers who cross the centerline while unaware of their lane position at the approach to the intersection. Concept 2 focuses on increasing intersection awareness by adding a supplemental STOP sign on the minor approaches via a separator island, hereafter referred to as the minor road splitter island concept. Similar implementations were found to produce a 30 percent reduction in total crashes in New Zealand (7) and a 30 percent reduction in angle and crossing crashes in France.(8) PARTICIPATING STATESSeveral local and State agencies were solicited for participation in the deployment of the proposed concepts. Favorable responses were received from agencies in many States including Maryland, Virginia, New Mexico, Illinois, Pennsylvania, Kentucky, Missouri, Florida, and California. For this study, the lane narrowing concept was implemented at 10 sites, and speed changes were evaluated at 9 sites, including sites in Florida, Kentucky, Missouri, and Pennsylvania. The speed change results were consistent between the first 9 sites; therefore, the tenth site was not included in the speed study. The minor road splitter island concept was implemented and evaluated at one site in Lorton, VA. Concept 3 was implemented at one site in Cumberland, MD. Participating agencies selected the sites for deployment of the proposed concepts; however, the research team worked closely with the participating agencies to provide guidance during the site selection process. Selected intersections exhibited one or more of the following characteristics:
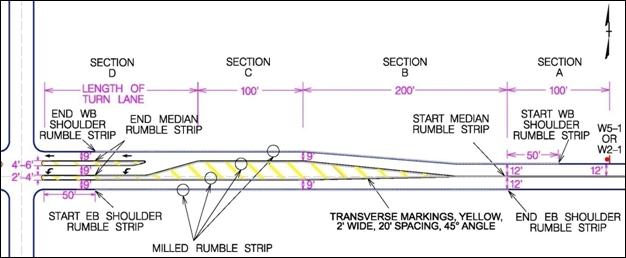
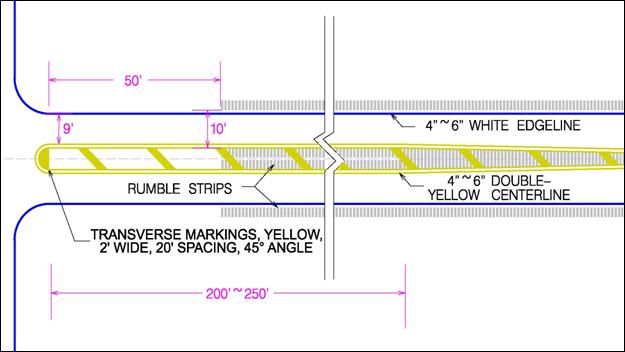
TYPICAL DESIGN OF CONCEPTSThe lane narrowing concept features the introduction of a narrow median island formed by pavement markings in conjunction with rumble strips placed between the two travel lanes of a major road. It also includes the introduction of rumble strips outside of the edgelines within the existing pavement width as shown in figure 3. The median island and rumble strips effectively reduce the travel lane width prior to an intersection. The objective of this concept is to induce drivers to slow down as they approach an intersection. The installation of this concept is relatively low cost. While Pennsylvania spent between $50,000 and $70,000, the installations in other States were much less expensive. Based on data from the remaining States, the implementation costs for the lane narrowing concept ranged from $10,000 to $30,000 per intersection, excluding construction costs unrelated to the concept implementation. A typical design template for the lane narrowing concept is shown in figure 6. For this scenario, lane widths on the major road are reduced from 3.66 m (12 ft) to 2.75 m (9 ft), as measured from the inside edges of the pavement markings. The effective lane width after implementation is 3.05 m (10 ft), as measured from the inside edges of the rumble strips. The design template shows three distinct sections (A, B, and C). Prior to the lane narrowing, appropriate signing is placed at the beginning of section A to warn motorists of the upcoming taper or intersection. The end of section A corresponds with the beginning of section B (i.e., the lane taper). Section B gradually transitions from a median width of 0 m (0 ft) to the full width of the median at the end of the section. Section C carries the full width of the median for 45.75 m (150 ft) up to the intersection, but the rumble strips end 15.25 m (50 ft) prior to the intersection. Table 1 indicates the lengths of each section based on the posted speed of the roadway. For example, if the posted speed of the major road is 88.55 km/h (55 mi/h), then the lengths of sections A, B, and C would be 30.5 m (100 ft), 61 m (200 ft), and 45.75 m (150 ft), respectively. 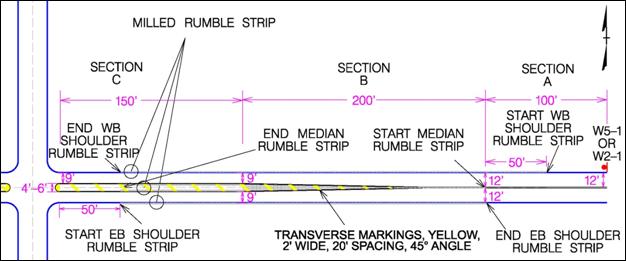 1 ft = 0.305 m Figure 6. Typical design of concept 1. Table 1. Concept 1 section lengths.
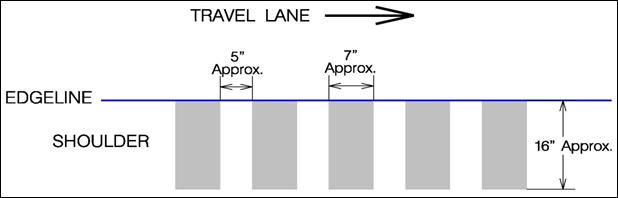
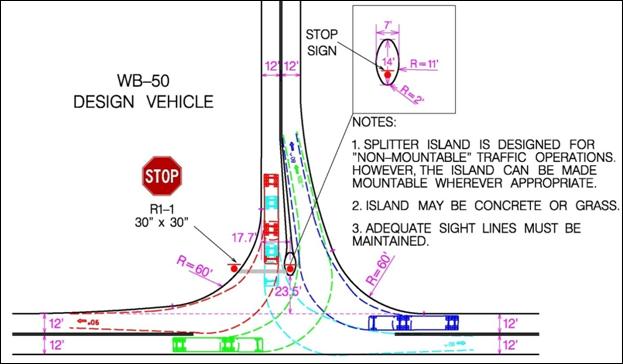
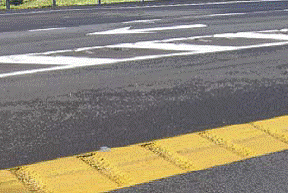
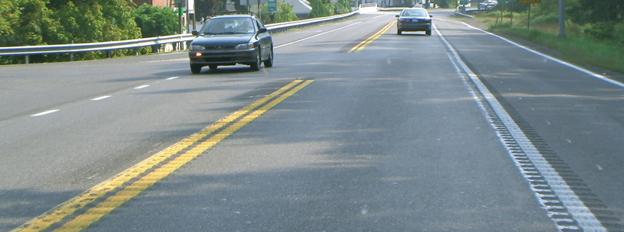
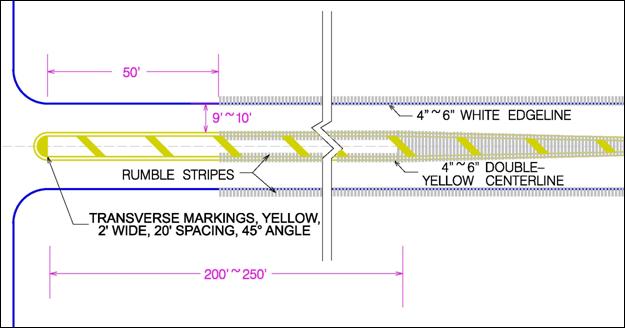
1 ft = 0.305 m Milled rumble strips are installed within the median and along the shoulders. The median rumble strips start at the beginning of section B and continue through section C, ending 15.25 m (50 ft) prior to the intersection. Traveling toward the intersection, shoulder rumble strips start 15.25 m (50 ft) prior to the beginning of section B and end 15.25 m (50 ft) prior to the intersection. Traveling away from the intersection, shoulder rumble strips start 15.25 m (50 ft) past the intersection, continuing through sections C and B, and ending at section A. A typical design for rumble strips is shown in figure 7. Transverse pavement markings are shown in the median. The yellow transverse markings are 0.61 m (2 ft) wide and placed at a 45-degree angle with a spacing of 6.1 m (20 ft). The minor road splitter island concept features channelizing islands on the minor approaches of one-way or two-way STOP-controlled intersections as shown in figures 4 and 8. The objective of this concept is to improve the conspicuity of the STOP sign and increase driver compliance. This concept primarily focuses on increasing driver awareness of the intersection by adding a supplemental STOP sign on the minor approaches via a separator island. A typical design template is shown in figure 8. For the minor road splitter island concept, the major design considerations are the type of separator island (traversable or nontraversable) and the turning radius of large vehicles. The typical design of the separator island is an oval, 4.27 m (14 ft) in length and 2.135 m (7 ft) in width, constructed of either earth material or concrete. A secondary STOP sign is placed on the separator island at the nose closest to the cross road. The double yellow pavement markings on the minor road are separated prior to the island and extended along the sides of the island to guide motorists as per the Manual on Uniform Traffic Control Devices (MUTCD).(9) Guidance for calculating the minimum taper length for the pavement markings can be found in the MUTCD, Section 3B-10.(9) To accommodate larger vehicles turning from the minor approach, the separator island is offset left of center.
1 ft = 0.305 m Figure 7. Typical rumble strip design.
1 ft = 0.305 m Figure 8. Typical design of concept 2. For the design template, the center of the island is located 5.3 m (17.5 ft) from the right edge of the traveled way on the minor approach, and the nose of the island is set back 7.2 m (23.5 ft) from the nearest edge of traveled way on the crossing roadway. These dimensions are, however, dependent on the turning radius of the design vehicle. The minor approach may also need to be flared depending on the existing turning radius to accommodate the design vehicle. IMPLEMENTATION OF CONCEPTSDesign templates, shown previously in figures 6 and 8, were provided to the States for the applicable treatment. However, the States did not always follow the template exactly (table 2). As per the design templates, lane widths on the major road were reduced from 3.66 m (12 ft) to 3.05 m (10 ft). The 3.05-m (10-ft) effective lane width is measured as the distance between the inside edges of the rumble strips. Field measurements indicated that lane widths actually varied from one point to the next because of limited accuracy in pavement marking techniques and rumble strip milling techniques. For the lane narrowing concept, typical lane widths on the major approaches ranged from 3.36 m (11 ft) to 3.66 m (12 ft) before implementation. After implementation, typical lane widths on the major approaches ranged from 2.75 m (9 ft) to 3.05 m (10 ft) within the narrowed section. Field visits also revealed different installation practices among contractors. For example, contractors measured between the inside edges of the pavement markings when calculating the effective lane widths for the intersection approaches at a few locations. Several other variations of the design were actually implemented as shown in figures 9 through 12. Table 2. Design variations among sites.
1 ft = 0.305 m
Figure 9. Concept 1 at PA 4.
Figure 10. Example 2 of concept 1 at PA 4.
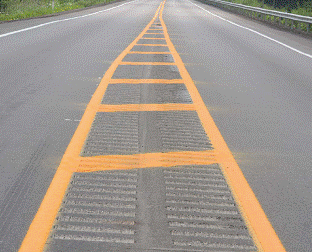
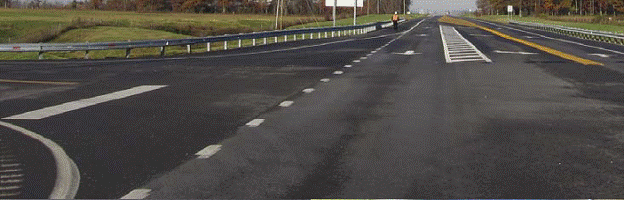
Figure 11. Concept 1 at FL 1. Figures 9 and 10 illustrate an installation of the lane narrowing concept in Pennsylvania. Prior to implementation of the concept, the major road approaches included 3.66-m (12-ft) lanes. The deployment of the lane narrowing concept effectively narrowed the major approaches to 3.05 m (10 ft). In this example, milled rumble strips were installed beginning at the outside edge of the pavement markings, similar to the design shown in figure 7. A painted median was also implemented at a width of 1.22 m (4 ft) and is clearly visible with cross-hatching. The double rumble strips in the median were each 4.06 m (16 inches) wide, which almost covers the full width of the median at the widest point. The rumble strip layout and cross-hatching within the median are desirable design characteristics. Figures 11 and 12 provide an example of the lane narrowing concept in Florida. Much of the design is similar to the installation shown in figures 9 and 10; however, the median is slightly narrower at the location in Florida. The median rumble strips fully cover the width of the median between the inside edges of the pavement markings. In addition, a double solid (as opposed to a single solid) yellow pavement marking was used along each side of the median rumble strips, and raised pavement markings were installed along the centerline. Both the shoulder and median rumble strips end 15.25 m (50 ft) prior to the intersection. The rumble strip and pavement marking layouts are desirable characteristics for the lane narrowing concept.
Figure 12. Example 2 of concept 1 at FL 1. Figures 13 through 15 show examples of the lane narrowing concept at two different sites in Kentucky. At both sites, the concept was implemented at intersections with leftturn lanes on the major approaches. This was accomplished by creating extra space between the left-turn lane and the opposing and adjacent through lanes. Rumble strips were then installed between the left-turn lanes and the opposing and adjacent through lanes as well as along the shoulders. A combination of milled and rolled rumble strips were installed. The previous examples show the median rumble strips ending prior to the intersection to accommodate turning vehicles. At both sites in Kentucky, however, the median rumble strips were installed up to the intersection. Additionally, rumble strips were installed along only the right edge of the white painted median that separates the left-turn lane from the through lane in the same direction. Beyond these similarities, there are subtle differences between the two sites. At the first site (figures 13 and 14):
Figure 13. Concept 1 at KY 1.
Figure 14. Example 2 of concept 1 at KY 1.
Figure 15. Concept 1 at KY 2. At the second site (figure 15):
A typical design of the lane narrowing concept with left-turn lanes is shown in figure 16. Due to the presence of left-turn lanes, section C from figure 6 was modified slightly to create sections C and D as shown in figure 16. In this design, sections C and D include narrowed lanes with a painted median that extends to the intersection. Rumble strips are installed along both inside edges of all painted median islands and end 15.25 m (50 ft) prior to the intersection. Section C is now 30.5 m (100 ft) rather than 45.75 m (150 ft), but there is the added length of the turn lane (section D) to increase the length of the lane narrowing. Again, the lane width between pavement markings is 2.75 m (9 ft), but the effective lane width (i.e., distance between rumble strips) is 3.05 m (10 ft).
1 ft = 0.305 m Figure 16. Typical design of concept 1 with left-turn lanes.
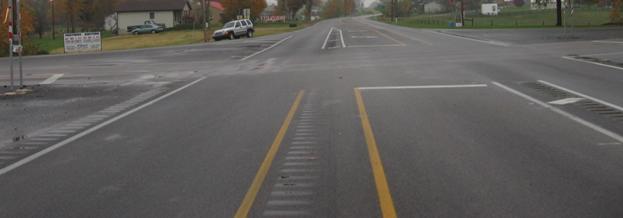
Figure 17. Concept 1 at MO 1. Figures 17 and 18 illustrate installations of the lane narrowing concept in Missouri. At both sites, a painted median as well as milled shoulder and median rumble stripes were installed. Prior to the installation, lane widths ranged from 3.36 to 3.66 m (11 to 12 ft). The deployment of the lane narrowing concept effectively narrowed the major approaches to 2.75 to 3.05 m (9 to 10 ft). There were a few noteworthy differences between the two sites. At the first site (figure 17):
Figure 18. Concept 1 at MO 2.
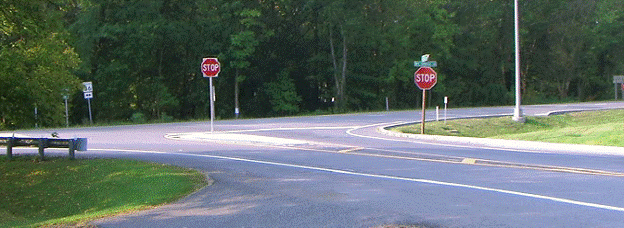
Figure 19. Concept 2 at VA 1. Figure 19 shows an example of the only deployment of the minor road splitter island concept included in this study. The minor road splitter island concept was deployed in Lorton, VA, at a four-legged intersection with STOP-control on the minor approaches. Prior to the installation of the minor road splitter island concept, the intersection was STOP-controlled on the minor approaches with a single STOP sign per approach located to the right of the traveled way. The deployment of the minor road splitter island concept included the installation of a separator island on the minor approaches near the intersection and the placement of a second STOP sign on the separator islands. The separator islands are nontraversable with vertical edges. Since the separator islands are nontraversable, the turning radius of the design vehicle must be accommodated. The lane markings are also separated on the minor approaches prior to the intersection and painted along both sides of the separator islands. Providing cross-hatching between the pavement markings or painting the separator islands would improve the conspicuity of the treatment. Figures 20 and 21 show an example of concept 3 in Cumberland, MD. This was the only deployment of concept 3 included in this study. The combined concept was implemented at a three-legged intersection with STOPcontrol on the minor approach. Prior to the installation of concept 3, the intersection was STOP-controlled on the minor approach with a single STOP sign to the right of the traveled way. The deployment of concept 3 included the installation of a traversable separator island on the minor approach. Also, a secondary STOP sign was installed on the separator island. The lane markings are separated on the minor approach prior to the intersection and painted along both sides of the separator island. However, in this case, cross-hatching is included between the pavement markings to improve the conspicuity of the concept. The major road approaches were effectively narrowed by installing shoulder and centerline rumble stripes. Unlike the typical implementation of the lane narrowing concept, this deployment did not include a painted median and the rumble stripes continue to the intersection, which is not desirable.
Figure 20. Concept 3 at MD 1 (minor approach).
Figure 21. Concept 3 at MD 1 (major approach). DATA COLLECTIONSpeed and driver behavior data were collected before implementation at 9 sites for the lane narrowing concept and one site for the minor road splitter island concept. Similar data were collected at all 10 sites in the after period. The lane narrowing concept was deployed at a tenth site in Florida; however, speed data were not available in the before period. Data indicated that results were consistent at the other 9 sites where the lane narrowing concept was deployed; therefore, speed data were not collected at the tenth site. Hi-Star traffic sensors with sequential speed profile measuring capabilities were temporarily placed on the road to collect individual driver speeds, vehicle counts, headways, and traffic composition for a 24-hr period both before and after implementation. These automated devices continuously recorded speed data for each individual vehicle that passed through the site on the approaches of interest. Additionally, speeds were captured by radar and used to validate the speed data recorded by the temporary sensors. Post-implementation data collection occurred at least 3 months after implementation to allow sufficient time for possible short-term "novelty effects" of the concepts to fade. All data were collected on weekdays.
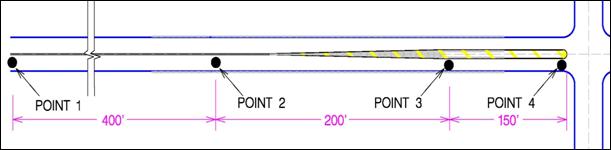
1 ft = 0.305 m Figure 22. Illustration of concept 1 speed data collection points. The data collection points were different for the two strategies. For the lane narrowing concept, speed data were collected at four different locations (figure 22) along each of the major approaches to determine whether or not speed reductions were occurring as desired. The locations of the data collection points were as follows:
For the lane narrowing concept, speed observations were screened to eliminate vehicles that had been affected by any other factors such as turning maneuvers or vehicle platoons. To obtain the desired dataset, it was necessary to eliminate vehicles with relatively small headways and vehicles traveling below a certain speed. The cut-off speed for the lane narrowing concept dataset was 64.4 km/h (40 mi/h). The speed cut-off for the lane narrowing concept was based on speed observations in North Carolina. Speed data were collected on road segments with 2.75-m (9-ft) lanes in North Carolina to determine the relationship among speed, lane width, and driver behavior. The road segments selected in North Carolina were two-lane, rural roadway segments with minimal horizontal and vertical curvature. It was observed that drivers could travel at speeds up to 72.45 km/h (45 mi/h) on 2.75 m (9 ft) wide lanes without crossing into the opposing lane. Therefore, the application of the lane narrowing concept is expected to affect vehicles with speeds greater than or equal to 64.4 km/h (40 mi/h). The final dataset for the lane narrowing concept included vehicles with headways greater than 20 seconds and approach speeds of 64.4 km/h (40 mi/h) or greater. For the minor road splitter island concept, speed data were collected on the minor approaches. There was only one speed data collection point per approach located 45.75 m (150 ft) upstream from the STOP line or pavement marking on each minor approach. The dataset for the minor road splitter island concept included all vehicles on the minor road approach. Driver behavior data were collected at the intersection for both strategies. A polemounted camera located at the intersection recorded driver behavior during the same periods as the speed data were collected. The videos were then analyzed and driver behaviors were recorded as follows:
Crash and traffic volume data were collected for each site in the before and after periods. If data were available, at least 5 years of crash data were obtained for the before period, and 2 years of data were obtained for the after period. Crash data included the total number of crashes occurring at the intersection as well as crash severity (i.e., fatal, injury, or property damage) and crash type (i.e., angle, rear end, or other). OPERATIONAL PERFORMANCEThe operational effectiveness of each concept is based on the selected measure of effectiveness (MOE). For the lane narrowing concept, the primary MOE is the reduction of speed on the major approaches. For the minor road splitter island concept, there are two MOEs: (1) the reduction of speed on the minor approach (i.e., at the upstream data collection point), and (2) increased driver compliance with the STOP sign on the minor approach. For the lane narrowing concept, the analysis was conducted for two subsets of vehicles: all vehicles and trucks only. This was done to identify differential vehicle effects of the concept. The lane narrowing concept For each site, the mean and 85th-percentile speeds were calculated for each approach at each of the four data collection points for both the before and after periods. Again, point 4 is closest to the intersection and point 1 is farthest from the intersection. An unpaired T-test was used to determine if the speed reduction from point 1 to point 4 (1 to 4) was statistically different from the reduction from point 2 to point 4 (2 to 4) in the before period. The test indicated that there was no significant difference between 2-4 and 1-4 at a 95-percent confidence level (p = 0.45, where p is the probability of error) Since there was no difference between the 2-4 and 1-4 points, it was decided that the remaining analysis would focus on speed reductions from point 2 to point 4. Speed reduction from the before data showed no statistical difference of speeds between points 2 and 4. Table 3. Speed reductions for all vehicles.
1 mi = 1.61 km 1 ft = 0.305 m Table 4. Speed reductions for trucks only.
1 mi = 1.61 km 1 ft = 0.305 m Table 3 shows the speed reduction from point 2 to point 4 for all vehicles after the deployment of the lane narrowing concept. The mean and standard deviation were calculated for the reduction in all speeds and the reduction in 85thpercentile speeds. For all vehicles, the mean speed was reduced by 5.64 km/h (3.5 mi/h) with a standard deviation of 0.36. The confidence interval does not include zero; therefore, the reduction is statistically significant at the 95-percent confidence level. The mean reduction in the 85th-percentile speed was even greater (7.25 km/h (4.5 mi/h)) with a standard deviation of 0.25. Again, this reduction is statistically significant at the 95-percent confidence level. Table 4 shows the speed reduction from point 2 to point 4 for trucks only after the deployment of the lane narrowing concept. For trucks, the mean speed was reduced by 7.1 km/h (4.4 mi/h) with a standard deviation of 0.36, and the reduction is statistically significant at the 95-percent confidence level. The mean reduction in the 85th-percentile speed was slightly greater (7.73 km/h (4.8 mi/h) with a standard deviation of 0.27. Again, this reduction is statistically significant at the 95-percent confidence level. Speed reductions were also disaggregated by time of day and lane width. The speed reductions were not significantly different by time of day. Based on the limited sample size, the degree of speed reduction was not linearly proportional to lane width (i.e., narrower lanes were not always associated with greater speed reductions). Table 5 shows the maximum speed reduction after implementation from point 2 to point 4. For all vehicles combined, a maximum speed reduction of 19.32 km/h (12.1 mi/h) was observed. For trucks, a maximum speed reduction of 16.26 km/h (10.1 mi/h) was observed. The results indicate that the observed speed reduction is attributable to the lane narrowing concept. All reductions are statistically significant at a 95-percent confidence level and the reductions in the 85th-percentile speed appear to be greater than the reductions in the average speed. Furthermore, the speed reduction from point 2 to point 4 is greater for trucks than for all vehicles combined. Table 5. Maximum speed reductions.
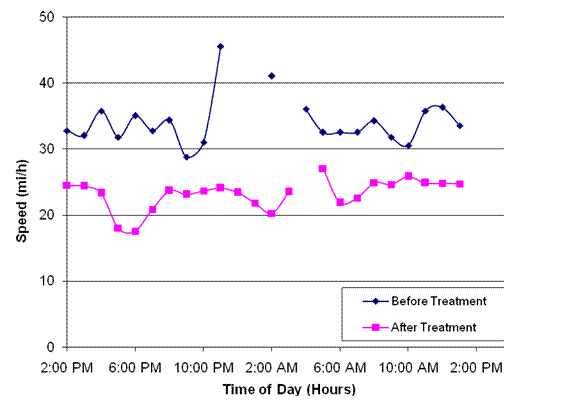
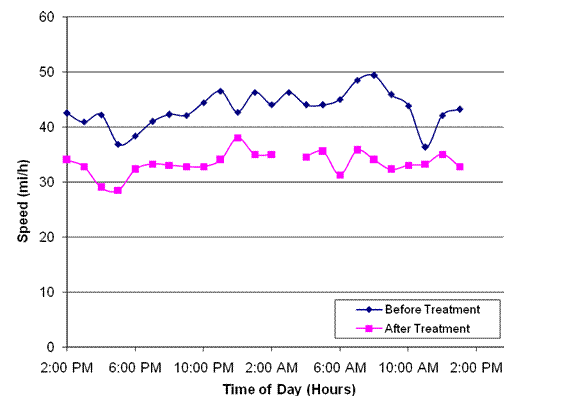
1 mi = 1.61 km Speed reductions were also disaggregated by time of day and lane width. The speed reductions were not significantly different by time of day. Based on the limited sample size, the degree of speed reduction was not linearly proportional to lane width (i.e., narrower lanes were not always associated with greater speed reductions). This may be counterintuitive but may be explained to some extent by the variation in lane widths for the same lane at a given intersection. It is hypothesized that narrower lane widths will produce greater speed reductions; however, a larger sample size and better field implementation of the concept is needed to support or refute the hypothesis. Based on driver behavior data from the cameras, a large number of vehicles routinely contacted the rumble strips after implementation. This is likely due to the narrower lane widths and relative proximity of the rumble strips to the lane. While rumble strip contact helps to alert the driver of the edge of the travel way, it may have secondary benefits as well. The contact creates a significant noise outside the vehicle, which may help increase awareness for other motorists near the intersection. Minor Road Splitter Island Concept Descriptive statistics were calculated for both approaches on the minor road for the before and after periods. Again, these results are based on just one implementation of the minor road splitter island concept. Figures 23 and 24 show the average speed comparisons by time of day before and after deployment for the northbound and southbound minor road approaches, respectively, 45.75 m (150 ft) from the STOP sign. For the northbound (minor) approach, speed reductions ranged from 8.05 to 33.81 km/h (5 to 21 mi/h) after deployment, averaging 17.39 km/h (10.8 mi/h) with a standard deviation of 4.7. For the southbound (minor) approach, speed reductions ranged from 4.83 to 24.15 km/h (3 to 15 mi/h) after deployment, averaging 15.78 km/h (9.8 mi/h) with a standard deviation of 3.0. The speed reductions on both approaches are significant at the 95-percent confidence limit. Based on driver behavior data from the camera, there were other benefits associated with the minor road splitter island concept. After implementation, there were minor improvements in STOP sign compliance as well as driver behavior. These results are, however, based on a limited sample at a single site. Further analysis is necessary to verify the operational effectiveness of the minor road splitter island concept.
1 mi/h = 1.61 km/h Figure 23. "Before-After" average speeds for northbound approach on minor road.
1 mi/h = 1.61 km/h Figure 24. "Before-After" average speeds for southbound approach on minor road. TRAFFIC SAFETY PERFORMANCE Crash data were analyzed using a simple beforeafter comparison method. Crash rates were calculated for each year as the total number of crashes divided by the total number of vehicles entering the intersection per year. Crash rates were also computed for each level of crash severity and crash type. All crash rates are expressed as the crashes per million entering vehicles (MEV). Due to limited sample size and length of the after period, it was not possible to conduct an Empirical Bayes before-after evaluation—a more statistically robust method for isolating the effects of a treatment. While the sample size and duration of crash data are relatively limited, the simple before-after crash evaluation provides initial insights on the safety effectiveness of these strategies. An Empirical Bayes evaluation is planned in the near future using a longer period of crash data. Lane Narrowing Concept Crash data for the lane narrowing concept are shown in table 6 for Pennsylvania, Kentucky, Missouri, and Florida. For one site in Pennsylvania (PA 3), the lane narrowing concept was only implemented for a short period of time (less than 6 months). Due to the relatively short duration of implementation, the site was excluded from the crash analysis. The following summarizes the crash findings for the remaining implementations of the lane narrowing concept:
Table 6. Crash data summary for concept 1 implementations.
Note: MEV = million entering vehicles and NA indicates that no crashes were observed in the before period.
Minor Road Splitter Island Concept Crash data are shown in table 7 for the one implementation of the minor road splitter island concept in Virginia. For this site, there were 4 years of data in the before period and nearly 2 years after implementation. The following points summarize the crash findings for the one implementation of the minor road splitter island concept. Table 7. Crash data summary for concept 2 implementation.
Note: MEV = million entering vehicles.
IDEAS FOR FUTURE DEPLOYMENTSThe typical design and actual implementation of concepts 1 and 2 have been discussed in detail in the preceding sections. Based on the operational and safety analysis, as well as lessons learned from current deployments and observations in the field, the following points are presented as ideas to enhance future deployments of the treatments. Figures 25 and 26 illustrate the potential enhancements to the lane narrowing concept for both rumble strip and rumble stripe designs, respectively.
1 ft = 0.305 m Figure 25. Illustration of enhancements to section C of concept 1 with rumble strips.
1 ft = 0.305 m Figure 26. Illustration of enhancements to section C of concept 1 with rumble stripes. Lane Narrowing Concept
Minor Road Splitter Island Concept
SummaryLane Narrowing Concept For the lane narrowing concept, the major points of this study can be summarized as follows: Speed
Driver Behavior
Safety
Minor Road Splitter Island Concept For the minor road splitter island concept, the major points of this study can be summarized as follows: Speed
Driver Behavior
Safety
ConclusionsThe general conclusion from this research is that positive operational and safety effects can be expected with the installation of concepts 1 and 2. The lane narrowing concept is shown to significantly reduce speeds on the major road approaches at rural, two-lane, TWSC intersections. The results are consistent across sites, which are combined in the main analysis. The minor road splitter island concept is shown to improve driver compliance as well as reduce speeds on the minor approaches at rural, two-lane, TWSC intersections. While the results for the minor road splitter island concept are based on just one site, the initial indications are promising. Based on the limited after period, there appears to be a general reduction in crashes associated with the implementation of concepts 1 and 2. For the lane narrowing concept, total, fatal/injury, and angle crashes were reduced in the after period, but rear-end crashes increased at some sites. The apparent increase in rear-end crashes should be monitored as additional after data become available. For the minor road splitter island concept, the crash rate decreased for all categories in the after period. While the simple before-after method used in this study does not account for some issues related to safety analysis (e.g., regression-to-the-mean, temporal effects, and other changes that may occur other than the safety improvements themselves), it does provide a preliminary understanding of the safety effectiveness of concepts 1 and 2. Also, it may not be worth conducting a more rigorous evaluation until sufficient data are available for the after period. It is likely that the lane narrowing concept will be most effective at rural, TWSC intersections with a relatively high posted speed (64.4 km/h (40 mi/h) or greater) on the major road. However, this concept may be applicable at urban and low-speed intersections. While the limited sample did not indicate a linear relationship between speed reduction and lane width, other research has shown a positive association between the two variables (i.e., speed decreases as lane width decreases). Positive features of the lane narrowing concept include highly visible pavement markings with cross-hatching in the median and rumble strips that cover the entire width of the median. For the minor road splitter island concept, it is likely that the implementation will be most effective at rural, TWSC intersections with STOP sign compliance or conspicuity issues on the minor approach. However, this concept may be applicable at other TWSC intersections as well. Based on the relative low cost and initial effectiveness of concepts 1 and 2 with respect to operational and safety measures, it is expected that these strategies will prove to be cost-effective methods for improving intersection safety. However, more comprehensive analysis is needed before wide-scale implementation can be recommended. There is also a need to develop guidelines for where these strategies should be implemented. References
Researchers — This study was performed by Vanasse Hangen Brustlin, Inc. (VHB); Principal Investigators Warren Hughes, Ram Jagannathan, and Frank Gross. For more information about this research, contact Joe Bared, FHWA Project Manager, HRDS-05 at (202) 493-3314, joe.bared@fhwa.dot.gov. Distribution — This Summary Report is being distributed according to a standard distribution. Availability — This Summary Report may be obtained from the FHWA Product Distribution Center by e-mail to report.center@fhwa.dot.gov, fax to (301) 577-1421, phone to (301) 577-0818, or online at https://www.fhwa.dot.gov/research/topics/safety/intersections/. Key Words — Safety, low-cost, intersection, STOP-control, lane-narrowing, splitter island. Notice — This document is disseminated under the sponsorship of the U.S. Department of Transportation in the interest of information exchange. The U.S. Government assumes no liability for the use of the information contained in this document. The U.S. Government does not endorse products or manufacturers. Trademarks or manufacturers' names appear in this report only because they are considered essential to the objective of the document. Quality Assurance Statement — The Federal Highway Administration (FHWA) provides high-quality information to serve the Government, industry, and public in a manner that promotes public understanding. Standards and policies are used to ensure and maximize the quality, objectivity, utility, and integrity of its information. FHWA periodically reviews quality issues and adjusts its programs and processes to ensure continuous quality improvement. |
|||||||||||||||||||||||||||||||||||||||||||||||||||||||||||||||||||||||||||||||||||||||||||||||||||||||||||||||||||||||||||||||||||||||||||||||||||||||||||||||||||||||||||||||||||||||||||||||||||||||||||||||||||||||||||||||||||||||||||||||||||||||||||||||||||||||||||||||||||||||||||||||||||||||||||||||||||||||||||||||||||||||||||||||||||||||||||||||||||||||||||||||||||||||||||||||||||||||||||||||||||||||||||||||||||||||||||||||||||||||||||||||||||||||||