U.S. Department of Transportation
Federal Highway Administration
1200 New Jersey Avenue, SE
Washington, DC 20590
202-366-4000
Federal Highway Administration Research and Technology
Coordinating, Developing, and Delivering Highway Transportation Innovations
 |
| This report is an archived publication and may contain dated technical, contact, and link information |
|
Publication Number: FHWA-HRT-10-024
Date:April 2010 |
Development of a Speeding-Related Crash TypologyPDF Version (1.53 MB)
PDF files can be viewed with the Acrobat® Reader®
RESULTS OF CART ANALYSES
NORTH CAROLINA AND OHIO SR VEHICLES/DRIVERSNorth Carolina Vehicle-Based CART Results Ohio Vehicle-Based CART Results SUMMARY CONCLUSIONS ON VEHICLE/DRIVER-RELATED CART ANALYSESCART Results for Data Subset Analyses
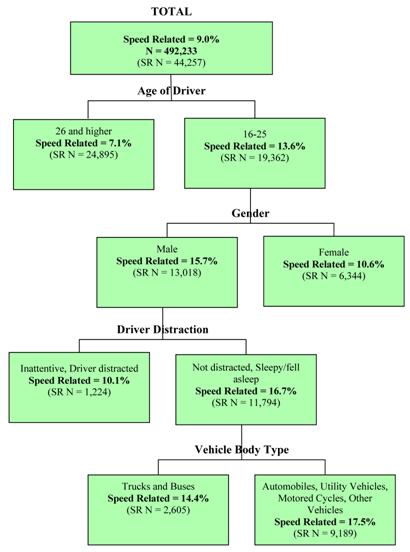
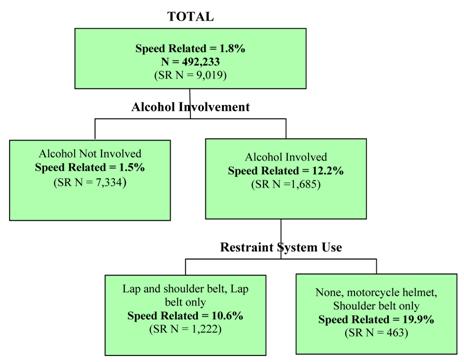
NORTH CAROLINA AND OHIO SR VEHICLES/DRIVERSNorth Carolina Vehicle-Based CART Results The initial analysis with the North Carolina vehicle file using the combined SR definition includes airbag availability/deployment as the second–level branch variable. Because this variable is difficult to interpret (i.e., it is both an indication of car age and of the severity of the crash), it was removed, and a second CART analysis was conducted. As shown in figure 10, the revised analysis shows that the most important SR predictive variable is driver age. The categories with the highest SR percentage are 16–25–year–old drivers (14 percent). The next most important variable is gender, and the category with the highest SR percentage is male. Within that branch, the most important variable is driver distraction, and the categories with the highest SR percentage include not distracted and sleepy/fell asleep. Finally, the most important fourth–level branch variable is vehicle body type, and the categories with the highest SR percentage are automobiles, utility vehicles, motorcycles, and other vehicles except trucks and buses. This final level provides little additional information. Thus, in general, this analysis using the liberal combined SR definition indicates that the driver/vehicle subset most likely to be involved in SR crashes are young drivers who are males and who are not distracted by anything other than being fatigued/sleepy. Approximately 18 percent of the vehicles in this final subset are SR, and the subset includes approximately 9,200 of the 492,000 vehicles in the North Carolina training set–approximately 2 percent of the total North Carolina vehicle sample and 21 percent of the SR sample. As shown in figure 11, when the North Carolina vehicle sample is analyzed using the conservative over speed limit definition, the most important SR predictive variable is alcohol involvement, with the highest SR category being yes (12 percent SR). The next variable is restraint system used, with the highest SR categories including none, motorcycle helmet, and shoulder belt only. The motorcycle helmet indication is a vehicle–type indicator. Thus, in general, this analysis using the over speed limit SR definition indicates that the driver/vehicle subset most likely to be involved in SR crashes are drivers who are drinking and who do not use restraints. Approximately 20 percent of the vehicles in this final subset are SR, and the subset includes approximately 500 of the 492,000 vehicles in the North Carolina training set–less than 0.1 percent of the total vehicle sample and approximately 5 percent of the SR sample, which are both small percentages.
Figure 10. Chart. CART results for North Carolina vehicle–based variables using the combined SR definition (2002–2004).
Figure 11. Chart. CART results for North Carolina vehicle–based variables using the over speed limit SR definition (2002–2004).
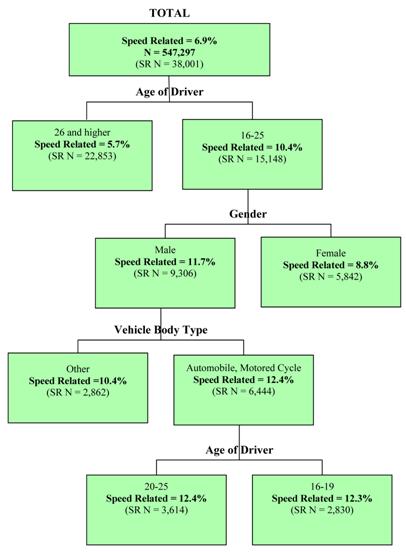
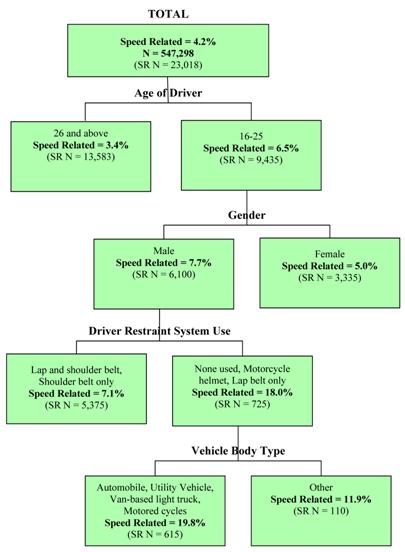
Ohio Vehicle–Based CART Results The initial output from the Ohio vehicle file using the combined SR definition includes airbag availability/deployment as the second–level branch variable. Because this variable was difficult to interpret (i.e., it was both an indication of car age and of the severity of the crash) it was removed, and a second CART analysis was conducted. In this analysis reviewing airbag removal in figure 12, the most important SR predictive variable is driver age. The category with the highest SR percentage is 16–25–year–old drivers (10 percent SR). Within that branch, the most important variable is gender, and the category with the highest SR percentage is male. Within that branch, the most important branch variable is vehicle body type, and the categories with the highest SR percentage include automobiles and motorcycles (i.e., no utility vehicles, trucks, etc.). Finally, within this branch, the fourth–level variable is again driver age, but the difference in SR percentage between the 16–19–year–old drivers and the 20–25–year–old drivers is small. Thus, in general, this analysis using the liberal SR definition indicates that the driver/vehicle subset most likely to be involved in SR crashes is younger drivers (up to age 25) who are male and who are driving either automobiles or motorcycles. Approximately 12 percent of the vehicles in this final subset are SR, and the subset includes approximately 6,400 of the 547,000 vehicles in the Ohio training set–approximately 1 percent of the total vehicle sample and 17 percent of the SR sample. When the Ohio vehicle file was analyzed using the over speed limit definition, the initial run also included the difficult–to–interpret airbag availability/deployment variable. This variable was then removed, and a second CART analysis was conducted. In figure 13, the most important SR predictive variable is driver age. The category with the highest SR percentage is 16–25–year–old drivers (7 percent). The most important variable is gender, and the category with the highest SR percentage is male. Within that branch, the most important branch variable is driver restraint system use, and the categories with the highest SR percentage include none, motorcycle helmet, and lap belt only. The none category dominates this grouping. Finally, within this branch, the fourth–level variable is vehicle body type, and the categories with the highest SR percentage include automobiles, utility vehicles, van–based light trucks, and motorcycles, which is a mix of types that does not provide much useful information. Thus, in general, this analysis using the conservative over speed limit SR definition indicates that the driver/vehicle subset most likely to be involved in SR crashes is younger drivers (up to age 25) who are male, who do not use restraints, and who drive a variety of vehicle types. Approximately 20 percent of the vehicles in this final subset are SR, and the subset includes approximately 615 of the 547,000 vehicles in the Ohio training set–approximately 0.1 percent of the full sample and 3 percent of the SR sample, which are small percentages.
Figure 12. Chart. CART results for Ohio vehicle–based variables using the combined SR definition (2003–2005).
Figure 13. Chart. CART results for Ohio vehicle–based variables using the over speed limit SR definition (2003–2005).
SUMMARY CONCLUSIONS ON VEHICLE/DRIVER–RELATED CART ANALYSESThe findings from the vehicle–based analyses differed across databases and definitions. Using the liberal combined SR definition, FARS noted driver alcohol use as the most important descriptor, GES indicated distracted drivers as the most important descriptor, and North Carolina and Ohio data indicated young drivers as the most important descriptors. The over speed limit analysis in North Carolina indicated young drivers up to age 35 who are drinking while not using restraint systems as the most important descriptors, while the Ohio data indicated young males not using restraints as the most important descriptors. The one theme in most (but not all) of the results is that they all include young males.
CART Results for Data Subset Analyses As described in the single–variable results, additional analyses were conducted for SR crashes in five subsets of the FARS and GES data: (1) pedestrian SR crashes, (2) intersection–related SR crashes, (3) lane departure SR crashes, (4) rural SR crashes, and (5) urban SR crashes. In additional to the previously described single–variable analyses, CART analyses were conducted for the FARS and GES crash–related variables in the first three of these subsets. Unlike the previous CART analyses in which all crash–related variables were examined by the CART software, only the selected group of variables were examined. These included the following:
Note that the actual subset that CART uses was all pedestrian, intersection, and lane departure crashes. It then examined each of the variables and determined which was the best SR predictor in the initial step. The results of these limited CART analyses are described below. By definition, these are analyses of a restricted set of variables and that CART results for the full set of crash–related variables within each subset can produce different findings.
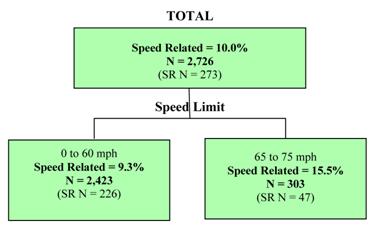
Pedestrian Crashes The CART results for the fatal FARS SR crashes using the limited set of crash–related variables only produced one branch/level (see figure 14). The most important SR predictive variable is speed limit, and the categories with the highest SR percentage are speed limits of 65–75 mi/h. Approximately 16 percent of these pedestrian crashes are SR, and this subset accounts for approximately 2 percent of the total fatal pedestrian crashes and approximately 17 percent of the total SR sample, which is a relatively small subset.
Figure 14. Chart. CART results for FARS pedestrian subset using limited crash–based variables. While a CART analysis was conducted for the companion SR pedestrian crashes in the GES database, it did not produce any branches. Thus, the analyses of these limited sets of variables for SR pedestrian crashes indicates that fatal crashes are more likely to be roads with the highest speed limits, but there are no variables that predict higher SR involvement for the full crash dataset found in GES.
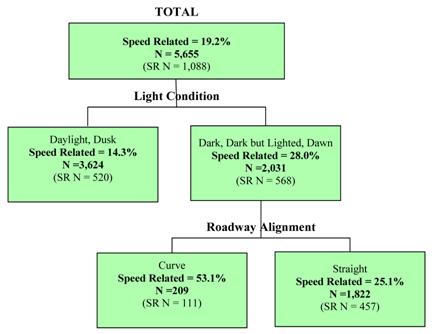
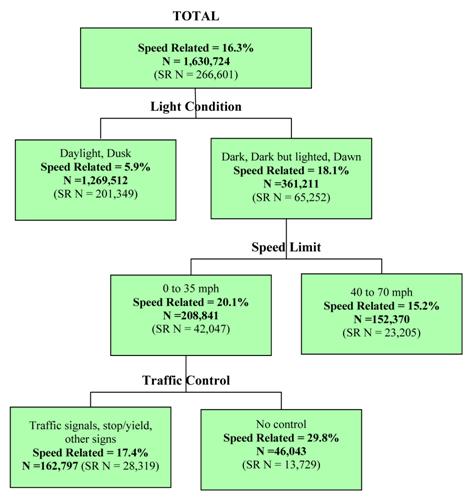
Intersection–Related Crashes The CART analyses for the fatal FARS SR intersection crashes using the limited set of variables produced a two–level tree (see figure 15). The most important SR predictive variable is light condition, and the categories with the highest SR percentage include dark, dark but lighted, and dawn (28 percent). Within that branch, the next variable is roadway alignment, with the highest SR category being curves. This final subcategory is 53 percent and accounts for approximately 2 percent of the total fatal intersection–related sample and approximately 10 percent of the total SR intersection sample. The companion CART analyses of the GES intersection crashes using the limited set of variables produced a three–level tree (see figure 16). The most important SR predictive variable is light condition, and the categories with the highest SR percentage include dark, dark but lighted, and dawn–the same as in the FARS results. Then within that branch, the most important variable is speed limit, with the highest SR category being zero to 35 mi/h. Within that branch, the most important variable is traffic control, with the highest SR categories being no control (as opposed to traffic signals and stop/yield). This final subset is 30 percent SR. It includes approximately 0.8 percent of the total GES intersection crashes in this training set and approximately 5 percent of the total SR intersection crashes. The FARS and CART results were consistent with respect to the most important predictor variable, which shows that SR crashes are more likely at night. There is less consistency after that, with the fatal intersection results showing that intersections on curves are of interest (which might imply intersection in rural areas where curves are more likely), while the total (GES) results indicate the most important intersections are those with lower speed limits (likely urban) and no stop/yield sign or traffic signal in uncontrolled urban intersections.
Figure 15. Chart. CART results for FARS intersection subset using limited crash–based variables.
Figure 16. Chart. CART results for GES intersection subset using limited crash–based variables.
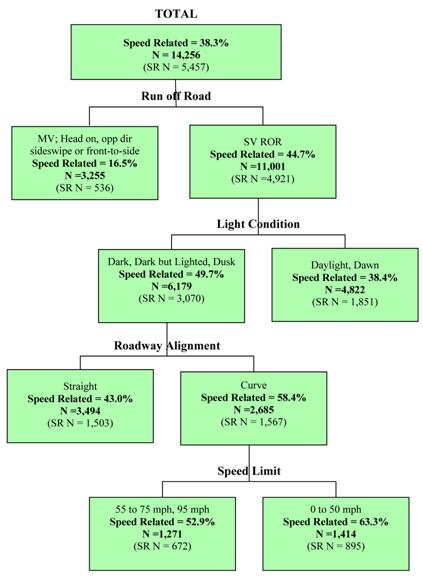
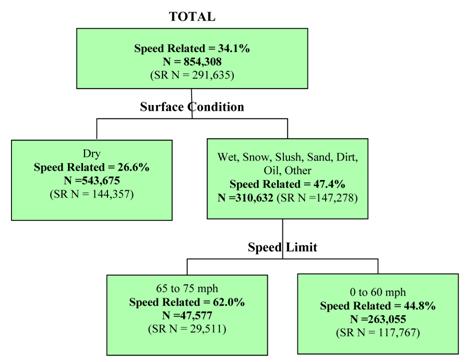
Lane Departure Crashes The CART analyses for the fatal FARS SR lane departure crashes using the limited set of variables produced a four–level tree (see figure 17). The most important SR predictive variable is the lane departure variable produced for this analysis, and the category with the highest SR percentage is the single–vehicle, run–off–road category. Within that branch, the most important variable is light condition, and the categories with the highest SR percentage include dark, dark but lighted, and dusk. Within that branch, the next variable is roadway alignment, and the category with the highest SR percentage is curves. Finally, within the curve branch, the final variable is speed limit, and the category with the highest SR percentage includes all speeds of zero to 50 mi/h. This final subcategory is 63 percent of SR crashes and includes approximately 6 percent of the fatal lane departure crashes and approximately 16 percent of the fatal SR lane departure crashes. The companion CART analyses of the GES lane departure crashes using the limited set of variables produced a two–level tree (see figure 18). The most important SR predictive variable is surface condition, and the categories with the highest SR percentage include wet, snow, slush, sand, dirt, oil, and other. Within that branch, the next variable is speed limit, with the highest SR percentage being for speed limits of 65–75 mi/h–the highest speed limit categories. This final subcategory is 62 percent of SR crashes and includes approximately 3 percent of the total lane departure crashes in this training set and approximately 10 percent of the SR lane departure crashes. The results from FARS and GES analyses for fatal and total lane departure crashes are not consistent. The most important fatal lane departure crashes in terms of SR are those at night, on curves, and on roads with speed limits less than 55 mi/h. The most important total lane departure crashes are those during bad weather on roads with the highest speed limits (i.e., interstate roads).
Figure 17. Chart. CART results for FARS lane departure subset using limited crash–based variables.
Figure 18. Chart. CART results for GES lane departure subset using limited crash–based variables.
FHWA-HRT-10-024
|