U.S. Department of Transportation
Federal Highway Administration
1200 New Jersey Avenue, SE
Washington, DC 20590
202-366-4000
Federal Highway Administration Research and Technology
Coordinating, Developing, and Delivering Highway Transportation Innovations
| REPORT |
| This report is an archived publication and may contain dated technical, contact, and link information |
|
| Publication Number: FHWA-HRT-13-047 Date: August 2013 |
Publication Number: FHWA-HRT-13-047 Date: August 2013 |
PDF files can be viewed with the Acrobat® Reader®
This appendix contains descriptions of each of the 28 interchanges used in developing the complex interchange spreadsheet tool. The descriptions each contain an aerial photograph, a brief description of the interchange's location and routes, and a summary of the characteristics used in the spreadsheet.
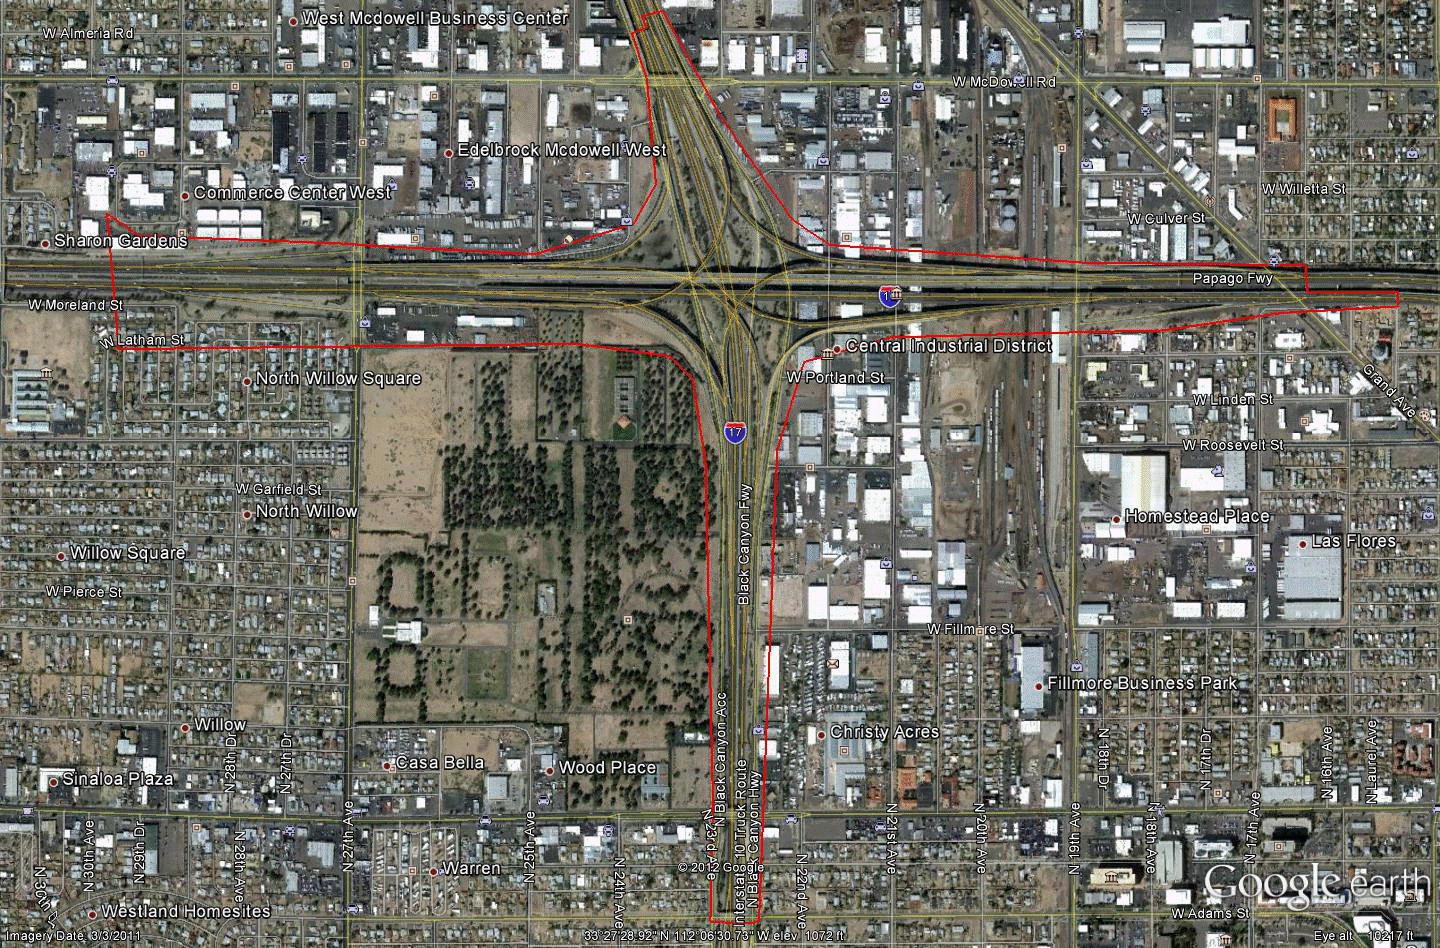
Information for site AZ-1 is as follows:
©2011 Google Earth®
Figure 80. Photo. Aerial view of site AZ-1. (50)
| Variable | NB | SB | EB | WB |
|---|---|---|---|---|
| Study length (ft) | 9,010 | 9,590 | 13,755 | 12,665 |
| Number of concurrent routes | 2 | 2 | 1 | 1 |
| Number of levels | 4 | 4 | 4 | 4 |
| Number of missing movements | 0 | 0 | 0 | 0 |
| Number of ramps | 4 | 4 | 5 | 4 |
| Exit ramps per mile | 1.17 | 1.10 | 1.15 | 0.83 |
| Entrance ramps per mile | 1.17 | 1.10 | 0.77 | 0.83 |
| Left exits per mile | 0.00 | 0.00 | 0.00 | 0.00 |
| Left entrances per mile | 0.00 | 0.00 | 0.00 | 0.00 |
| Number of exit ramps with multiple destinations per mile | 0.59 | 0.55 | 0.00 | 0.42 |
| Multilane exit ramps per mile | 0.59 | 0.55 | 0.38 | 0.42 |
| Optional/shared exit lanes per mile | 0.59 | 1.10 | 0.77 | 0.42 |
| Exit only lanes per mile | 1.17 | 1.10 | 0.77 | 0.83 |
| Score | 355 | 505 | 490 | 470 |
| Overall score | 455 | |||
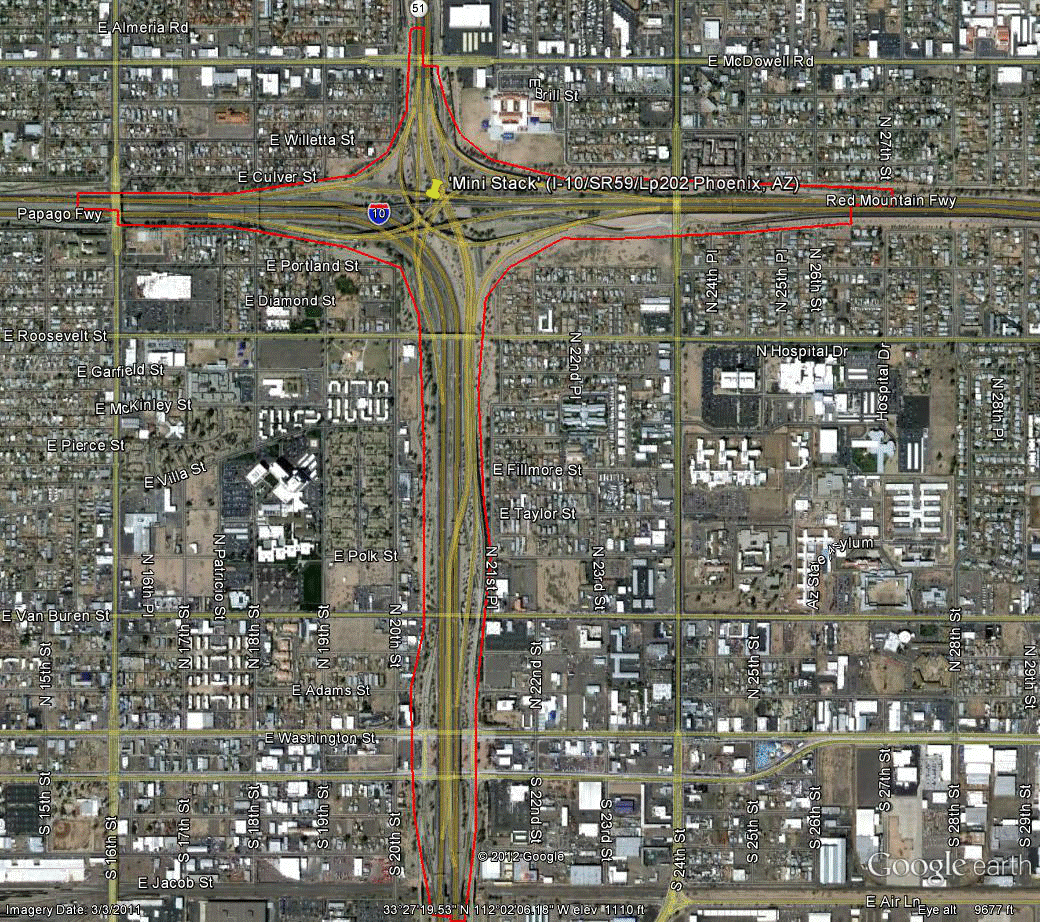
Information for site AZ-2 is as follows:
©2011 Google Earth®
Figure 81. Photo. Aerial view of site AZ-2. (51)
| Variable | NB | SB | EB | WB |
|---|---|---|---|---|
| Study length (ft) | 9,450 | 10,555 | 5,555 | 10,455 |
| Number of concurrent routes | 1 | 1.125 | 1 | 1 |
| Number of levels | 4 | 4 | 4 | 4 |
| Number of missing movements | 0 | 0 | 0 | 0 |
| Number of ramps | 4 | 8 | 2 | 7 |
| Exit ramps per mile | 1.68 | 1.50 | 1.90 | 1.52 |
| Entrance ramps per mile | 0.56 | 2.00 | 0.00 | 2.02 |
| Left exits per mile | 0.56 | 0.50 | 0.95 | 0.51 |
| Left entrances per mile | 0.00 | 1.00 | 0.00 | 0.00 |
| Number of exit ramps with multiple destinations per mile | 0.00 | 0.00 | 0.95 | 1.01 |
| Multilane exit ramps per mile | 0.56 | 0.50 | 0.95 | 0.00 |
| Optional/shared exit lanes per mile | 1.68 | 0.50 | 1.90 | 0.00 |
| Exit only lanes per mile | 0.56 | 1.50 | 1.90 | 1.52 |
| Score | 440 | 605 | 370 | 620 |
| Overall score | 508.75 | |||
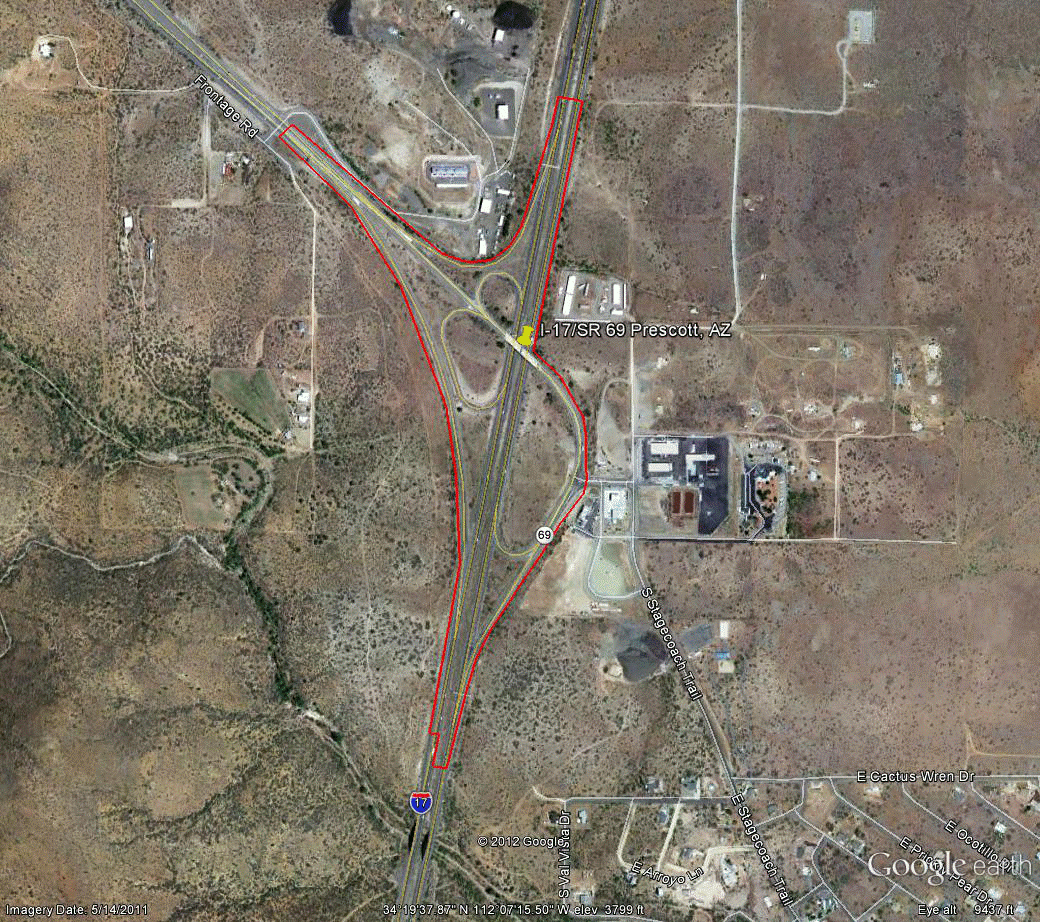
Information for site AZ-3 is as follows:
©2011 Google Earth®
Figure 82. Photo. Aerial view of site AZ-3.
(52)
| Variable | NB | SB | EB | WB |
|---|---|---|---|---|
| Study length (ft) | 46,355 | 46,360 | 6,945 | 4,305 |
| Number of concurrent routes | 1 | 1 | 1 | 1 |
| Number of levels | 2 | 2 | 2 | 2 |
| Number of missing movements | 0 | 0 | 0 | 0 |
| Number of ramps | 2 | 4 | 2 | 2 |
| Exit ramps per mile | 0.11 | 0.23 | 0.76 | 1.23 |
| Entrance ramps per mile | 0.11 | 0.23 | 0.76 | 1.23 |
| Left exits per mile | 0.00 | 0.00 | 0.00 | 0.00 |
| Left entrances per mile | 0.00 | 0.00 | 0.00 | 0.00 |
| Number of exit ramps with multiple destinations per mile | 0.11 | 0.00 | 0.00 | 0.00 |
| Multilane exit ramps per mile | 0.00 | 0.00 | 0.00 | 0.00 |
| Optional/shared exit lanes per mile | 0.11 | 0.11 | 0.00 | 1.23 |
| Exit only lanes per mile | 0.00 | 0.11 | 0.76 | 0.00 |
| Score | 154 | 230 | 270 | 300 |
| Overall score | 236.25 | |||
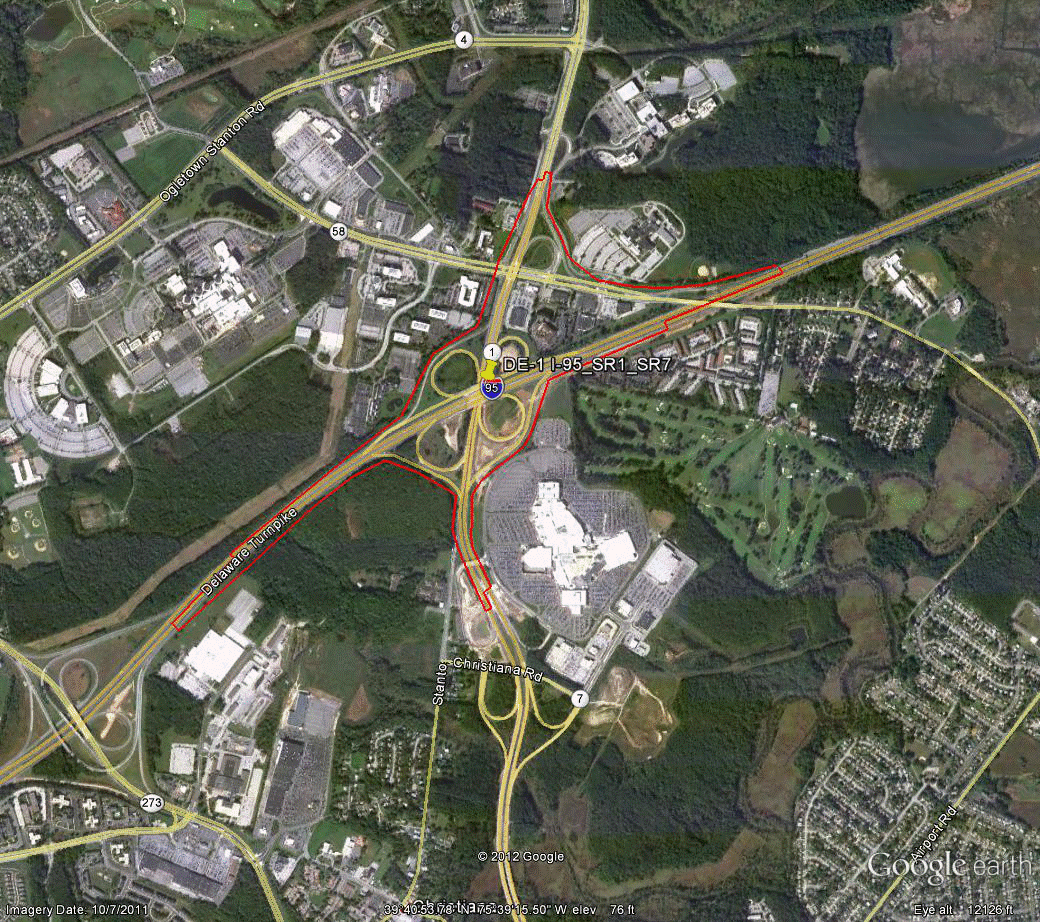
Information for site DE-1 is as follows:
©2011 Google Earth®
Figure 83. Photo. Aerial view of site DE-1. (53)
| Variable | NB | SB | EB | WB |
|---|---|---|---|---|
| Study length (ft) | 6,300 | 6,642 | 16,405 | 19,255 |
| Number of concurrent routes | 2 | 2 | 1 | 1 |
| Number of levels | 2 | 2 | 2 | 2 |
| Number of missing movements | 0 | 0 | 0 | 0 |
| Number of ramps | 5 | 3 | 4 | 3 |
| Exit ramps per mile | 2.51 | 0.79 | 0.64 | 0.55 |
| Entrance ramps per mile | 1.68 | 1.59 | 0.64 | 0.27 |
| Left exits per mile | 0.00 | 0.00 | 0.00 | 0.00 |
| Left entrances per mile | 0.00 | 0.00 | 0.00 | 0.00 |
| Number of exit ramps with multiple destinations per mile | 0.00 | 0.79 | 0.00 | 0.27 |
| Multilane exit ramps per mile | 0.00 | 0.79 | 0.00 | 0.00 |
| Optional/shared exit lanes per mile | 0.84 | 0.79 | 0.00 | 0.00 |
| Exit only lanes per mile | 1.68 | 0.79 | 0.64 | 0.55 |
| Score | 375 | 325 | 170 | 170 |
| Overall score | 260 | |||
Information for site DE-2 is as follows:
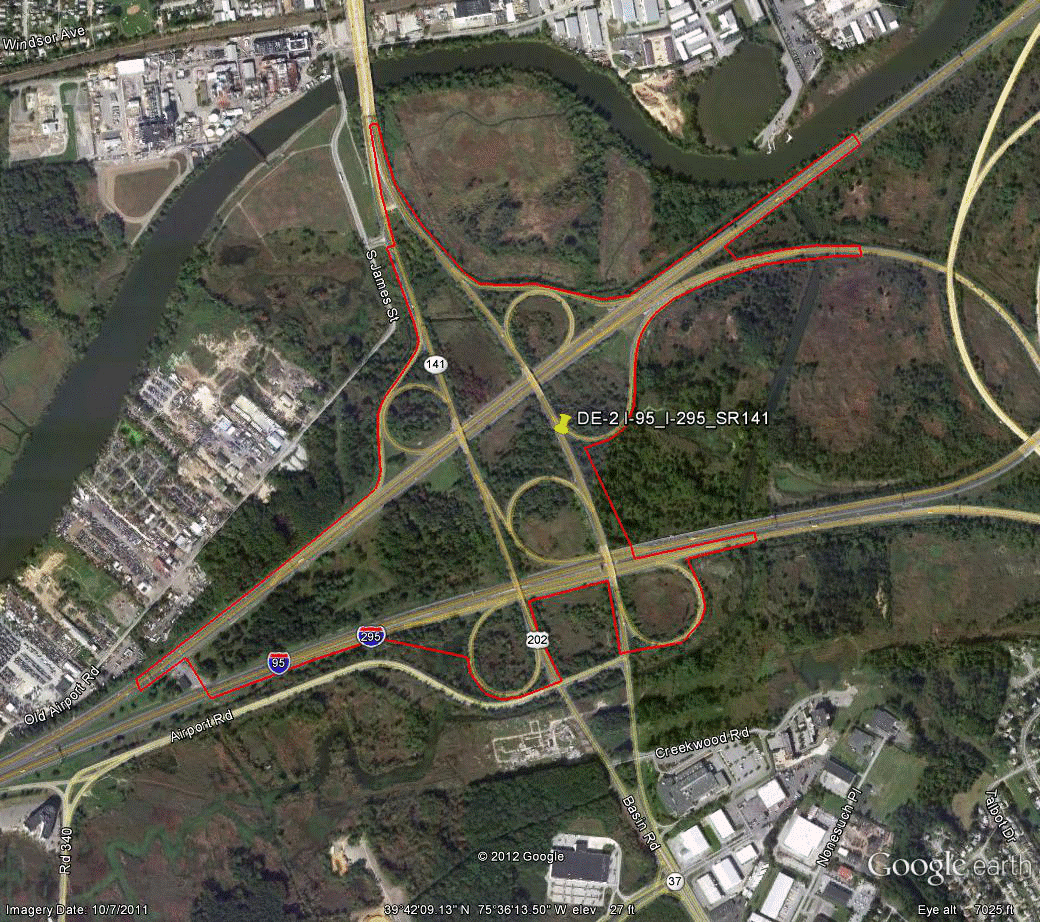
©2011 Google Earth®
Figure 84. Photo. Aerial view of site DE-2.
(54)
| Variable | NB | SB | EB | WB |
|---|---|---|---|---|
| Study length (ft) | 4,855 | 3,625 | 10,320 | 17,405 |
| Number of concurrent routes | 2 | 2 | 1 | 1 |
| Number of levels | 2 | 2 | 2 | 2 |
| Number of missing movements | 0 | 0 | 1 | 0 |
| Number of ramps | 5 | 4 | 2 | 3 |
| Exit ramps per mile | 2.18 | 4.37 | 0.51 | 0.30 |
| Entrance ramps per mile | 3.26 | 1.46 | 0.51 | 0.61 |
| Left exits per mile | 1.09 | 1.46 | 0.00 | 0.00 |
| Left entrances per mile | 0.00 | 0.00 | 0.51 | 0.30 |
| Number of exit ramps with multiple destinations per mile | 0.00 | 0.00 | 0.51 | 0.30 |
| Multilane exit ramps per mile | 0.00 | 0.00 | 0.51 | 0.30 |
| Optional/shared exit lanes per mile | 1.09 | 2.91 | 0.51 | 0.00 |
| Exit only lanes per mile | 1.09 | 1.46 | 0.51 | 0.61 |
| Score | 465 | 435 | 335 | 420 |
| Overall score | 413.75 | |||
Information for site DE-3 is as follows:
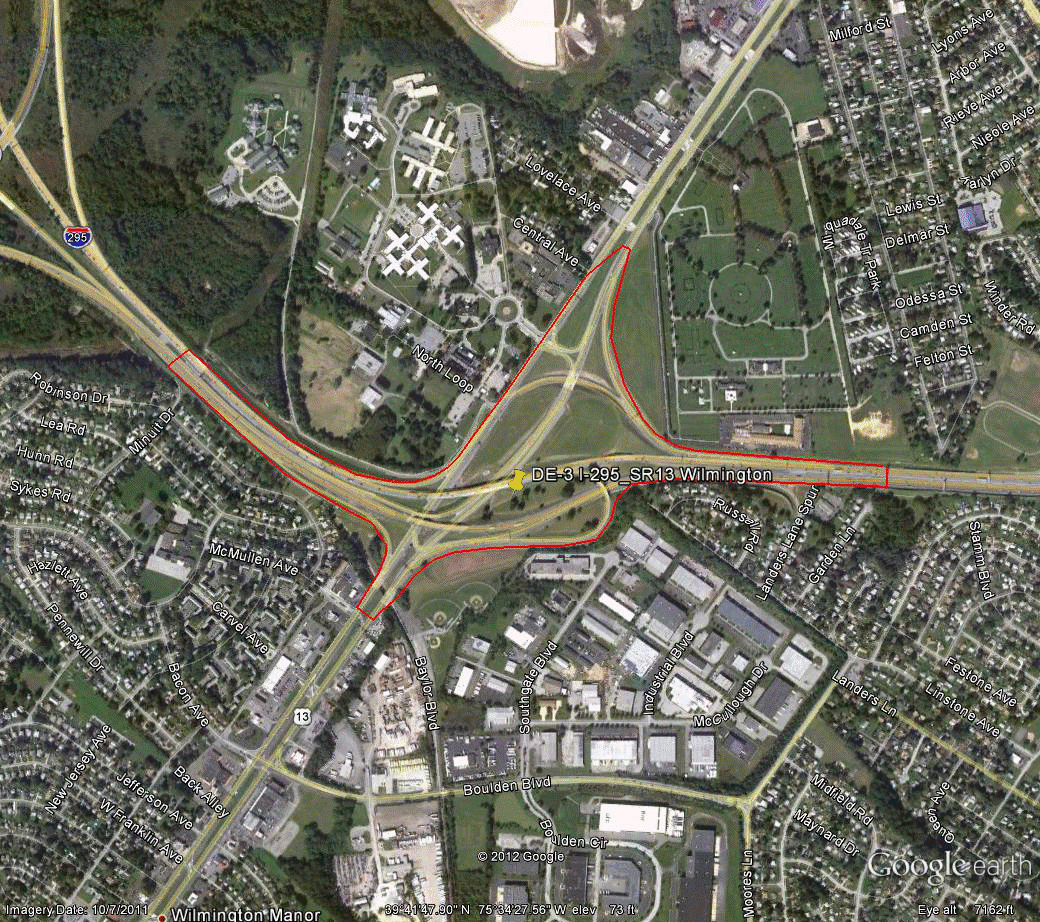
©2011 Google Earth®
Figure 85. Photo. Aerial view of site DE-3.
(55)
| Variable | NB | SB | EB | WB |
|---|---|---|---|---|
| Study length (ft) | 3,085 | 1,990 | 10,010 | 9,180 |
| Number of concurrent routes | 2 | 2 | 1 | 1 |
| Number of levels | 2 | 2 | 2 | 2 |
| Number of missing movements | 0 | 0 | 0 | 0 |
| Number of ramps | 5 | 4 | 4 | 3 |
| Exit ramps per mile | 1.71 | 5.31 | 1.05 | 0.58 |
| Entrance ramps per mile | 6.85 | 5.31 | 1.05 | 1.15 |
| Left exits per mile | 1.71 | 2.65 | 0.00 | 0.00 |
| Left entrances per mile | 5.13 | 2.65 | 0.53 | 0.58 |
| Number of exit ramps with multiple destinations per mile | 0.00 | 2.65 | 0.00 | 0.58 |
| Multilane exit ramps per mile | 1.71 | 0.00 | 0.00 | 0.58 |
| Optional/shared exit lanes per mile | 1.71 | 0.00 | 0.00 | 0.00 |
| Exit only lanes per mile | 1.71 | 5.31 | 1.05 | 1.15 |
| Score | 465 | 465 | 360 | 390 |
| Overall score | 420 | |||
Information for site GA-2 is as follows:
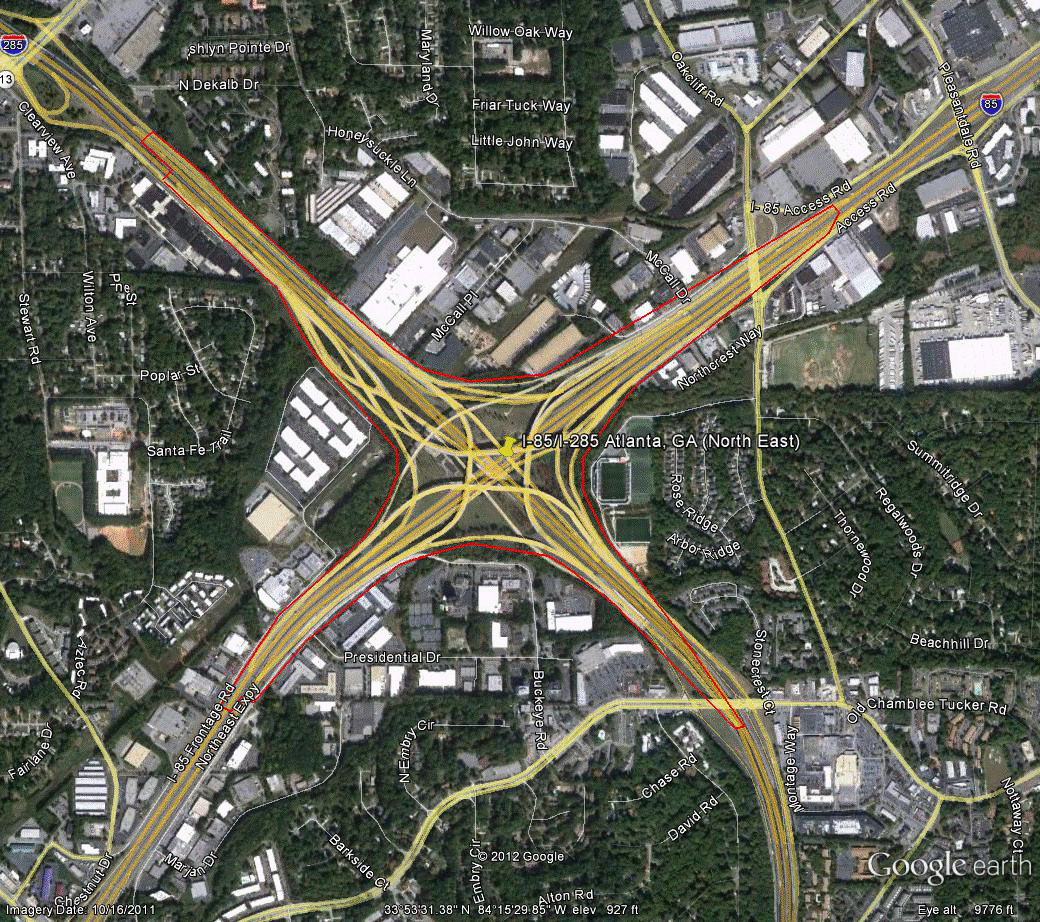
©2011 Google Earth®
Figure 86. Photo. Aerial view of site GA-2.
(56)
| Variable | NB | SB | EB | WB |
|---|---|---|---|---|
| Study length (ft) | 12,215 | 12,090 | 11,530 | 9,065 |
| Number of concurrent routes | 2 | 2 | 1 | 1 |
| Number of levels | 3 | 3 | 3 | 3 |
| Number of missing movements | 0 | 0 | 0 | 0 |
| Number of ramps | 4 | 4 | 4 | 3 |
| Exit ramps per mile | 0.86 | 0.87 | 0.92 | 0.58 |
| Entrance ramps per mile | 0.86 | 0.87 | 0.92 | 1.16 |
| Left exits per mile | 0.00 | 0.00 | 0.00 | 0.00 |
| Left entrances per mile | 0.00 | 0.00 | 0.00 | 0.00 |
| Number of exit ramps with multiple destinations per mile | 0.43 | 0.44 | 0.46 | 0.00 |
| Multilane exit ramps per mile | 0.43 | 0.87 | 0.92 | 0.00 |
| Optional/shared exit lanes per mile | 0.43 | 0.87 | 0.46 | 0.00 |
| Exit only lanes per mile | 0.86 | 0.87 | 1.37 | 0.58 |
| Score | 415 | 415 | 350 | 300 |
| Overall score | 370 | |||
Information for site GA-3 is as follows:
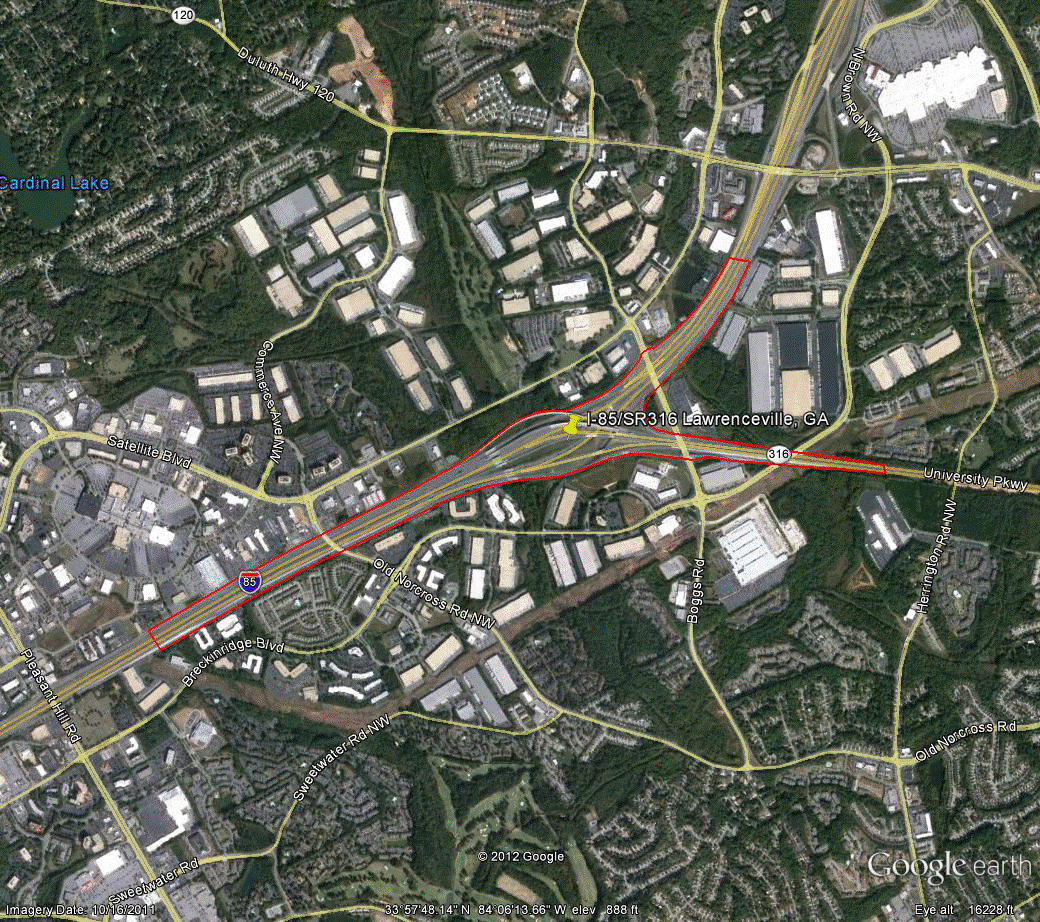
©2011 Google Earth®
Figure 87. Photo. Aerial view of site GA-3.(57)
| Variable | NB | SB | EB | WB |
|---|---|---|---|---|
| Study length (ft) | 17,450 | 16,095 | 8,285 | 13,920 |
| Number of concurrent routes | 2 | 2 | 1 | 1 |
| Number of levels | 2 | 2 | 2 | 2 |
| Number of missing movements | 0 | 1 | 0 | 0 |
| Number of ramps | 4 | 4 | 2 | 4 |
| Exit ramps per mile | 0.91 | 0.33 | 0.00 | 1.52 |
| Entrance ramps per mile | 0.30 | 0.98 | 1.27 | 0.00 |
| Left exits per mile | 0.30 | 0.00 | 0.00 | 0.76 |
| Left entrances per mile | 0.00 | 0.33 | 0.64 | 0.00 |
| Number of exit ramps with multiple destinations per mile | 0.30 | 0.00 | 0.00 | 0.00 |
| Multilane exit ramps per mile | 0.61 | 0.00 | 0.00 | 0.00 |
| Optional/shared exit lanes per mile | 0.61 | 0.00 | 0.00 | 0.76 |
| Exit only lanes per mile | 0.91 | 0.33 | 0.00 | 0.76 |
| Score | 435 | 250 | 200 | 380 |
| Overall score | 316.25 | |||
Information for site GA-4 is as follows:
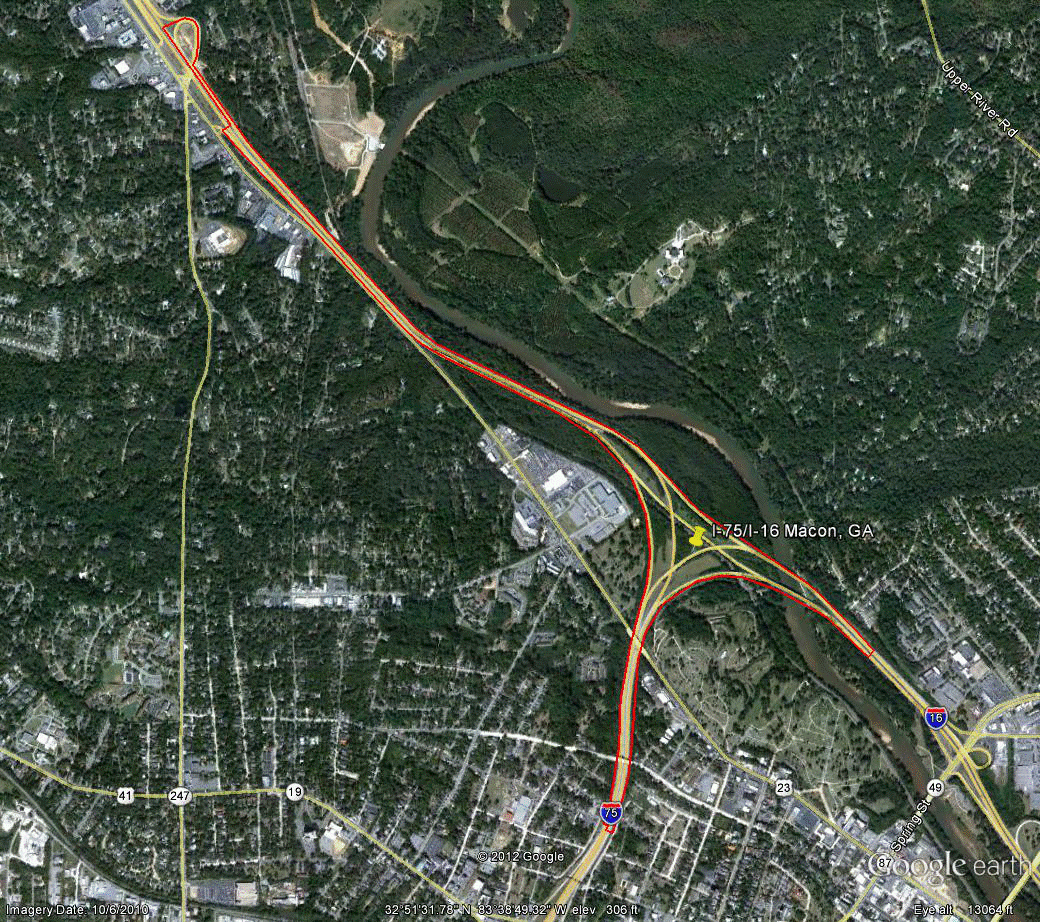
©2010 Google Earth®
Figure 88. Photo. Aerial view of site GA-4. (58)
| Variable | NB | SB | EB | WB |
|---|---|---|---|---|
| Study length (ft) | 5,810 | 12,025 | 2,400 | 8,680 |
| Number of concurrent routes | 2 | 2 | 2 | 2 |
| Number of levels | 2 | 2 | 2 | 2 |
| Number of missing movements | 0 | 0 | 0 | 0 |
| Number of ramps | 1 | 2 | 1 | 1 |
| Exit ramps per mile | 0.91 | 0.44 | 0.00 | 0.00 |
| Entrance ramps per mile | 0.00 | 0.44 | 2.20 | 0.61 |
| Left exits per mile | 0.00 | 0.44 | 0.00 | 0.00 |
| Left entrances per mile | 0.00 | 0.44 | 2.20 | 0.00 |
| Number of exit ramps with multiple destinations per mile | 0.00 | 0.00 | 0.00 | 0.00 |
| Multilane exit ramps per mile | 0.91 | 0.00 | 0.00 | 0.00 |
| Optional/shared exit lanes per mile | 0.00 | 0.00 | 0.00 | 0.00 |
| Exit only lanes per mile | 1.82 | 0.44 | 0.00 | 0.00 |
| Score | 295 | 265 | 225 | 105 |
| Overall score | 222.5 | |||
Information for site IN-1 is as follows:
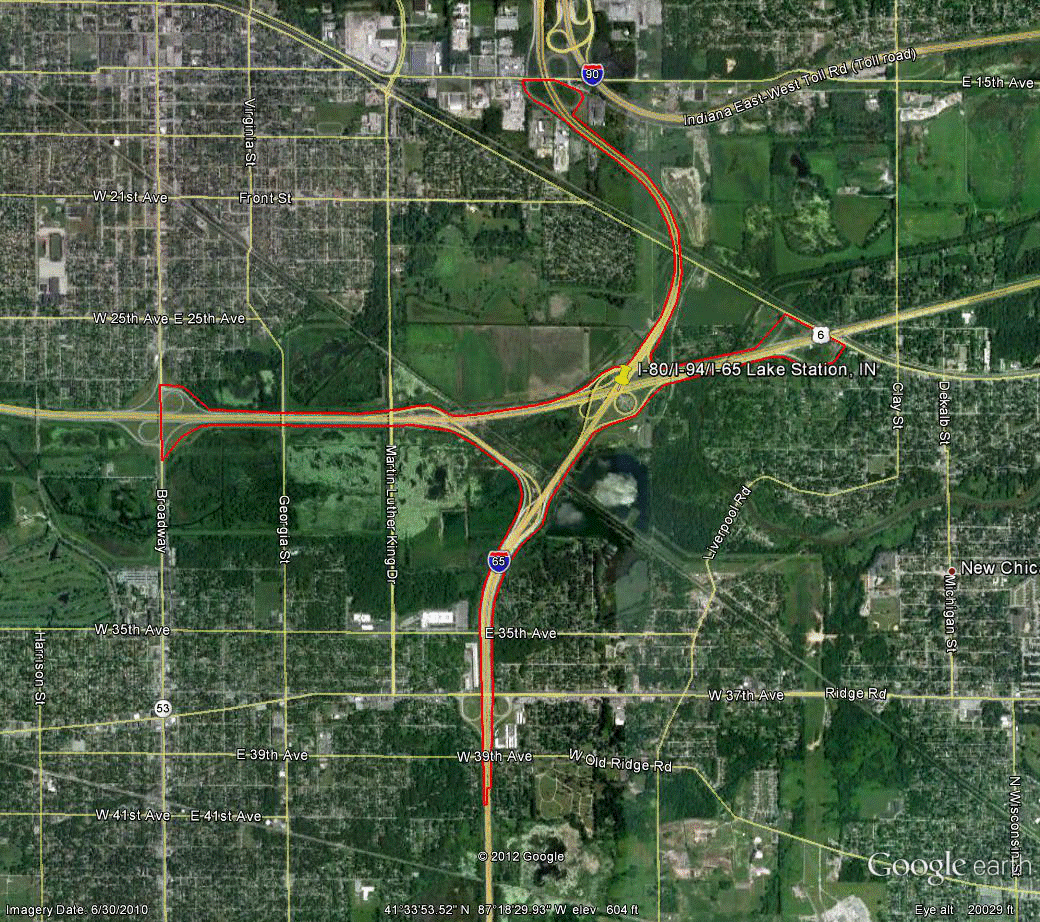
©2010 Google Earth®
Figure 89. Photo. Aerial view of site IN-1.(59)
| Variable | NB | SB | EB | WB |
|---|---|---|---|---|
| Study length (ft) | 16,330 | 15,650 | 24,575 | 10,605 |
| Number of concurrent routes | 1 | 1 | 3 | 3 |
| Number of levels | 2 | 2 | 2 | 2 |
| Number of missing movements | 0 | 0 | 0 | 0 |
| Number of ramps | 4 | 4 | 3 | 4 |
| Exit ramps per mile | 0.65 | 0.67 | 0.43 | 0.50 |
| Entrance ramps per mile | 0.65 | 0.67 | 0.21 | 1.49 |
| Left exits per mile | 0.00 | 0.00 | 0.00 | 0.00 |
| Left entrances per mile | 0.00 | 0.00 | 0.00 | 0.00 |
| Number of exit ramps with multiple destinations per mile | 0.00 | 0.34 | 0.43 | 0.50 |
| Multilane exit ramps per mile | 0.32 | 0.00 | 0.21 | 0.50 |
| Optional/shared exit lanes per mile | 0.00 | 0.00 | 0.21 | 0.50 |
| Exit only lanes per mile | 0.97 | 0.67 | 0.43 | 0.50 |
| Score | 330 | 230 | 365 | 250 |
| Overall score | 293.75 | |||
Information for site IN-3 is as follows:
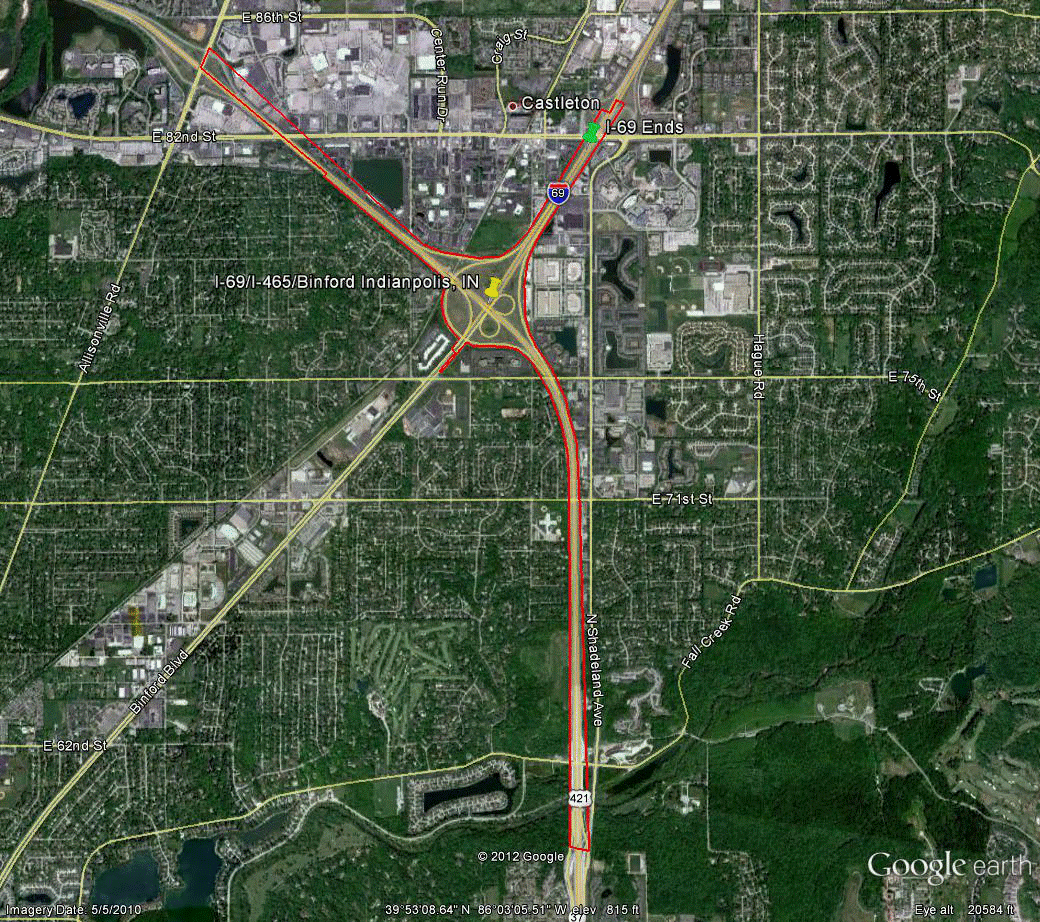
©2010 Google Earth®
Figure 90. Photo. Aerial view of site IN-3.(60)
| Variable | NB | SB | EB | WB |
|---|---|---|---|---|
| Study length (ft) | 5,105 | 6,605 | 18,015 | 17,915 |
| Number of concurrent routes | 3 | 2.5 | 3 | 3 |
| Number of levels | 2 | 2 | 2 | 2 |
| Number of missing movements | 1 | 0 | 0 | 1 |
| Number of ramps | 3 | 2 | 3 | 3 |
| Exit ramps per mile | 1.03 | 0.80 | 0.59 | 0.29 |
| Entrance ramps per mile | 2.07 | 0.80 | 0.29 | 0.59 |
| Left exits per mile | 0.00 | 0.00 | 0.00 | 0.00 |
| Left entrances per mile | 0.00 | 0.00 | 0.00 | 0.00 |
| Number of exit ramps with multiple destinations per mile | 0.00 | 0.80 | 0.00 | 0.00 |
| Multilane exit ramps per mile | 0.00 | 0.80 | 0.00 | 0.29 |
| Optional/shared exit lanes per mile | 0.00 | 0.80 | 0.00 | 0.29 |
| Exit only lanes per mile | 1.03 | 1.60 | 0.59 | 0.29 |
| Score | 325 | 330 | 220 | 235 |
| Overall score | 277.5 | |||
Information for site IA-1 is as follows:
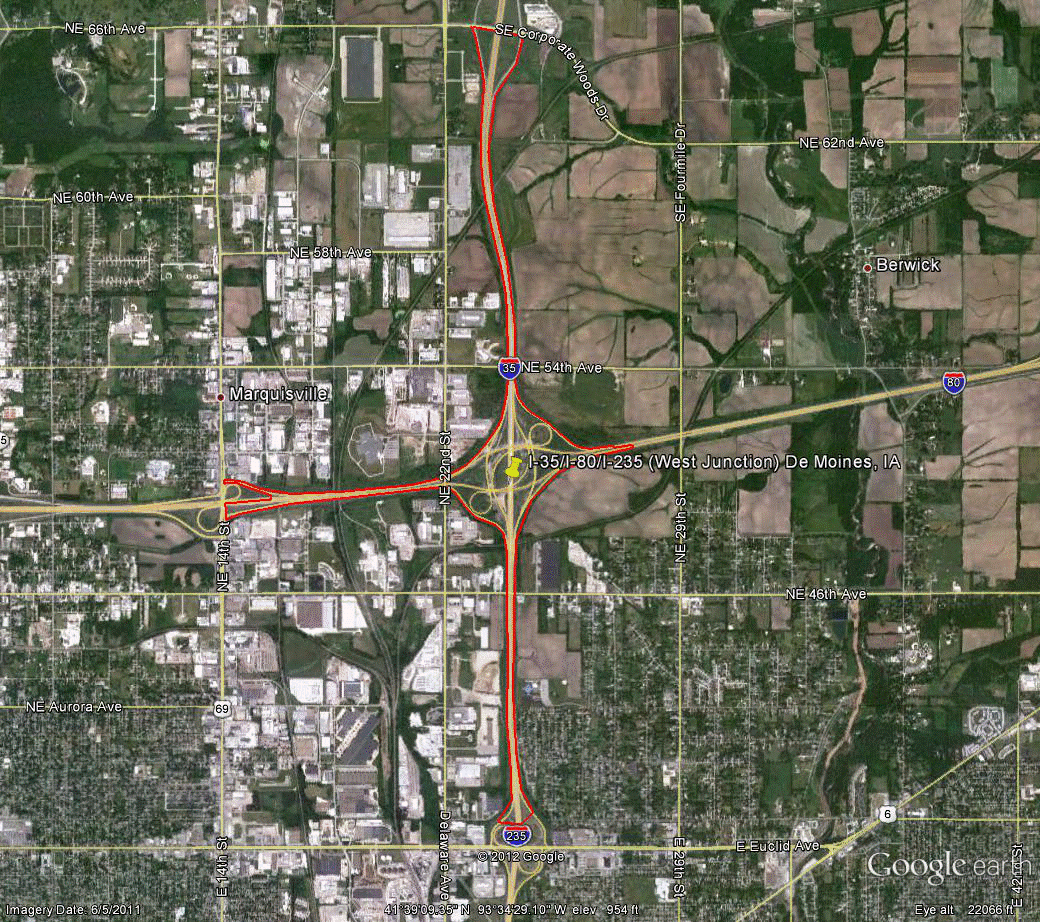
©2011 Google Earth®
Figure 91. Photo. Aerial view of site IA-1.(61)
| Variable | NB | SB | EB | WB |
|---|---|---|---|---|
| Study length (ft) | 15,105 | 15,775 | 18,159 | 17,100 |
| Number of concurrent routes | 1.333 | 1.333 | 1.25 | 1.25 |
| Number of levels | 2 | 2 | 2 | 2 |
| Number of missing movements | 0 | 0 | 0 | 0 |
| Number of ramps | 3 | 3 | 4 | 4 |
| Exit ramps per mile | 0.35 | 0.33 | 0.58 | 0.62 |
| Entrance ramps per mile | 0.70 | 0.67 | 0.58 | 0.62 |
| Left exits per mile | 0.00 | 0.00 | 0.29 | 0.31 |
| Left entrances per mile | 0.00 | 0.00 | 0.00 | 0.00 |
| Number of exit ramps with multiple destinations per mile | 0.35 | 0.33 | 0.00 | 0.00 |
| Multilane exit ramps per mile | 0.35 | 0.33 | 0.00 | 0.00 |
| Optional/shared exit lanes per mile | 0.00 | 0.00 | 0.00 | 0.31 |
| Exit only lanes per mile | 0.70 | 0.67 | 0.58 | 0.31 |
| Score | 345 | 305 | 275 | 375 |
| Overall score | 325 | |||
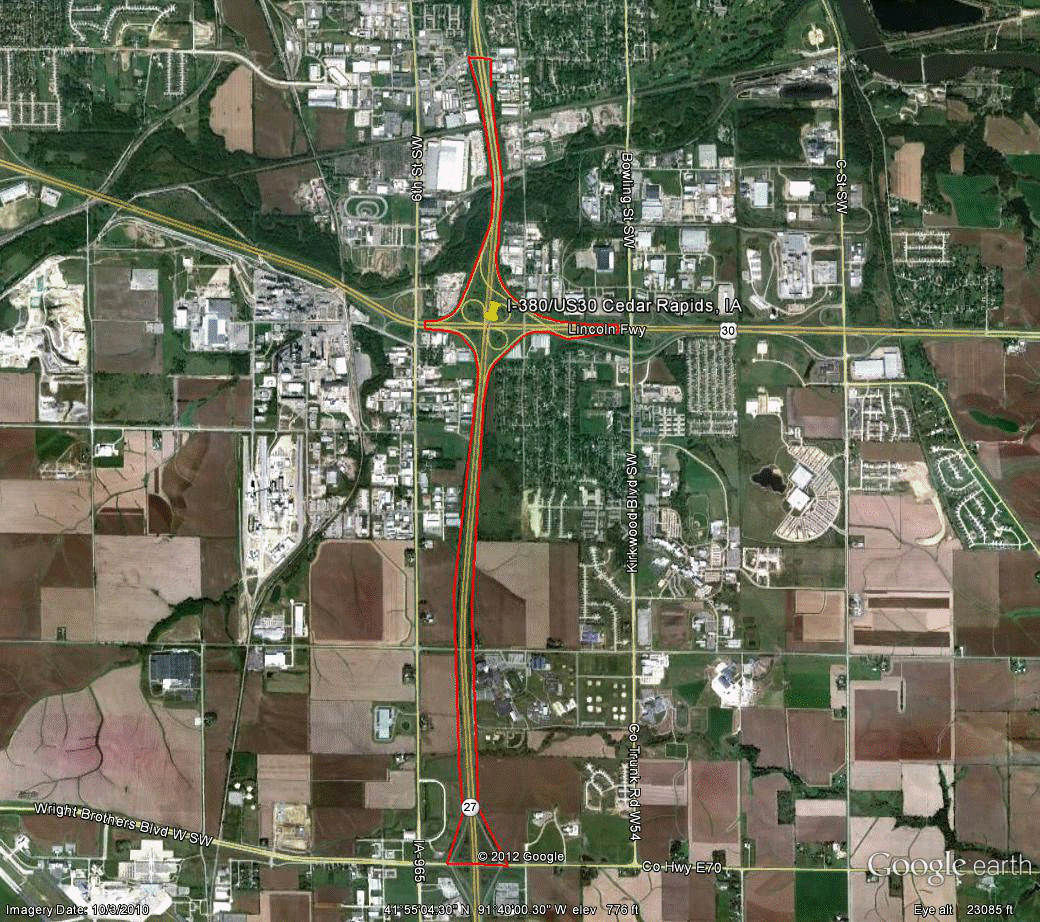
Information for site IA-2 is as follows:
©2010 Google Earth®
Figure 92. Photo. Aerial view of site IA-2. (62)
| Variable | NB | SB | EB | WB |
|---|---|---|---|---|
| Study length (ft) | 17,250 | 17,030 | 5,775 | 5,815 |
| Number of concurrent routes | 2 | 1.667 | 2 | 2.5 |
| Number of levels | 2 | 2 | 2 | 2 |
| Number of missing movements | 0 | 0 | 0 | 0 |
| Number of ramps | 4 | 3 | 4 | 4 |
| Exit ramps per mile | 0.61 | 0.31 | 1.83 | 1.82 |
| Entrance ramps per mile | 0.61 | 0.62 | 1.83 | 1.82 |
| Left exits per mile | 0.00 | 0.00 | 0.00 | 0.00 |
| Left entrances per mile | 0.00 | 0.00 | 0.00 | 0.00 |
| Number of exit ramps with multiple destinations per mile | 0.00 | 0.31 | 0.00 | 0.00 |
| Multilane exit ramps per mile | 0.00 | 0.31 | 0.00 | 0.00 |
| Optional/shared exit lanes per mile | 0.31 | 0.31 | 0.00 | 0.00 |
| Exit only lanes per mile | 0.31 | 0.31 | 1.83 | 1.82 |
| Score | 255 | 245 | 295 | 270 |
| Overall score | 266.25 | |||
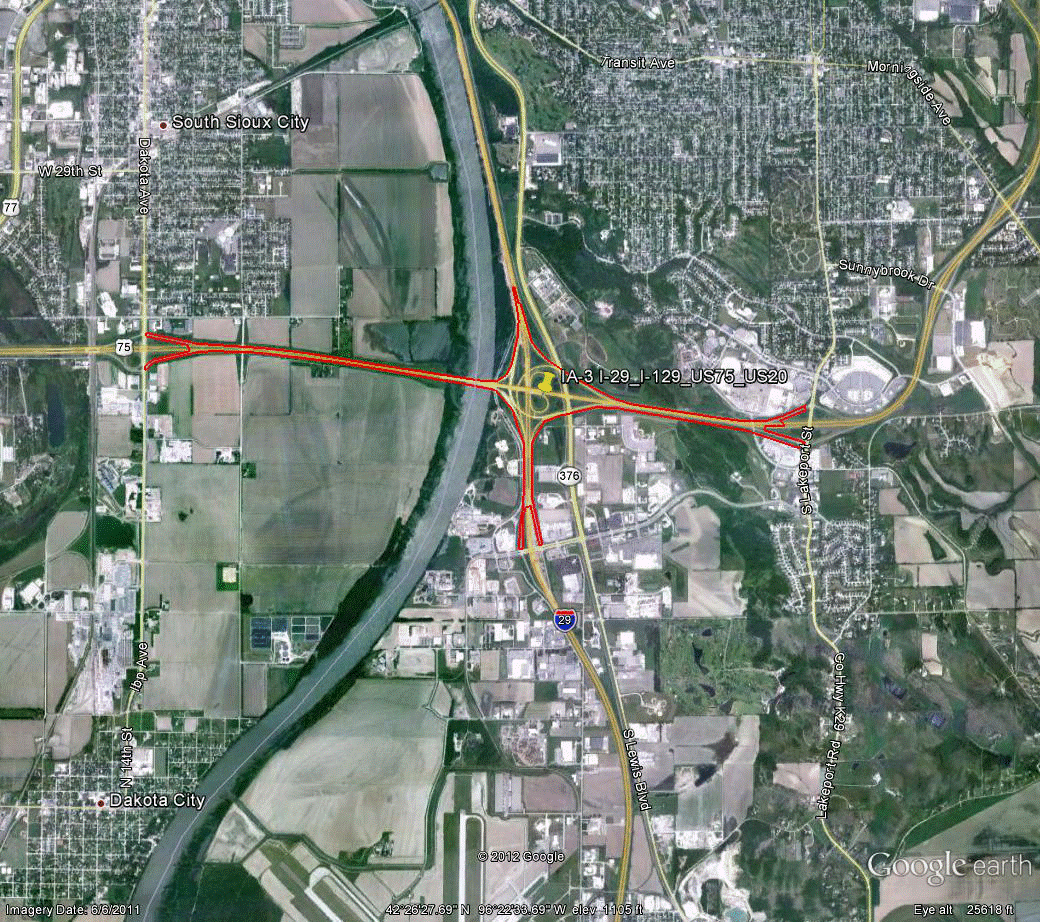
Information for site IA-3 is as follows:
©2010 Google Earth®
Figure 93. Photo. Aerial view of site IA-3. (63)
| Variable | NB | SB | EB | WB |
|---|---|---|---|---|
| Study length (ft) | 18,055 | 17,625 | 14,595 | 15,290 |
| Number of concurrent routes | 1 | 1 | 2.333 | 2.333 |
| Number of levels | 2 | 2 | 2 | 2 |
| Number of missing movements | 0 | 0 | 0 | 0 |
| Number of ramps | 4 | 2 | 2 | 3 |
| Exit ramps per mile | 0.58 | 0.30 | 0.72 | 0.35 |
| Entrance ramps per mile | 0.58 | 0.30 | 0.36 | 0.69 |
| Left exits per mile | 0.00 | 0.00 | 0.00 | 0.00 |
| Left entrances per mile | 0.00 | 0.00 | 0.00 | 0.00 |
| Number of exit ramps with multiple destinations per mile | 0.00 | 0.30 | 0.00 | 0.35 |
| Multilane exit ramps per mile | 0.00 | 0.00 | 0.00 | 0.35 |
| Optional/shared exit lanes per mile | 0.00 | 0.00 | 0.72 | 0.35 |
| Exit only lanes per mile | 0.58 | 0.30 | 0.00 | 0.35 |
| Score | 210 | 145 | 280 | 280 |
| Overall score | 228.75 | |||
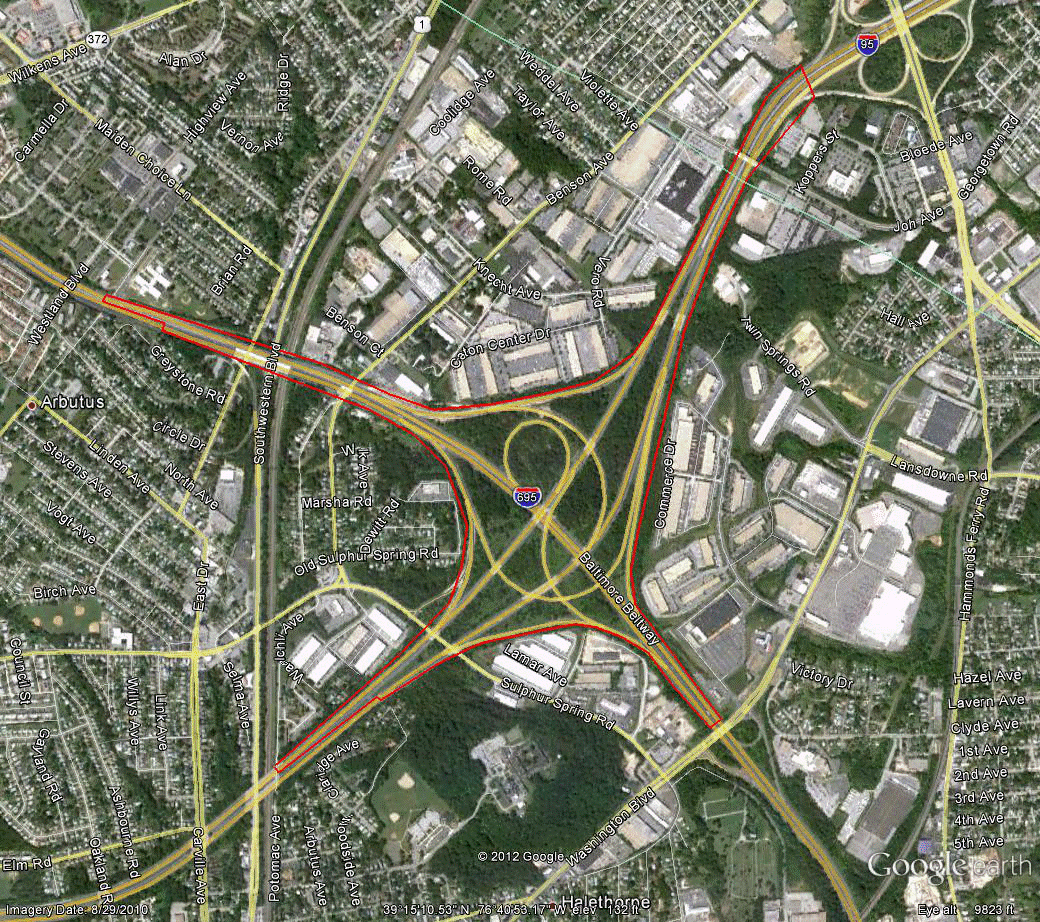
Information for site MD-1 is as follows:
©2010 Google Earth®
Figure 94. Photo. Aerial view of site MD-1. (64)
| Variable | NB | SB | EB | WB |
|---|---|---|---|---|
| Study length (ft) | 13,450 | 6,520 | 7,770 | 7,755 |
| Number of concurrent routes | 1 | 1 | 1 | 1 |
| Number of levels | 2 | 2 | 2 | 2 |
| Number of missing movements | 0 | 0 | 0 | 0 |
| Number of ramps | 3 | 3 | 2 | 3 |
| Exit ramps per mile | 0.79 | 1.62 | 0.68 | 1.36 |
| Entrance ramps per mile | 0.39 | 0.81 | 0.68 | 0.68 |
| Left exits per mile | 0.39 | 0.81 | 0.00 | 0.00 |
| Left entrances per mile | 0.00 | 0.00 | 0.00 | 0.00 |
| Number of exit ramps with multiple destinations per mile | 0.00 | 0.00 | 0.68 | 0.00 |
| Multilane exit ramps per mile | 0.00 | 0.00 | 0.68 | 0.00 |
| Optional/shared exit lanes per mile | 0.00 | 0.00 | 0.68 | 0.00 |
| Exit only lanes per mile | 0.79 | 1.62 | 1.36 | 1.36 |
| Score | 260 | 270 | 380 | 310 |
| Overall score | 305 | |||
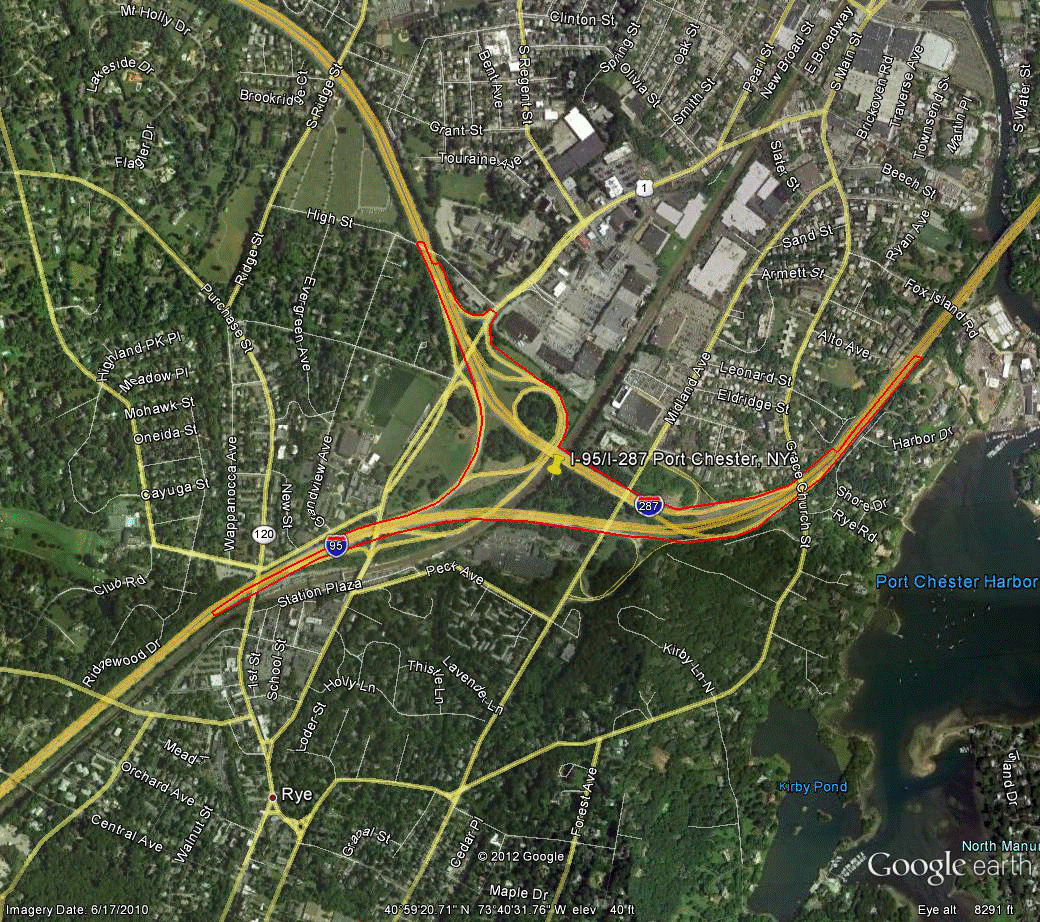
Information for site NY-1 is as follows:
©2010 Google Earth®
Figure 95. Photo. Aerial view of site NY-1. (65)
| Variable | NB | SB | EB | WB |
|---|---|---|---|---|
| Study length (ft) | 15,700 | 15,730 | 14,165 | 9,500 |
| Number of concurrent routes | 1 | 1 | 1 | 1 |
| Number of levels | 2 | 2 | 2 | 2 |
| Number of missing movements | 0 | 0 | 0 | 0 |
| Number of ramps | 4 | 2 | 3 | 5 |
| Exit ramps per mile | 1.01 | 0.34 | 0.75 | 1.11 |
| Entrance ramps per mile | 0.34 | 0.34 | 0.37 | 1.67 |
| Left exits per mile | 0.00 | 0.00 | 0.00 | 0.00 |
| Left entrances per mile | 0.00 | 0.00 | 0.00 | 0.00 |
| Number of exit ramps with multiple destinations per mile | 0.00 | 0.34 | 0.00 | 0.00 |
| Multilane exit ramps per mile | 0.00 | 0.00 | 0.00 | 0.00 |
| Optional/shared exit lanes per mile | 0.00 | 0.00 | 0.00 | 0.56 |
| Exit only lanes per mile | 1.01 | 0.34 | 0.75 | 0.56 |
| Score | 200 | 300 | 280 | 360 |
| Overall score | 285 | |||
Information for site NY-3 is as follows:
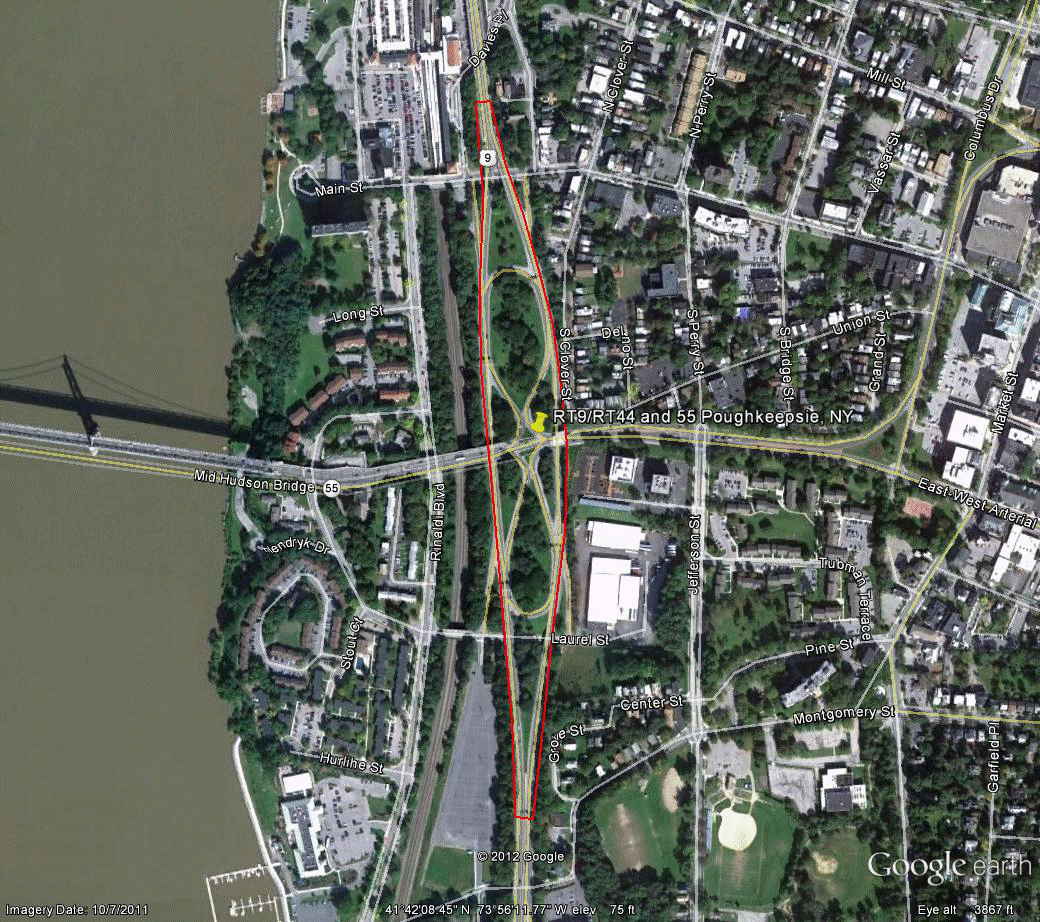
©2011 Google Earth®
Figure 96. Photo. Aerial view of site NY-3. (66)
| Variable | NB | SB | EB | WB |
|---|---|---|---|---|
| Study length (ft) | 3,270 | 2,820 | 10,055 | 10,150 |
| Number of concurrent routes | 1 | 1 | 2 | 2 |
| Number of levels | 2 | 2 | 2 | 2 |
| Number of missing movements | 0 | 0 | 0 | 0 |
| Number of ramps | 6 | 6 | 2 | 2 |
| Exit ramps per mile | 3.23 | 5.62 | 0.53 | 0.52 |
| Entrance ramps per mile | 4.84 | 5.62 | 0.53 | 0.52 |
| Left exits per mile | 3.23 | 3.74 | 0.00 | 0.00 |
| Left entrances per mile | 3.23 | 3.74 | 0.00 | 0.00 |
| Number of exit ramps with multiple destinations per mile | 0.00 | 0.00 | 0.00 | 0.00 |
| Multilane exit ramps per mile | 0.00 | 0.00 | 0.00 | 0.00 |
| Optional/shared exit lanes per mile | 1.61 | 1.87 | 0.00 | 0.00 |
| Exit only lanes per mile | 3.23 | 3.74 | 0.53 | 0.52 |
| Score | 490 | 470 | 235 | 195 |
| Overall score | 347.5 | |||
Information for site OH-1 is as follows:
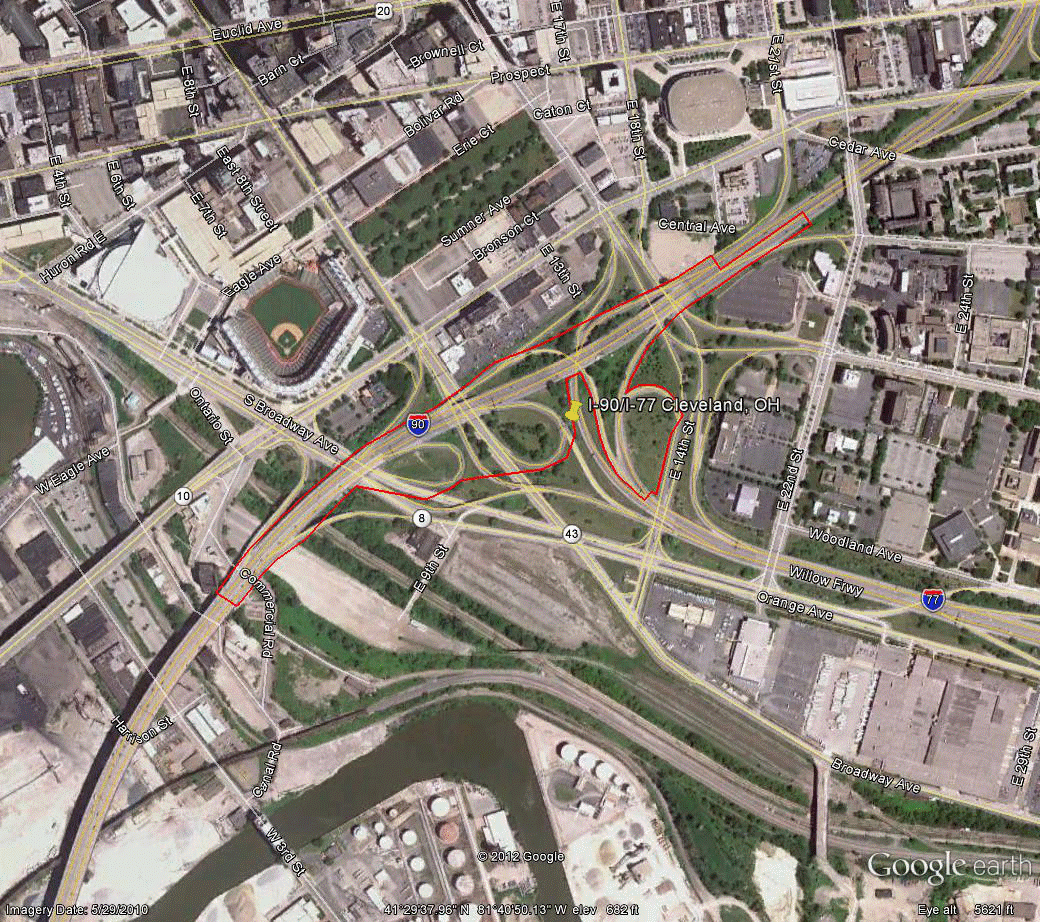
©2010 Google Earth®
Figure 97. Photo. Aerial view of site OH-1. (67)
| Variable | NB | SB | EB | WB |
|---|---|---|---|---|
| Study length (ft) | 7,235 | 8,505 | 0 | 1,785 |
| Number of concurrent routes | 1 | 1 | 0 | 1 |
| Number of levels | 2 | 2 | 0 | 2 |
| Number of missing movements | 0 | 0 | 0 | 1 |
| Number of ramps | 5 | 4 | 0 | 3 |
| Exit ramps per mile | 2.92 | 0.62 | 0 | 8.87 |
| Entrance ramps per mile | 0.73 | 1.86 | 0 | 0.00 |
| Left exits per mile | 0.00 | 0.00 | 0 | 2.96 |
| Left entrances per mile | 0.00 | 0.00 | 0 | 0.00 |
| Number of exit ramps with multiple destinations per mile | 0.00 | 0.00 | 0 | 5.92 |
| Multilane exit ramps per mile | 0.00 | 0.00 | 0 | 2.96 |
| Optional/shared exit lanes per mile | 0.73 | 0.62 | 0 | 5.92 |
| Exit only lanes per mile | 2.19 | 0.00 | 0 | 5.92 |
| Score | 480 | 360 | - | 465 |
| Overall score | 435 | |||
- Indicates no score was generated because EB approach was not present.
Information for site OH-2 is as follows:
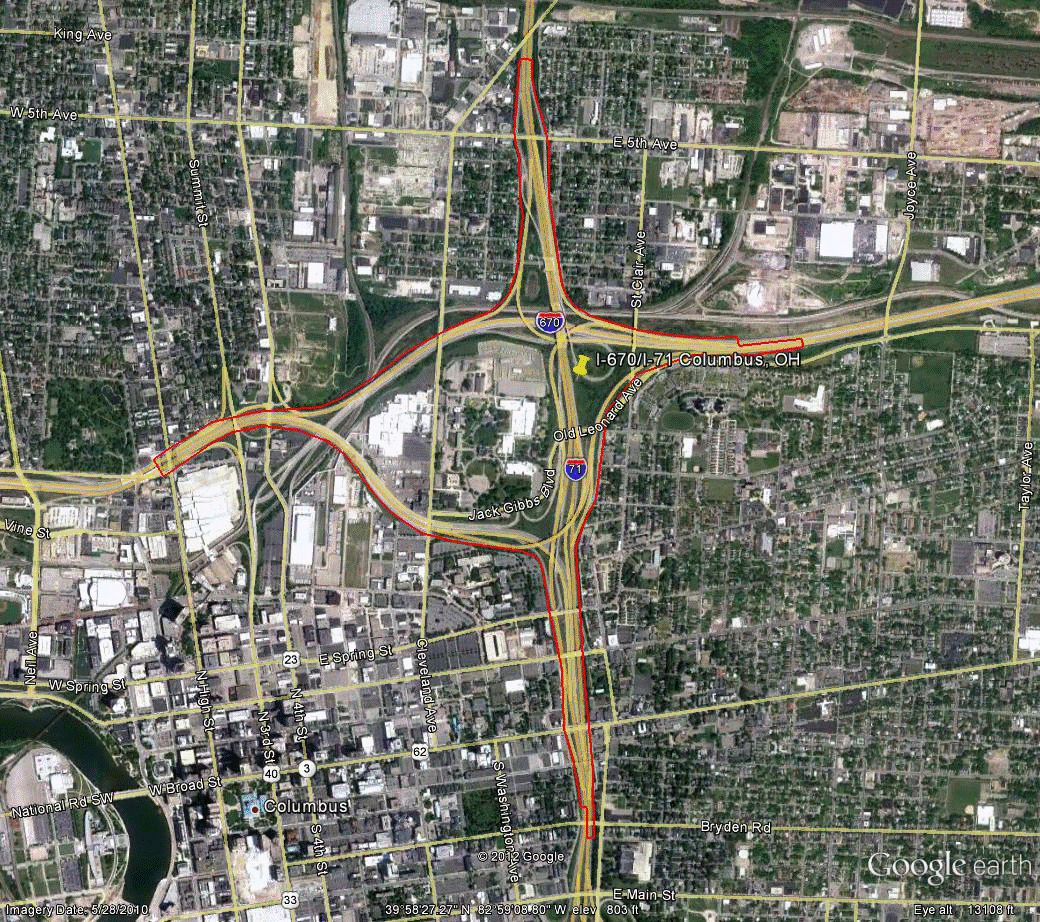
©2010 Google Earth®
Figure 98. Photo. Aerial view of site OH-2. (68)
| Variable | NB | SB | EB | WB |
|---|---|---|---|---|
| Study length (ft) | 12,160 | 10,840 | 14,815 | 13,430 |
| Number of concurrent routes | 1 | 1 | 1 | 1 |
| Number of levels | 2 | 2 | 2 | 2 |
| Number of missing movements | 0 | 0 | 0 | 0 |
| Number of ramps | 8 | 9 | 8 | 6 |
| Exit ramps per mile | 1.30 | 1.95 | 1.43 | 1.18 |
| Entrance ramps per mile | 2.17 | 0.97 | 1.43 | 1.18 |
| Left exits per mile | 0.43 | 0.49 | 0.71 | 0.39 |
| Left entrances per mile | 0.43 | 0.00 | 0.36 | 0.39 |
| Number of exit ramps with multiple destinations per mile | 0.00 | 0.49 | 0.36 | 0.39 |
| Multilane exit ramps per mile | 0.43 | 0.49 | 0.71 | 0.79 |
| Optional/shared exit lanes per mile | 0.87 | 0.97 | 0.36 | 0.79 |
| Exit only lanes per mile | 0.87 | 1.95 | 1.78 | 1.18 |
| Score | 700 | 520 | 680 | 610 |
| Overall score | 627.5 | |||
Information for site OH-3 is as follows:
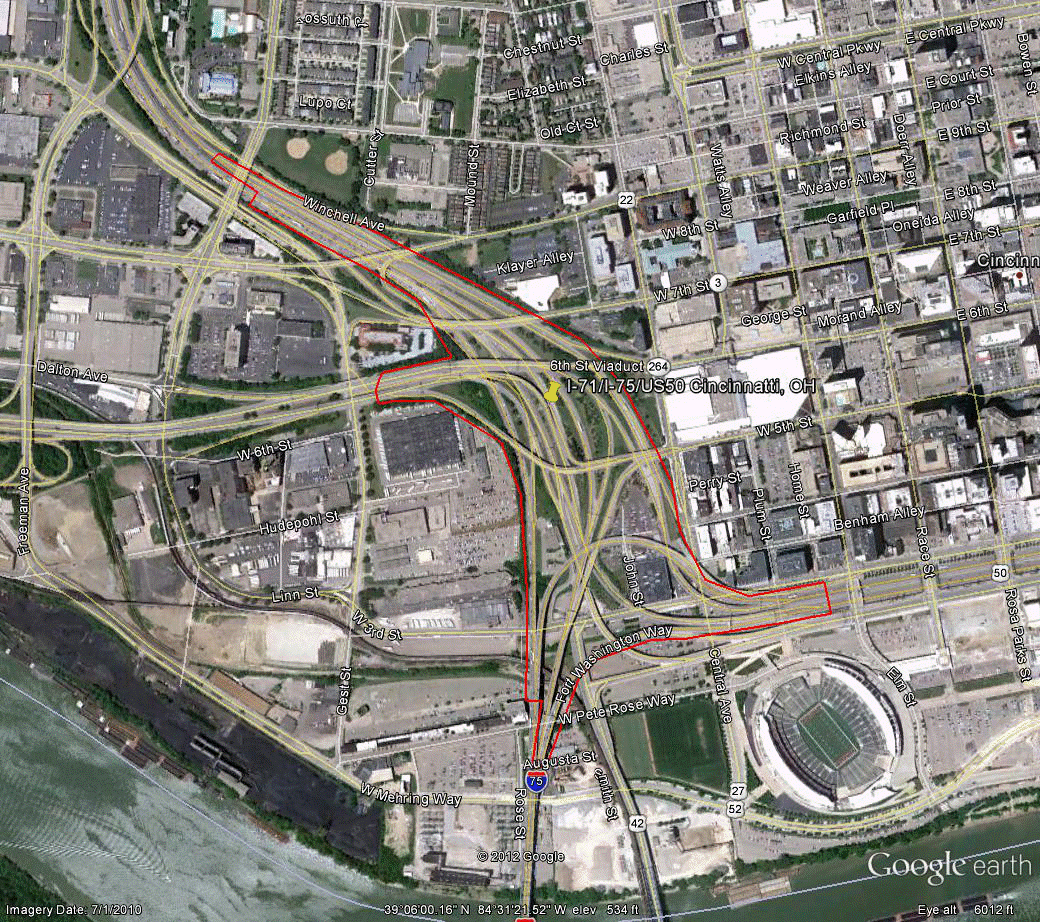
©2010 Google Earth®
Figure 99. Photo. Aerial view of site OH-3.(69)
| Variable | NB | SB | EB | WB |
|---|---|---|---|---|
| Study length (ft) | 8,410 | 7,945 | 6,485 | 8,530 |
| Number of concurrent routes | 1.5 | 1.25 | 1 | 1.6 |
| Number of levels | 3 | 3 | 3 | 3 |
| Number of missing movements | 0 | 1 | 1 | 0 |
| Number of ramps | 4 | 4 | 4 | 5 |
| Exit ramps per mile | 1.88 | 1.33 | 1.63 | 1.24 |
| Entrance ramps per mile | 0.63 | 1.33 | 1.63 | 1.86 |
| Left exits per mile | 0.00 | 0.66 | 0.00 | 0.62 |
| Left entrances per mile | 0.00 | 1.33 | 1.63 | 0.00 |
| Number of exit ramps with multiple destinations per mile | 0.63 | 0.66 | 0.81 | 0.62 |
| Multilane exit ramps per mile | 0.63 | 1.33 | 0.81 | 0.62 |
| Optional/shared exit lanes per mile | 1.26 | 0.66 | 0.00 | 0.00 |
| Exit only lanes per mile | 1.26 | 1.99 | 2.44 | 1.86 |
| Score | 565 | 730 | 625 | 495 |
| Overall score | 603.75 | |||
Information for site OR-1 is as follows:
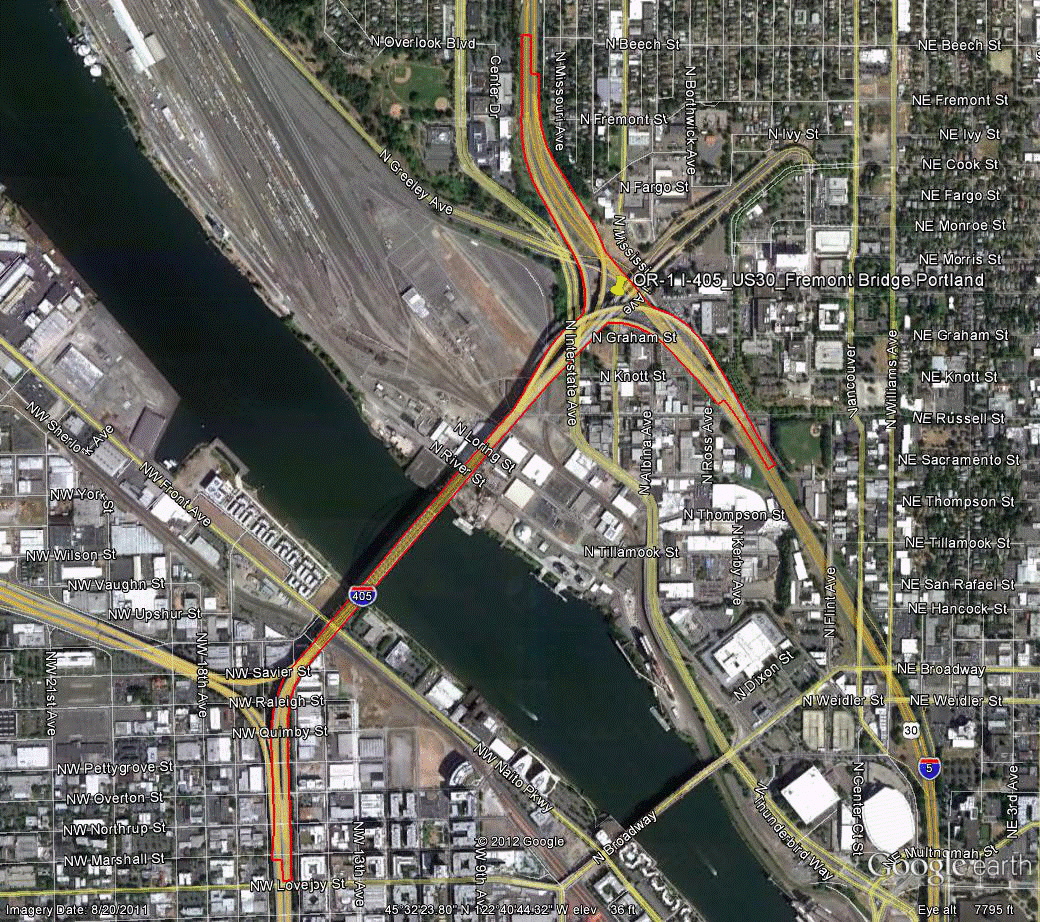
©2011 Google Earth®
Figure 100. Photo. Aerial view of site OR-1. (70)
| Variable | NB | SB | EB | WB |
|---|---|---|---|---|
| Study length (ft) | 6,220 | 6,580 | 8,340 | 5,760 |
| Number of concurrent routes | 1 | 1 | 1.25 | 1.5 |
| Number of levels | 4 | 4 | 4 | 4 |
| Number of missing movements | 0 | 0 | 0 | 0 |
| Number of ramps | 3 | 3 | 4 | 4 |
| Exit ramps per mile | 1.70 | 0.80 | 1.90 | 0.92 |
| Entrance ramps per mile | 0.85 | 1.60 | 0.63 | 2.75 |
| Left exits per mile | 0.00 | 0.00 | 1.27 | 0.00 |
| Left entrances per mile | 0.00 | 0.00 | 0.63 | 0.00 |
| Number of exit ramps with multiple destinations per mile | 0.00 | 0.80 | 0.63 | 0.00 |
| Multilane exit ramps per mile | 0.85 | 0.80 | 0.63 | 0.92 |
| Optional/shared exit lanes per mile | 1.70 | 0.00 | 1.27 | 0.92 |
| Exit only lanes per mile | 0.85 | 1.60 | 1.27 | 0.92 |
| Score | 380 | 370 | 465 | 415 |
| Overall score | 407.5 | |||
Information for site OR-2 is as follows:
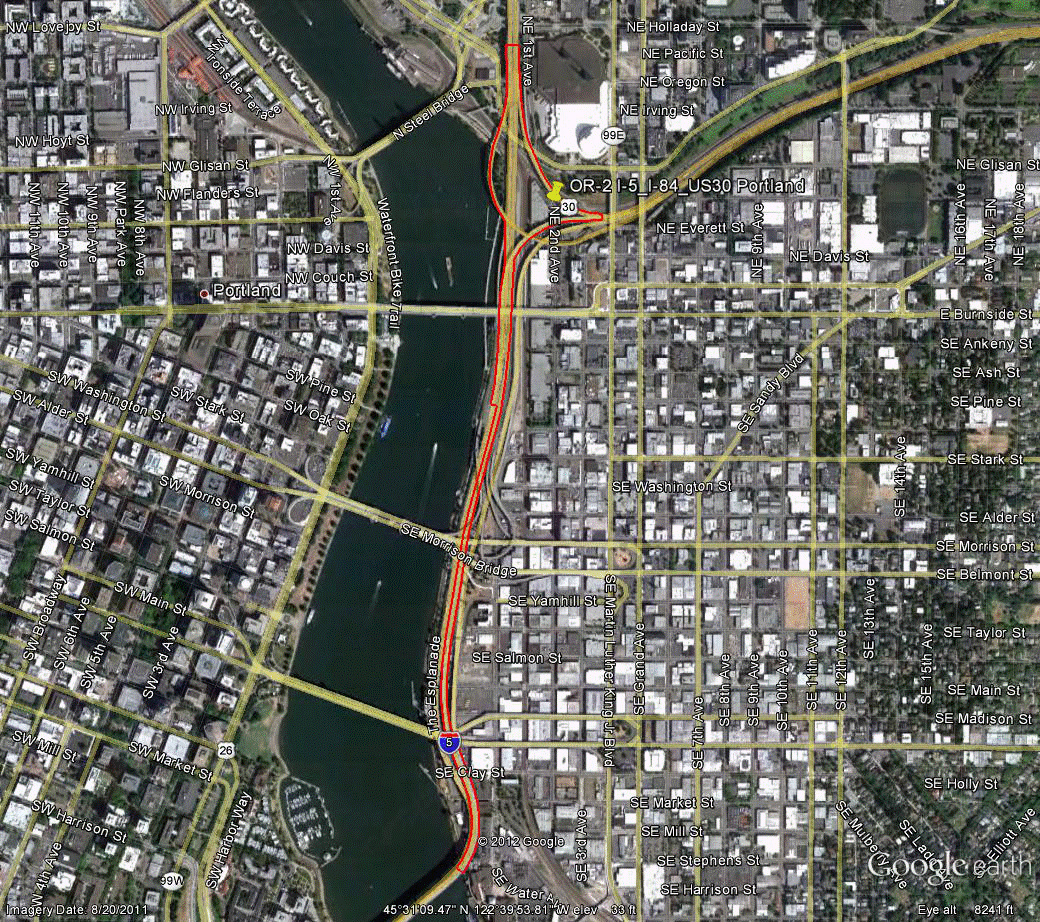
©2011 Google Earth®
Figure 101. Photo. Aerial view of site OR-2.(71)
| Variable | NB | SB | EB | WB |
|---|---|---|---|---|
| Study length (ft) | 1,275 | 9,715 | 0 | 5,885 |
| Number of concurrent routes | 1.333 | 1.333 | 0 | 2 |
| Number of levels | 3 | 3 | 0 | 3 |
| Number of missing movements | 0 | 0 | 0 | 0 |
| Number of ramps | 3 | 3 | 0 | 1 |
| Exit ramps per mile | 0.00 | 1.09 | 0 | 0.90 |
| Entrance ramps per mile | 4.14 | 0.54 | 0 | 0.00 |
| Left exits per mile | 0.00 | 0.00 | 0 | 0.00 |
| Left entrances per mile | 0.00 | 0.00 | 0 | 0.00 |
| Number of exit ramps with multiple destinations per mile | 0.00 | 0.54 | 0 | 0.00 |
| Multilane exit ramps per mile | 4.14 | 0.00 | 0 | 0.90 |
| Optional/shared exit lanes per mile | 4.14 | 0.54 | 0 | 0.90 |
| Exit only lanes per mile | 4.14 | 0.54 | 0 | 0.90 |
| Score | 395 | 325 | - | 295 |
| Overall score | 338.33 | |||
- Indicates no score was generated because the EB approach was not present.
Information for site SC-1 is as follows:
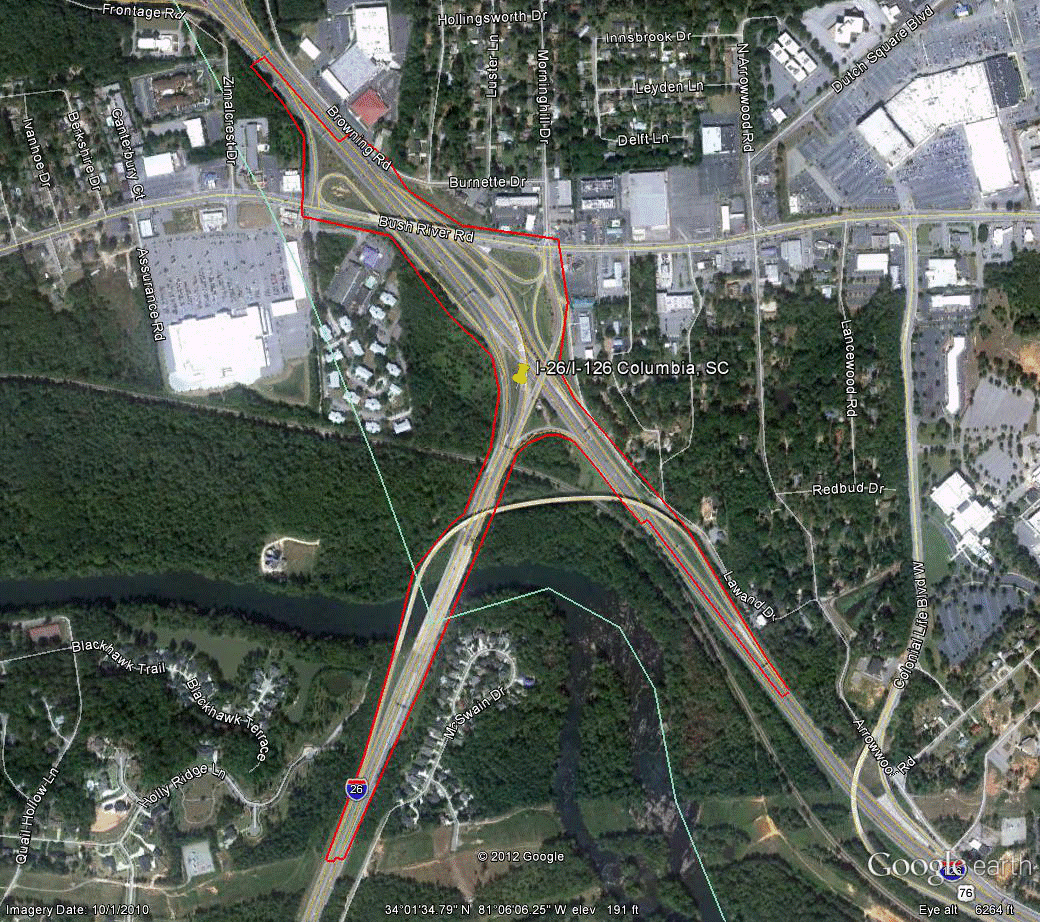
©2010 Google Earth®
Figure 102. Photo. Aerial view of site SC-1. (72)
| Variable | NB | SB | EB | WB |
|---|---|---|---|---|
| Study length (ft) | 7,355 | 8,930 | 10,115 | 4,750 |
| Number of concurrent routes | 2 | 2 | 1 | 1 |
| Number of levels | 2 | 2 | 2 | 2 |
| Number of missing movements | 0 | 0 | 0 | 0 |
| Number of ramps | 4 | 3 | 1 | 1 |
| Exit ramps per mile | 1.44 | 1.18 | 0.52 | 0.00 |
| Entrance ramps per mile | 1.44 | 0.59 | 0.00 | 1.11 |
| Left exits per mile | 0.00 | 0.00 | 0.00 | 0.00 |
| Left entrances per mile | 0.00 | 0.00 | 0.00 | 0.00 |
| Number of exit ramps with multiple destinations per mile | 0.00 | 0.00 | 0.52 | 0.00 |
| Multilane exit ramps per mile | 0.00 | 0.59 | 0.52 | 0.00 |
| Optional/shared exit lanes per mile | 0.00 | 0.59 | 0.00 | 0.00 |
| Exit only lanes per mile | 1.44 | 1.18 | 1.04 | 0.00 |
| Score | 345 | 315 | 240 | 50 |
| Overall score | 237.5 | |||
Information for site SC-2 is as follows:
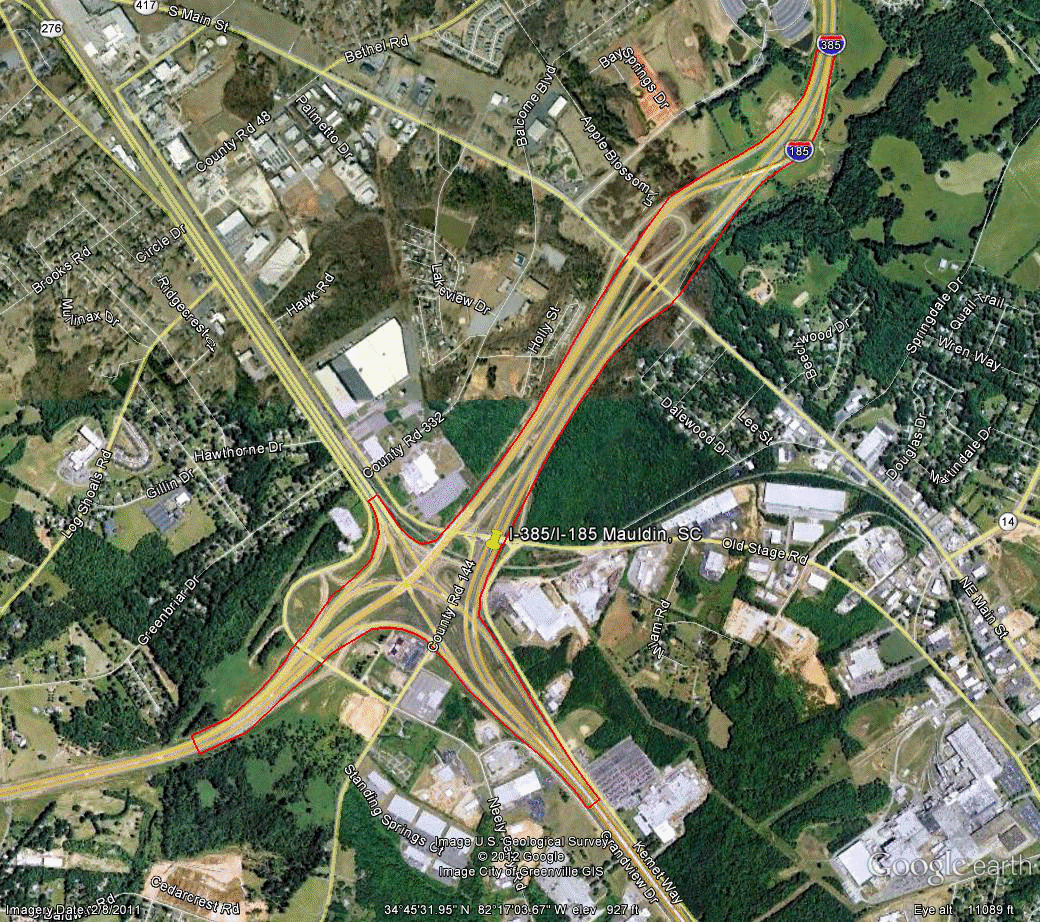
©2011 Google Earth®
Figure 103. Photo. Aerial view of site SC-2.(73)
| Variable | NB | SB | EB | WB |
|---|---|---|---|---|
| Study length (ft) | 22,720 | 16,200 | 16,055 | 14,460 |
| Number of concurrent routes | 1 | 1 | 1 | 1 |
| Number of levels | 3 | 3 | 3 | 3 |
| Number of missing movements | 1 | 1 | 0 | 0 |
| Number of ramps | 4 | 3 | 3 | 4 |
| Exit ramps per mile | 0.70 | 0.65 | 0.33 | 0.73 |
| Entrance ramps per mile | 0.23 | 0.33 | 0.66 | 0.73 |
| Left exits per mile | 0.00 | 0.00 | 0.00 | 0.00 |
| Left entrances per mile | 0.00 | 0.00 | 0.00 | 0.00 |
| Number of exit ramps with multiple destinations per mile | 0.00 | 0.65 | 0.33 | 0.37 |
| Multilane exit ramps per mile | 0.00 | 0.00 | 0.00 | 0.37 |
| Optional/shared exit lanes per mile | 0.46 | 0.33 | 0.00 | 0.37 |
| Exit only lanes per mile | 0.23 | 0.33 | 0.33 | 0.73 |
| Score | 260 | 255 | 200 | 370 |
| Overall score | 271.25 | |||
Information for site SC-3 is as follows:
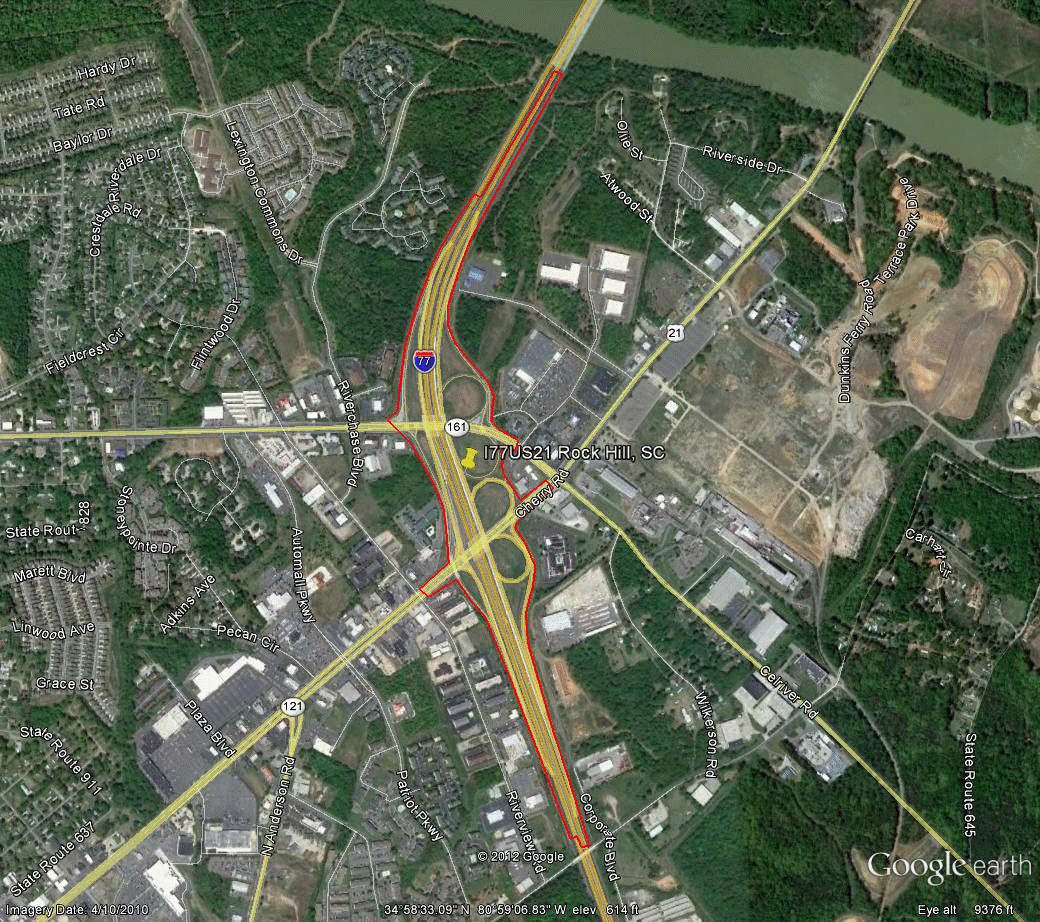
©2010 Google Earth®
Figure 104. Photo. Aerial view of site SC-3.(74)
| Variable | NB | SB | EB | WB |
|---|---|---|---|---|
| Study length (ft) | 20,390 | 19,460 | 0 | 0 |
| Number of concurrent routes | 1 | 1 | 0 | 0 |
| Number of levels | 2 | 2 | 0 | 0 |
| Number of missing movements | 0 | 0 | 0 | 0 |
| Number of ramps | 2 | 2 | 0 | 0 |
| Exit ramps per mile | 0.26 | 0.27 | 0 | 0 |
| Entrance ramps per mile | 0.26 | 0.27 | 0 | 0 |
| Left exits per mile | 0.00 | 0.00 | 0 | 0 |
| Left entrances per mile | 0.00 | 0.00 | 0 | 0 |
| Number of exit ramps with multiple destinations per mile | 0.26 | 0.27 | 0 | 0 |
| Multilane exit ramps per mile | 0.00 | 0.27 | 0 | 0 |
| Optional/shared exit lanes per mile | 0.26 | 0.27 | 0 | 0 |
| Exit only lanes per mile | 0.00 | 0.27 | 0 | 0 |
| Score | 115 | 270 | - | - |
| Overall score | 192.5 | |||
- Indicates no score was generated because EB and WB approaches were not present.
Information for site VA-1 is as follows:
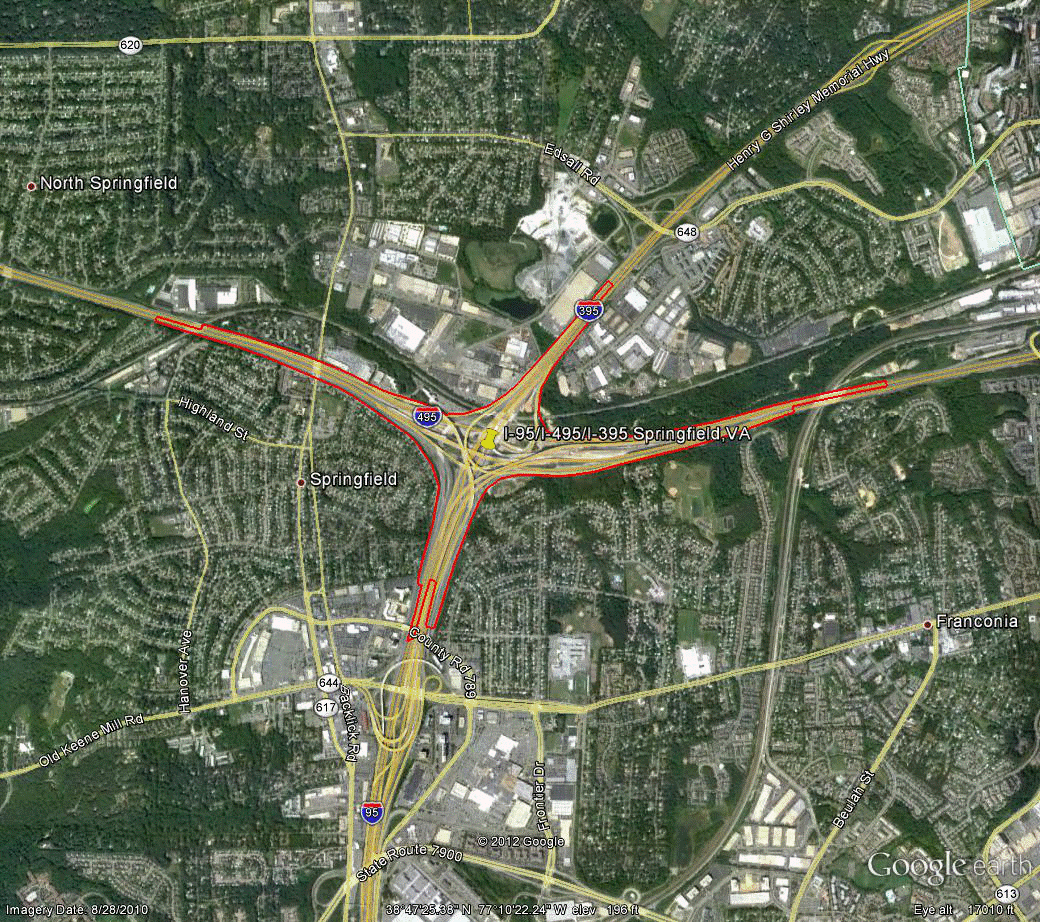
©2010 Google Earth®
Figure 105. Photo. Aerial view of site VA-1. (75)
| Variable | NB | SB | EB | WB |
|---|---|---|---|---|
| Study length (ft) | 8,850 | 11,130 | 22,230 | 21,005 |
| Number of concurrent routes | 1 | 1 | 1.5 | 1.25 |
| Number of levels | 4 | 4 | 4 | 4 |
| Number of missing movements | 0 | 0 | 0 | 0 |
| Number of ramps | 3 | 4 | 4 | 4 |
| Exit ramps per mile | 0.60 | 0.95 | 0.48 | 0.75 |
| Entrance ramps per mile | 1.19 | 0.95 | 0.48 | 0.25 |
| Left exits per mile | 0.00 | 0.00 | 0.00 | 0.25 |
| Left entrances per mile | 0.00 | 0.47 | 0.24 | 0.00 |
| Number of exit ramps with multiple destinations per mile | 0.00 | 0.95 | 0.24 | 0.25 |
| Multilane exit ramps per mile | 0.60 | 0.95 | 0.48 | 0.25 |
| Optional/shared exit lanes per mile | 0.00 | 0.95 | 0.24 | 0.00 |
| Exit only lanes per mile | 1.19 | 1.42 | 0.95 | 1.01 |
| Score | 340 | 470 | 330 | 325 |
| Overall score | 366.25 | |||
Information for site VA-2 is as follows:
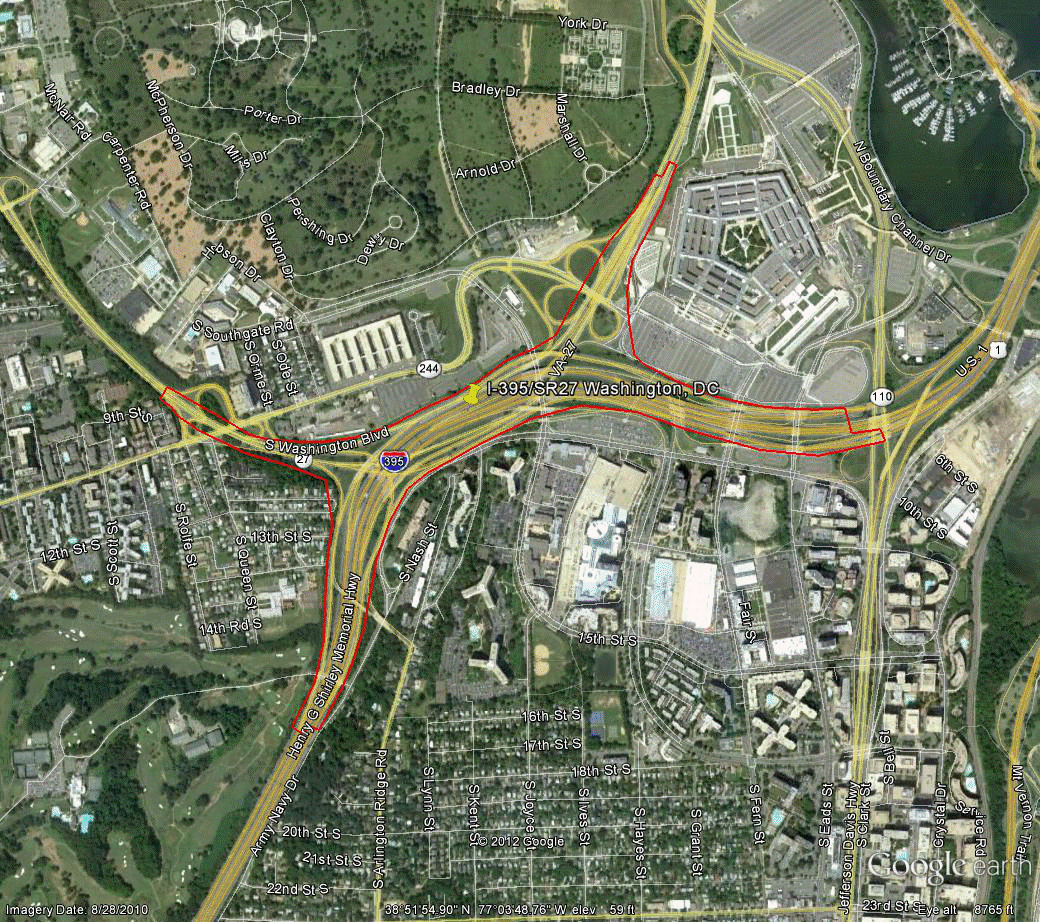
©2010 Google Earth®
Figure 106. Photo. Aerial view of site VA-2.
(76)
| Variable | NB | SB | EB | WB |
|---|---|---|---|---|
| Study length (ft) | 11,920 | 11,560 | 11,070 | 8,420 |
| Number of concurrent routes | 1 | 1 | 1 | 1.2 |
| Number of levels | 2 | 2 | 2 | 2 |
| Number of missing movements | 0 | 1 | 0 | 1 |
| Number of ramps | 6 | 5 | 10 | 12 |
| Exit ramps per mile | 1.77 | 0.46 | 1.91 | 2.51 |
| Entrance ramps per mile | 0.89 | 1.83 | 2.86 | 1.88 |
| Left exits per mile | 0.44 | 0.00 | 0.00 | 1.25 |
| Left entrances per mile | 0.00 | 0.46 | 0.48 | 0.00 |
| Number of exit ramps with multiple destinations per mile | 0.44 | 0.46 | 1.43 | 0.63 |
| Multilane exit ramps per mile | 0.00 | 0.00 | 0.95 | 0.63 |
| Optional/shared exit lanes per mile | 0.00 | 0.00 | 0.95 | 0.63 |
| Exit only lanes per mile | 1.77 | 0.46 | 1.91 | 3.14 |
| Score | 460 | 385 | 750 | 790 |
| Overall score | 596.25 | |||
Information for site VA-3 is as follows:
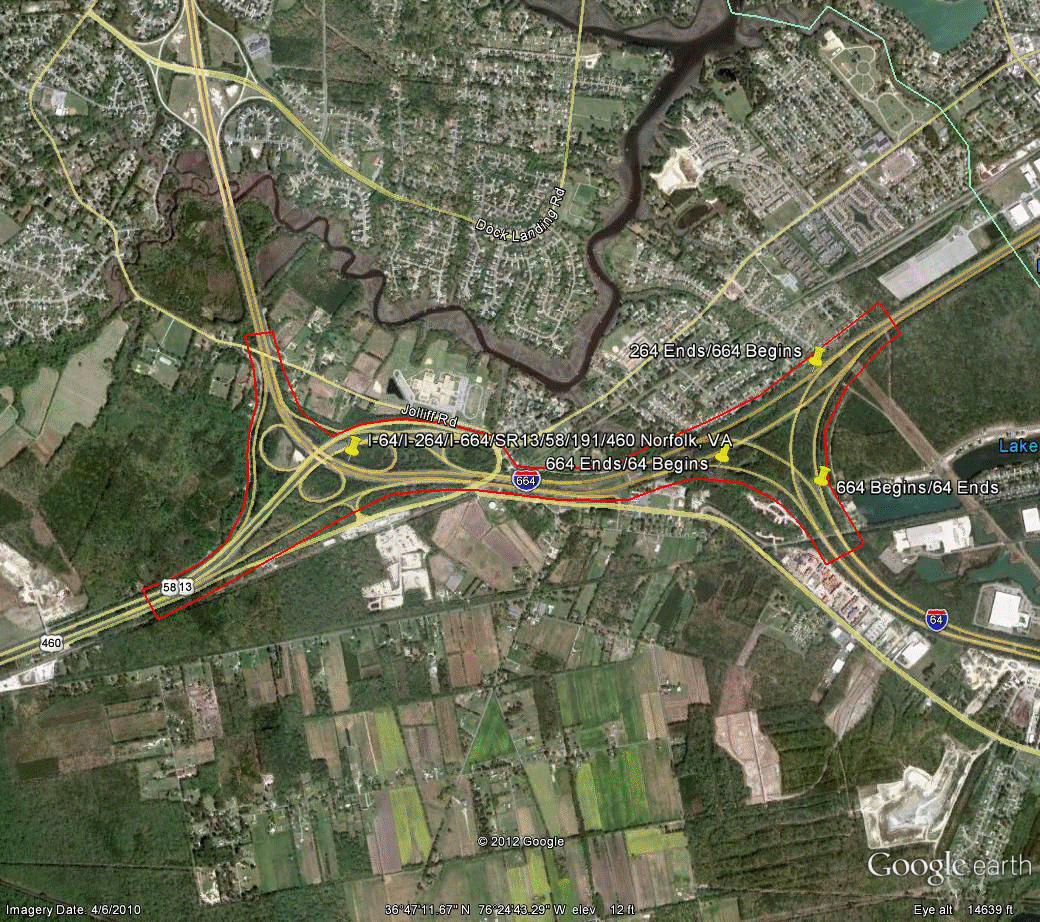
©2010 Google Earth®
Figure 107. Photo. Aerial view of site VA-3.(77)
| Variable | NB | SB | EB | WB |
|---|---|---|---|---|
| Study length (ft) | 23,105 | 19,080 | 8,165 | 10,960 |
| Number of concurrent routes | 1 | 1.143 | 2 | 1 |
| Number of levels | 2 | 2 | 2 | 2 |
| Number of missing movements | 0 | 0 | 0 | 0 |
| Number of ramps | 5 | 7 | 4 | 2 |
| Exit ramps per mile | 0.46 | 1.11 | 1.29 | 0.48 |
| Entrance ramps per mile | 0.69 | 0.55 | 1.29 | 0.48 |
| Left exits per mile | 0.00 | 0.00 | 0.00 | 0.48 |
| Left entrances per mile | 0.23 | 0.00 | 0.00 | 0.00 |
| Number of exit ramps with multiple destinations per mile | 0.00 | 0.00 | 0.00 | 0.00 |
| Multilane exit ramps per mile | 0.23 | 0.28 | 0.65 | 0.00 |
| Optional/shared exit lanes per mile | 0.00 | 0.00 | 0.00 | 0.00 |
| Exit only lanes per mile | 0.91 | 1.38 | 1.94 | 0.48 |
| Score | 330 | 415 | 345 | 210 |
| Overall score | 325 | |||
The research reported herein was performed for FHWA by TTI. The authors wish to acknowledge the individuals who contributed to this research by participating in the simulation surveys, assisting with field study site selection, and serving as technical experts by providing feedback on which characteristics should be included in the spreadsheet tool.
The authors also wish to acknowledge those within TTI who assisted with the literature review and helped with data collection and reduction for either the simulator study or the decision tool. Those individuals include the following: