Development of Human Factors Guidelines for Advanced Traveler Information Systems and Commercial Vehicle Operations: The Effects of Inaccurate Traffic Information on Driver Behavior and Acceptance of an Advanced In-Vehicle Traveler Information System
CHAPTER 2. METHOD
Subjects
Apparatus
Experimental Design
Procedure
SUBJECTS
Subjects were 24 males and 24 females, ranging from 18 to 35 years of age, recruited from the University of Washington and the surrounding community. Each was paid $5.00 per hour, plus a cash bonus. Prospective participants were administered a screening questionnaire by telephone to ensure that all had a driver's license, were familiar with driving in the Seattle area, and drove at least twice per week. To determine subjects' driving experience, data were collected on the following: years lived in Seattle (mean = 10.8), years driven in Seattle (mean = 4.8), total miles driven annually (mean = 9,219).
Top
APPARATUS
Driver behavior was investigated using the RGS which consisted of two linked Intel 486 computer systems and two video displays (see figure 1). One monitor provided drivers with a real-time windshield view of the traffic scene from the driver's perspective. Additional information displayed on this monitor below the windshield included: (1) speed of the vehicle, (2) queried information (both written on the video screen and "spoken" by a DecTalk system), (3) other traffic information (always extraneous to the chosen route), (4) current time, (5) goal time, (6) bonus amount, and (7) current location (street location written on the screen). The second computer, equipped with a touch screen input device, displayed a computer-generated map of the traffic network. A moving dot indicated the current location of the simulated vehicle. Drivers used the touch screen to select route options from the displayed map and to query the system about the traffic congestion on any route segment ("link"). System queries for traffic congestion information could be done at any time and querying a link was required prior to traversing it. When a link was chosen, the appropriate video was displayed in real time on the first monitor.
Videotaped traffic scenes of the various routes from Westlake Center in downtown Seattle to Bellevue Square Mall were used for Seattle, the familiar network. The unfamiliar network, "New City," was created by combining video clips of streets and highways throughout Northwest Washington. The "New City" map was rotated 90 degrees in relation to the Seattle map. All video clips were digitized and stored on hard disk. The traffic network structures for both familiar and unfamiliar cities were identical (i.e., 31 links were used for each scenario, with each link varying in length from one to several streets). Thus, the topography was identical for both familiar and unfamiliar networks (see figures 2 and 3). Thirty-three different routes were possible on a variety of roads, including congested city streets, four-lane State roads, and Interstates in an urban setting. Completing a route required traversing seven links, regardless of the path chosen. The present methodology is an improvement over previous research (Kantowitz et al., 1994) where inaccurate information was path dependent on a trial by trial basis and hence not directly controlled by the experimenter. In this experiment, information accuracy was controlled independent of the path selected.
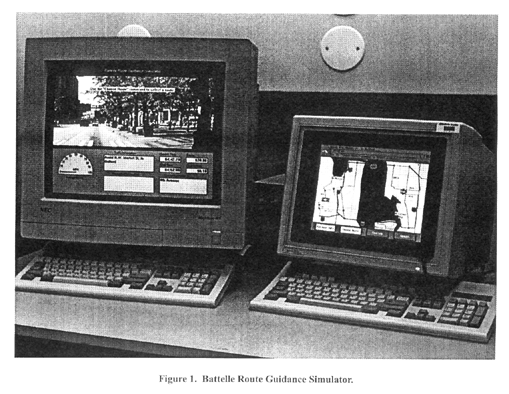
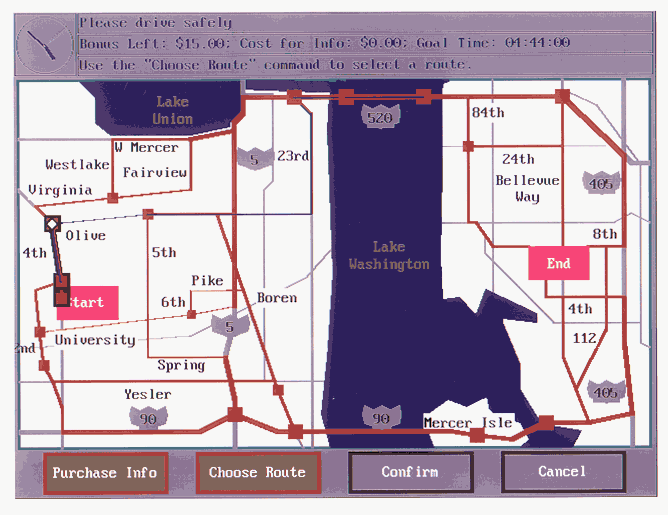
Figure 2a. Topography of familiar network
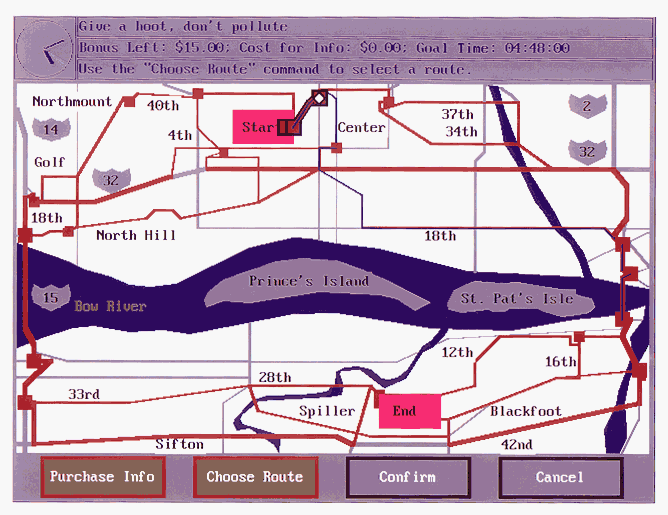
Figure 2b. Topography of unfamiliar network
Although most of the links had "light" traffic, several had "heavy" traffic as defined in terms of level–of–service (Transportation Research Board, 1992). Light traffic, Level–of–Service A, represents a free flow of traffic where individual drivers are unaffected by others present in the traffic stream. Heavy traffic is defined as Level–of–Service E or Level–of–Service F. Level–of–Service E occurs when operating conditions are at or near capacity level and all speeds are reduced to a low, relatively uniform value, and Level–of–Service F occurs when operations within a traffic queue are characterized by unstable stop–and–go traffic.
Top
EXPERIMENTAL DESIGN
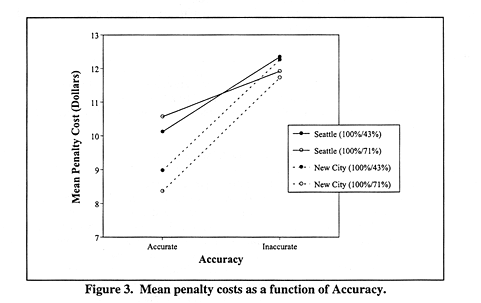
A balanced design was used with Order as a between–subjects variable. All subjects experienced four trials with information always being 100 percent accurate for the first two trials and inaccurate (either both trials 71 percent or both 43 percent) for Trials 3 and 4. Half of the subjects were tested on Order 1 (Seattle [F]–New City [U]–U–F) and half on Order 2 (U–F–F–U).
The two independent variables of major interest were traffic network familiarity and information accuracy. Network familiarity, a within–subject variable, had two levels: (1) Familiar (Seattle), and (2) Unfamiliar (New City). Information accuracy, a between–subjects variable, also had two levels: (1) 71 percent accurate, and (2) 43 percent accurate. In addition, all subjects experienced 100 percent accurate information for the first two simulated trips. Inaccurate information was either harmful, (e.g., traffic on link reported to be light, but was actually heavy) or harmless, (e.g., traffic was reported to be heavy, but was actually light). Table 1 shows the ordinal position of links for which inaccurate information was presented.
Table 1. Distribution of inaccurate link information for Trials 3 and 4.
| Link Ordinal Position |
Information Accuracy |
| |
71% |
43% |
| 1 |
|
|
| 2 |
* |
* |
| 3 |
|
|
| 4 |
|
* |
| 5 |
|
* |
| 6 |
* |
* |
| 7 |
|
|
* Inaccurate Information Given
Top
PROCEDURES
Drivers had an opportunity to practice using the simulator to become familiar with its operation, after which they began the first of the four trials. Prior to each trial, drivers marked on a paper map the route that they would normally take in the familiar city and the route they thought they might take in the unfamiliar city. Outlining their preferred route served to both orient the drivers to the traffic network and acted as a baseline for measuring convergence: the extent to which drivers followed their baseline route.
The driver's goal was to reach the destination as quickly as possible by choosing links with the least amount of traffic and shortest travel time. This combination of links represented the optimal route. Drivers began each of the four trials with a $15.00 potential "bonus." The bonus provided an incentive for drivers to use the ATIS. A penalty cost ranging from $.05 to $2.14 was assessed for each non–optimal link selected. This penalty cost was proportional to the time lost relative to the optimal path. An additional penalty cost equaling half of the remaining bonus was assessed for each heavy–traffic link encountered. Deductions from the bonus served to simulate the negative consequences associated with deviations from the optimal route and hitting heavy traffic.
To complete a route from origin to destination, drivers traversed seven links. Prior to traversing a link, drivers were required to query the ATIS for traffic congestion information for that link. The system would not allow drivers to traverse a link until congestion information pertaining to that link had been obtained. Drivers were not required to obtain a link's congestion information immediately preceding that link's selection. Rather, this information could be obtained at any time during the route as long as it was prior to traversing that link. Drivers were allowed to query the system for congestion information at any point during the route, and as often as desired. Unlike previous research (Kantowitz, et al., 1994), traffic information was provided without any monetary cost.
Drivers made their way from origin to destination by querying the system for traffic congestion information, selecting links, and watching the driving scene. In selecting links, drivers were not allowed to choose more than one link in advance of their current link. For example, drivers currently on the second link could select the third link, but not the fourth link. Link four could not be selected until the driver had completely traversed link two and had begun to traverse link three. It was believed that drivers would be more apt to recall the traffic congestion information pertaining to a given link if the time between obtaining the information and traversing the link was minimized. This aspect is important since questions pertaining to system trust, self–confidence, and expectations were given at the end of each link. Drivers responded to these questions by recalling the system's traffic congestion information for a link and comparing it to the traffic conditions they saw while traversing that link.
To help prevent unintentional link selections, drivers were required to confirm each link choice. A confirm button, located on the touch–screen, was pushed after a driver was satisfied with a link selection. Once a link had been selected and confirmed, the driver could not change his/her decision.
Subjective data were collected by questionnaires, administered prior to, and during, the course of the experiment. Prior to the experiment, individuals interested in participating were given a series of questions over the telephone to determine their eligibility. Only prospective participants who met the following criteria were allowed to participate: (1) had a valid driver's license, (2) were familiar with driving in Seattle, (3) drove at least once per week, and (4) had not driven in Calgary, Canada. The reason for the fourth criteria, had not driven in Calgary, was that the traffic network of the unfamiliar city was similar to that in Calgary. Suitable participants who met the four eligibility criteria were given a second telephone questionnaire to determine their driver demographic characteristics. Examples of the content of these questions included: (1) years lived in Seattle, (2) years driven in Seattle, and (3) number of miles driven annually.
During the course of the route, drivers were given brief inter–link questionnaires that consisted of four questions. These questions pertained to (1) trust, (2) self–confidence, and (3) traffic expectations when using the ATIS, and (4) estimated travel time. The three questions that pertained to trust, self–confidence, and traffic expectations were presented on scales ranging from 0 (Does Not Apply) to 100 (Strongly Applies). Drivers responded to the question about travel time by providing an estimate in minutes and seconds. The set of four questions was given to drivers upon completion of each link. In other words, questionnaires were administered between links (i.e., "inter–link"). Though not recorded, the time to complete a questionnaire was typically less than 10 seconds. Since there were seven links from origin to destination, and drivers had four trips, each driver answered a total of 28 inter–link questionnaires.
Top
FHWA-RD-96-145
|


