U.S. Department of Transportation
Federal Highway Administration
1200 New Jersey Avenue, SE
Washington, DC 20590
202-366-4000
Federal Highway Administration Research and Technology
Coordinating, Developing, and Delivering Highway Transportation Innovations
 |
| This report is an archived publication and may contain dated technical, contact, and link information |
|
Publication Number: FHWA-HRT-04-145
Date: December 2005 |
|||||||||||||||||||||||||||||||||||||||||||||||||||||||||||||||||||||||||||||||||||||||||||||||||||||||||||||||||||||||||||||||||||||||||||||||||||||||||||||||||||||||||||||||||||||||||||||||||||||||||||||||||||||||||||||||||||||||||||||||||||||||||||||||||||||||||||||||||||||||||||||||||||||||||||||||||||||||||||||||||
Enhanced Night Visibility Series, Volume XIV: Phase III—Study 2: Comparison of Near Infrared, Far Infrared, and Halogen Headlamps on Object Detection in Nighttime RainPDF Version (929 KB)
PDF files can be viewed with the Acrobat® Reader® CHAPTER 2—METHODSPARTICIPANTSThirty drivers participated in this study. Participants were divided into three different age groups. The first age group (young) comprised 10 drivers between 18 and 25 years old with an average age of 22. The second group (middle aged) comprised 10 drivers between 40 and 50 years old with an average age of 43. Finally, the third group (older) comprised 10 drivers 65 years or older with an average age of 69. Each age group was equally divided into five males and five females. Candidates were screened before being accepted as participants to ensure that they met all the specific requirements listed in the screening questionnaire All participants were informed that they were free to withdraw from the study at any time for any reason without penalty. All data and personal information collected during the study were treated with anonymity. Participants received payment of 20 dollars per hour for his or her participation. EXPERIMENTAL DESIGNA 5 (VES) by 3 (Age) by 2 (Driver Light Adaptation Level) by 2 (Pedestrian Location) mixed-factor design was used. The five VESs varied in intensity and beam distribution. The three age groups were young, middle, and older. The two different driver light adaptation levels were defined as “low” and “high.” There were two different pedestrian locations: one pedestrian stood just inside the right edgeline of the driving lane, and the other stood on the left side of the driving lane near the centerline. These four variables are discussed in the Independent Variables section. The details of all the factors appear in table 1 and table 2. The between-subjects factor was age. The within-subjects factors were VES, driver light adaptation level, and pedestrian location. The data collection portion of the study included 10 different combinations of driver adaptation levels and VESs. Following is a list of the oncoming VESs and driver adaptation levels:
The presentation order of the VESs and pedestrian locations were counterbalanced to mitigate order effects. The driver light adaptation level was counterbalanced so that half of the participants began with low adaptation levels, and the other half began with high adaptation levels. INDEPENDENT VARIABLESVESThe VESs considered for use in this study were categorized in terms of beam intensity and width based on an analysis of available isocandela diagrams. A comparison across designs was made by measuring the beam width. This width was determined by finding the angle to the left and to the right of the headlamp center where the beam intensity fell to 12,000 cd. The sum of these angles represents the angular beam width, which is shown in table 3. The 12,000-cd intensity was selected because it was approximately equal to half the maximum intensity value of the headlamp with the lowest peak intensity (25,978 cd), and it was felt that this value was also a good representation of the luminous intensity directed to the left and right edgelines of the roadway in the forward view. The available VESs were divided into three subcategories (narrow, medium, and wide) by the measured beam widths.
The group of VESs that was selected for this study represented the extremes and midpoints for beam width and luminous intensity. These combinations of width and intensity are listed in table 4. The one halogen VES represented the low intensity and narrow beam width parameters. The rest of the VESs in the other combinations of beam characteristics were HID designs. Detailed information on each selected VES can be found in appendix G and ENV Volume XVII.
Age GroupsFor this experiment, the age factor had three levels, which were created based on literature-review findings (ENV Volume II) that suggest changes in vision during certain ages. (See references 17, 18, 19, 20, and 21.) The age groups were young (18 to 25 years old), middle (40 to 50 years old), and older (65 years and above). Ten participants from each age group, five males and five females, were involved in this study. This is the same representation of age and gender used in the majority of studies in the ENV project. Pedestrian LocationVehicle crashes involving pedestrians are a major concern for the field of transportation safety. The physical characteristics of a human being are difficult to replicate; therefore, it was preferable to use real pedestrians in research involving detection of onroad pedestrians. Research has been done involving glare using varying types of pedestrian clothing including black, gray, white, denim, and khaki.(22) The reflectance and color characteristics of the clothing are important factors to consider when dealing with different VESs. Because of the short detection distances and difficulty with glare, the pedestrians were dressed in white clothing for this study. White clothing is higher in reflectance and, in this particular onroad environment, was easier to detect than other colors. This result was shown in previous ENV research conducted in the same onroad environment (e.g., ENV Volume III). The locations of pedestrians in the roadway significantly affect their visibility in the presence of glare relative to the driver. A pedestrian located on the centerline of the road is in a location where the glare from oncoming headlamps is substantially greater for the driver.(17) On the other hand, a pedestrian located on the right edgeline of the roadway is farther away from the glare source in the lateral direction. These two locations were used in this study to further investigate these differences (table 5). Both locations were 15.2 m (50 ft) behind the glare headlamps. This distance was determined to be a safe stopping distance at the driving speed of 32 km/h (20 mi/h). All pedestrians stood facing the oncoming vehicle. It was important that pedestrians did not cover the road markings because this may have affected detection distances due to the sharp change in contrast. Each participant was instructed to drive on the roadway and verbally inform the experimenter immediately when he or she detected a pedestrian.
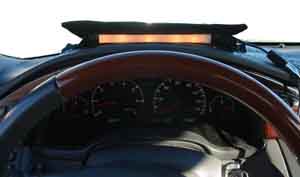
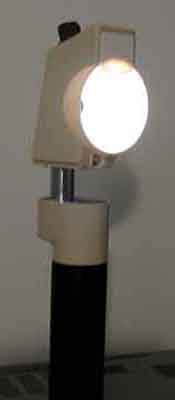
Driver Light Adaptation LevelTo establish a range of possible illuminance values for the independent variable of driver light adaptation level, an in-vehicle evaluation of illuminance readings at the driver’s eye level in different road and traffic conditions was performed. These measurements were made by mounting an illuminance meter in a vehicle at the driver’s eye height. The values were measured while driving on an unlit highway and a highway with overhead lighting. The results are illustrated in figure 2. The low ambient light conditions in the left half of the graph are from the unlit highway, and the conditions in the right half are from the highway with overhead lighting. Some of the spikes represent oncoming glare from approaching vehicles. These onroad measurements were considered along with previous methods in similar studies involving glare and object detection to establish the two experimental values of driver light adaptation.(23) These two levels, kept in the mesopic range, were set at a low value of 0.15 lx and a high value of 0.45 lx. The driver light adaptation level was switched between the two by using a dimmable, narrow band of diffuse lighting located across the top of the vehicle’s instrumentation panel (figure 3). These levels were checked with an illuminance meter in the vehicle at the driver’s eye. The dimming range was controlled to avoid chromatic shifts in the light source. The driver had sufficient time to become adapted to each level, and measures were taken to prevent any unwanted variations as the study proceeded. Figure 2. Line graph. Illuminance readings taken on a divided highway at night with and without DEPENDENT VARIABLESThe dependent variables gathered were detection distance (m (ft)), driver illumination level (lx), and the deBoer scale rating of discomfort glare. Distance and driver illuminance data were collected at 10 hertz by the in-vehicle instrumentation package. Detection DistanceDetection distances are important when determining nighttime visibility.(24) Detection distances were collected during the disability glare portion of the study. The participant was instructed to verbally inform the experimenter immediately when he or she could detect a pedestrian. The in-vehicle experimenter flagged the data each time the participant detected a pedestrian. As the vehicle passed the pedestrian’s location on the road, the in-vehicle experimenter pressed a separate button to flag the actual location of the pedestrian. These flagged points were used to calculate the detection distance. All experimental trials were videotaped with an audio track, providing a means of data verification by way of post hoc video analysis. Illuminance MeasurementsIn addition to tracking detection distances, the computer program also collected a series of illuminance measurements. An illuminance meter was placed in the vehicle in a position that represented the height of the participants’ eye. Illuminance readings (in lux) were then gathered every tenth of a second so that the approximate illuminance reaching the eye at the moments of detection as well as during the discomfort ratings could be determined. This allowed the analysis to account for certain variables such as lane positions (i.e., angle of glare) and ambient lighting conditions. This method also gave a baseline ambient illuminance reading so that changes in adaptation levels could be tracked. Discomfort Glare RatingsSubjective ratings were collected during the discomfort glare portion of the study. As the participant approached the VESs, he or she was asked to evaluate the discomfort experienced from the headlamps. After passing the VES, the in-vehicle experimenter asked the participant to stop the vehicle and rate the overall discomfort experienced from the glare by using the deBoer scale. The scale and its anchors were reviewed with the participant before each trial to ensure accurate rating. The participant’s discomfort glare rating was an overall rating from the starting point at 305 m (1,000 ft) away and continuing up to the VES. IN-VEHICLE AND ONROAD SAFETYThis research involved participants driving vehicles on a closed roadway with real pedestrians in induced glare situations; therefore, many measures were taken to ensure the safety of all those involved, including: (1) all data collection equipment, both electrical and mechanical, were installed in a manner such that it would not, to the fullest extent possible, create a hazardous situation in any instance; (2) participants and in-vehicle experimenters were required at all times to wear the vehicle seatbelts; (3) the data collection equipment did not interfere with the normal field of view of the participant; (4) a trained in-vehicle experimenter had to be in the vehicle at all times to guide the participant and answer questions; (5) onroad experimenters (pedestrians and other workers) knew when to clear the road when a vehicle approached even if the radio communication failed; and (6) a list of emergency procedures was developed and reviewed before testing. APPARATUS AND MATERIALSBrightness Acuity TesterThe Brightness Acuity Tester™ (BAT) was used to evaluate participants’ susceptibility to glare. The BAT is a handheld eye occluder with a domed aperture, pictured in figure 4. This device provides three levels of ambient luminance: 41.2 cd/m² (12 fL), 343 cd/m² (100 fL), and 1,372 cd/m² (400 fL), producing low, medium, and high levels of glare, respectively. It can also be used while turned off to permit a baseline measurement of visual acuity. The test involved the participant looking at the Snellen acuity chart with one eye through the BAT set sequentially for all four veiling luminance (glare) lighting conditions (off, low, medium, and high). Data for each eye was recorded, and the change from the baseline (off) to the different glare settings was noted. Participants who had a significant change as the luminance level was increased were more sensitive to glare. The typical Snellen acuity results of a participant with normal glare sensitivity can be seen in table 6. The results changed for mildly sensitive participants (table 7). A participant with severe light sensitivity had results typical to table 8. This test is important because two individuals with the same visual acuity and contrast sensitivity may have different sensitivities to glare.
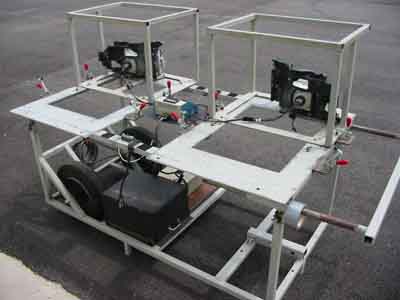
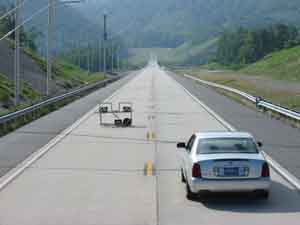
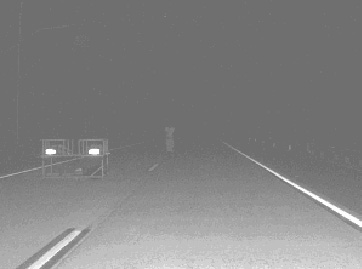
Test VehicleThe driving portion of the study took place in a full-sized sedan with factory-installed halogen headlamps. The sedan was equipped with sensors that determined speed, eye-level illuminance, and distance traveled. These sensors fed into a laptop computer located in the back seat with the in-vehicle experimenter. This computer was equipped with a software program developed specifically for this data collection. The software allowed the experimenter to collect distances, illuminance readings, and keep track of orders as well as other information pertaining to the participant. A narrow band of diffuse lighting was installed on the dashboard across the top of the instrumentation panel. Experimenters used a dimmer switch to change the driver light adaptation level between the low and high settings. VESsThe different VESs were positioned on the road using special headlamp mounting carts. This cart, as seen in figure 5, was designed to position the headlamps at the same height and width of a real vehicle. The daylight photo in figure 6 shows the headlamp cart and experimental vehicle. The nighttime photo in figure 7 shows the cart as seen from the experimental vehicle. The headlamps were positioned at a height of 83.8 cm (33 inches) from the center point of the headlamp to the road surface, which is comparable to the mounting height on a standard SUV. The headlamps were laterally separated by 109.2 cm (43 inches). The advantages of using the carts rather than real vehicles were that they were lightweight and easier to maneuver, they could be more accurately and reliably aimed in a fixed position along the roadway, and they did not represent as much of a safety hazard as an entire vehicle in the oncoming lane of traffic would. The headlamps were powered at 12.8 V with the use of an electrical inverter for consistent performance. The headlamps were aimed according to the manufacturer’s specifications and checked before each experimental session. The aiming methods and protocol can be seen in appendix F. To avoid exposing participants to the tested VESs during the practice portion of the study, a pickup truck equipped with standard halogen headlamps was used instead of the glare cart. Smart Road Testing FacilityThe driving portion of the study took place on the Virginia Smart Road. The study used only one specific station on a concrete section rather than on asphalt to present VESs and pedestrians. This was done to ensure that the contrast of the objects in relation to the roadway was kept consistent for all experimental trials. The Smart Road is a test-only facility that is closed to the general public; no vehicles other than the experimental vehicle were on the roadway. No overhead lighting was in use. The facility was monitored by the Smart Road control tower, and the dispatcher in the control tower could assist the experimenters if needed. Before the experimental vehicle entered the road, an experimenter had to establish radio contact with the dispatcher. Radios were used to communicate with other onroad experimenters and the control tower. To avoid disturbing the participant or the data collection process, the in-vehicle experimenter wore a headset inside the vehicle. EXPERIMENTAL PROCEDURECandidates for the experiment were screened by telephone using a participant screening questionnaire (appendix A). Candidates who met the eligibility criteria were then scheduled to participate in the study. A single driver was scheduled for each data collection session. An experimenter met each participant when he or she arrived at the testing facility. The participant was given a brief overview of the study and a description of the night’s activities. The experimenter verified that the participant had a valid driver’s license and then provided the participant with an informed consent form (appendix B) to read and sign before continuing. After all questions were answered and the form was signed, the experimenter administered a series of informal vision tests. These tests included the Snellen eye chart, contrast sensitivity test, brightness acuity test, and a color vision test (appendix C). Results from the vision tests were recorded, but participants were not excluded based on the results. The participant was then given a predrive questionnaire (appendix H) to gather information about nighttime driving habits. After the preliminary information was gathered, the participant was instructed on the experimental tasks. Training ProceduresThe experimenter explained the detection task and explained that the participant should verbally alert the experimenter at the moment he or she detected the pedestrian on the road. The deBoer scale was also reviewed with the participant, and the participant had a chance to ask the experimenter questions or express concerns. The purpose of this predrive overview was for the participant to understand the basic procedures of the experiment and what was expected of him or her during the study. When there were no more questions or concerns, the participant was familiarized with the experimental vehicle. Vehicle FamiliarizationThe participant was shown to the experimental vehicle by the in-vehicle experimenter. The experimenter demonstrated how to correctly adjust the seat and seatback, the steering wheel position, and the side and rearview mirrors. The experimenter also gave instructions on the operation of the headlamps and climate control system if needed. It was important to ensure that all adjustments were made so that the driver was in a normal, comfortable position. Then the experimenter took eye height measurements of the participant as described in the in-vehicle experimental protocol (appendix D). After all questions and concerns were addressed, the participant began the driving portion of the study. Driving InstructionsThe participant was informed that while on the test section of roadway, which was indicated by the in-vehicle experimenter, the speed limit was 32 km/h (20 mi/h) for the safety of the onroad experimenters. To make the task of staying at 32 km/h (20 mi/h) less difficult, the participant was instructed to use second gear in the vehicle’s automatic transmission. The driver was permitted to lower the speed if he or she desired to do so in any situation during testing. The participant was also told to drive in the right-hand lane during the study. In-Vehicle Test SequenceEach participant completed a practice lap before beginning data collection for the discomfort glare portion of the study. Then the participant was exposed to each VES under a predetermined driver light adaptation level. After each run, the participant stopped the vehicle, and the in-vehicle experimenter collected the subjective discomfort glare data. After the participant evaluated the discomfort glare of all VESs, and while remaining under the same driver light adaptation level, the experimenter guided the participant through another practice lap before beginning the data collection for the disability glare evaluation. The participant was then exposed to all the VESs and object combinations to examine disability glare under the given driver light adaptation level. When this was complete, the driver light adaptation level was changed, and the participant was guided through another session of the discomfort glare protocol followed by the disability glare protocol under this second level of driver light adaptation. Discomfort Glare Practice LapThe first lap on the Smart Road was considered a practice lap. Participants were given these two runs, one up the road and one down the road, to become familiar with the road, the test vehicle, and the experimental procedures for the discomfort glare portion of the study. During the practice session, a pickup truck equipped with standard halogen headlamps was used rather than the glare cart. The participant was asked to evaluate the glare from the truck’s high and low beams. During these practice runs, the in-vehicle experimenter guided the participant through the driving procedures and subjective ratings. Discomfort Glare Data CollectionThe discomfort glare subjective ratings were gathered for each combination of driver adaptation level and VES. The primary task of the participant was to safely drive the vehicle at or below the set speed of 32 km/h (20 mi/h). The in-vehicle experimenter was in the back right seat of the vehicle. Appendix D contains a detailed explanation of the in-vehicle experimenter’s role. In addition to the in-vehicle experimenter, the testing process included four onroad experimenters. Appendix E explains the responsibilities of the onroad experimenters. During data collection for the discomfort glare study, onroad experimenters set up the glare cart in the opposite lane, facing the direction of approach of the participant’s vehicle. The VES was positioned on the glare cart according to the predetermined order. The onroad experimenters placed black felt in front of the VES and then notified the in-vehicle experimenter when the headlamps were stabilized. The in-vehicle experimenter instructed the participant to drive the vehicle to a set of cones placed 305 m (1,000 ft) from the front of the glare cart (see figure 8). When the participant vehicle was in position, the onroad experimenters removed the felt, and the participant was instructed to drive in the right lane toward the glare cart at 32 km/h (20 mi/h). The participant was told to consider his or her rating of overall perceived discomfort while approaching the glare cart. The in-vehicle experimenter instructed the participant to stop the vehicle at the designated location 30.5 m (100 ft) past the glare cart. While the vehicle was parked, the experimenter asked the participant to verbally rate the discomfort glare using the deBoer scale. The scale and its anchors were reviewed with the participant before each trial to ensure accurate rating. If an error occurred during testing, the trial was repeated at the end of the night. Figure 8. Diagram. Plan view of the participant vehicle at the start point in the discomfort glare portion.
Disability Glare Practice LapBefore data collection for the first disability glare session, the participant completed a practice lap. These two runs, one up the road and one down the road, ensured that the participant was familiar with the object detection task before data collection began. A pickup truck equipped with standard halogen headlamps was used in place of the glare cart during the practice lap, during which participants were presented with the pedestrian in the glare of the truck’s high beams and its low beams. Disability Glare PortionDuring the disability glare portion of the experiment, data were collected for each VES, driver light adaptation level, and pedestrian location combination. The primary task of the participant was to drive the vehicle safely at or below the set speed of 32 km/h (20 mi/h). The in-vehicle experimenter was in the back right seat of the vehicle, monitoring the data collection equipment and guiding the participant through the tasks. The initial steps were similar to the setup in the discomfort glare study. The onroad experimenters set up the glare cart, positioned a VES on the cart, and covered it with felt. The in-vehicle experimenter instructed the participant to drive the vehicle to a set of cones placed 305 m (1,000 ft) from the front of the glare cart (see figure 9). When the participant’s vehicle was in position, the onroad experimenters removed the felt, and the participant was instructed to drive in the right lane toward the glare cart at 32 km/h (20 mi/h). The participant was instructed to verbally alert the in-vehicle experimenter immediately when he or she could detect a pedestrian. The experimenter flagged the data and recorded the participant’s responses. As the vehicle passed the pedestrian, who had cleared the road for safety reasons, the in-vehicle experimenter pressed a separate button to flag the data again, indicating the pedestrian’s location. If an error occurred during testing, the trial was repeated at the end of the data collection. After the participant had been exposed to all the combinations of variables, he or she returned to the testing facility and received payment at the rate of 20 dollars per hour. Figure 9. Diagram. Plan view of the participant vehicle at the start point for the disability glare portion with right pedestrian.
DATA ANALYSISAll participants’ raw data collected from the in-vehicle computer program were first sorted and merged into one data file. Each participant had a separate data file for every headlamp combination and light adaptation level. An analysis of variance (ANOVA) was performed to determine the different effects of the treatment conditions. The procedure, “PROC GLM,” was used in SAS® (SAS Institute, Cary, NC) to compute the ANOVA for the discomfort glare ratings, the detection distance data, and the illuminance values. The independent variables in this study and their naming conventions are as follows: VES glare (VES), age (age), driver light adaptation level (adapt), and pedestrian location (pedestrian). Age was the only between-factor variable. Two different models were used in this study. For the discomfort glare rating, a mixed-factor model including VES, age, and adaptation level was used (table 9). The model shown in table 10, which includes VES, age, adaptation level, and pedestrian position, was used in the analysis of the detection distances and illuminance values under disability glare. For significant main effects
|