U.S. Department of Transportation
Federal Highway Administration
1200 New Jersey Avenue, SE
Washington, DC 20590
202-366-4000
Federal Highway Administration Research and Technology
Coordinating, Developing, and Delivering Highway Transportation Innovations
| SUMMARY REPORT |
| This summary report is an archived publication and may contain dated technical, contact, and link information |
|
Publication Number: FHWA-RD-93-046
Date: August 1993 |
The Association Of Median Width And Highway Accident RateMedians on divided highways may be used as recovery areas by out-of-control vehicles. In some regions, the median widths of new highways are being minimized to control the amount of right-of-way required, and in others, existing highway medians are being reduced so that additional travel lanes can be built to improve capacity. Such actions tradeoff safety to reduce costs or increase efficiency (as measured by capacity). Correcting a deficiency after a road has been built is more expensive than building without the deficiency. The design of new highways must balance safety, cost, environment, and efficiency considerations. This study examined the effect of median width on the frequency and severity of accidents on homogeneous highway sections with a traversable (nonbarrier) median. Analysis Methods Median width was defined as the width of the portion of divided highway separating the traveled ways for traffic in opposite directions (including the inside shoulder). In addition to median width, several roadway characteristics affect the frequency, severity, and type of accidents. To isolate the effect of median width, these other variables must be controlled either by restricting the road sections to having particular characteristics or by making statistical adjustments. Both methods were used in this study.
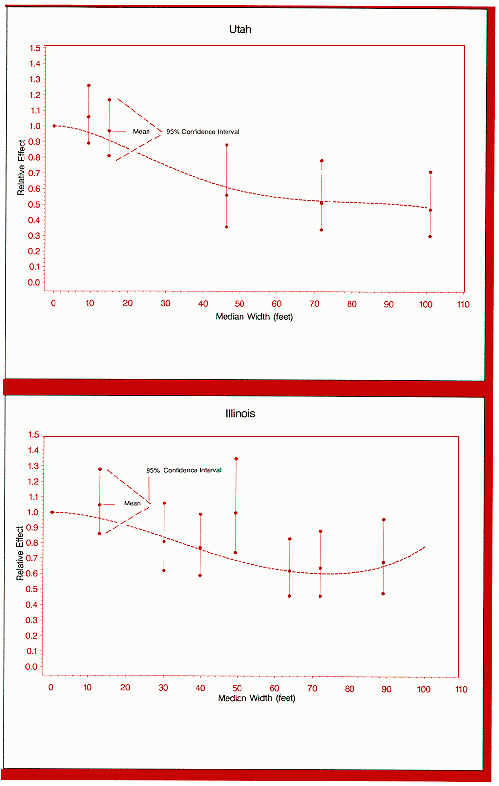
Figure 1. Relative effect of median width on total accident rate The analyses were restricted to two-way, four-lane, rural and urban Interstate, freeway, and major highway road sections in Utah and Illinois of a length exceeding 0.11 km (0.07 mi), with a posted speed limit of at least 56.3 km/h (35 mi/h), and with no median or an unprotected median no wider than 33.5 m (110 ft). In addition, the Utah analysis was restricted to road sections with 3.66-m (12-ft) lane widths. No such restriction was placed on the Illinois analysis as there was no explicit lane width variable in that data base.
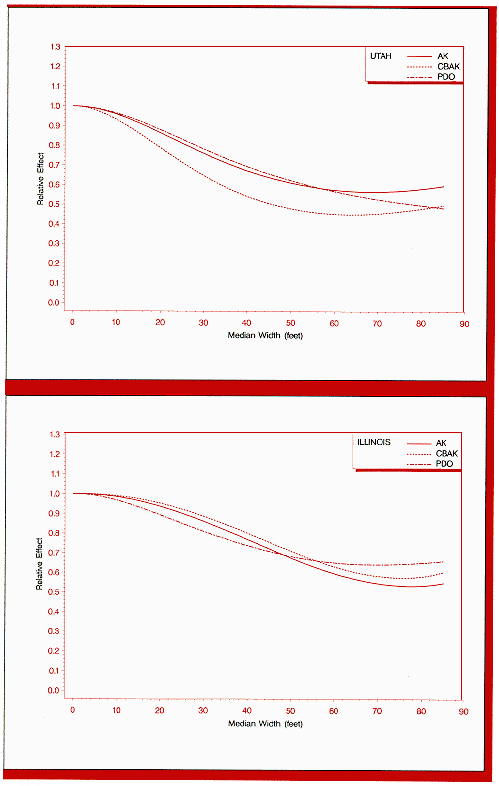
Figure 2. Relative effects of median width by accident severity The Utah analysis was based on 982 highway sections with an average length of 1.59 km (0.99 mi). A total of 37,544 reported accidents occurred on those sections from 1987 through 1990. The Illinois analysis involved 2,481 highway sections with an average length of 1.35 km (0.84 mi). A total of 55,706 accidents on those sections was reported over the period from 1987 through 1989. A log-linear regression model assuming a negative-binomial variance function was used to assess the effects of median width and several other roadway variables on the accident rate. This model assumes that the effect of variables on the accident rate is multiplicative rather than additive as in a linear model. The log-linear model may be represented algebraically as:
where
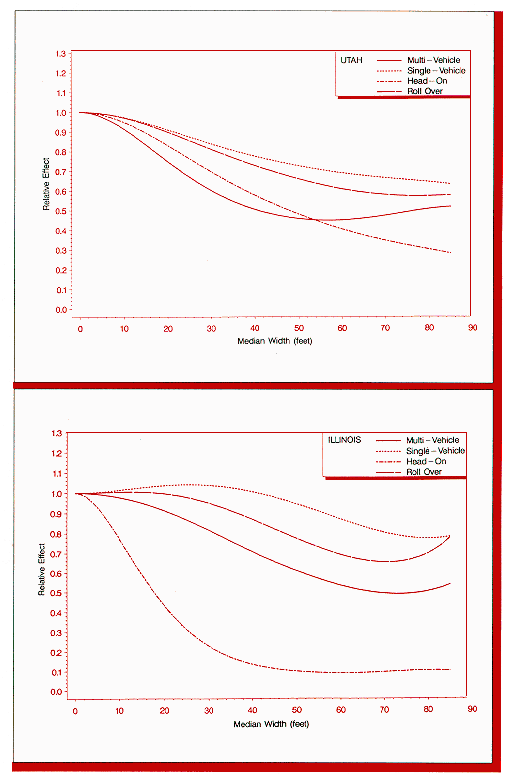
Figure 3. Relative effects of median width by accident type. Results The total accident rate appears to decline steadily with increasing median width from 0 to 33.5 m (0 to 110 ft). For Utah it declines by a factor of six, and for Illinois, it declines by a factor of 13. Over this range of median width, the rates of serious injury, all injury, and property-damage-only accidents also decline by up to a factor of 15. The rate of multivehicle accidents declines steadily with increasing median width. The rate of single-vehicle accidents in Utah shows little relationship to median width, however. Due to confounding by other variables, the observed reductions in the accident rate cannot all be attributed to the effect of increasing median width. After adjusting for these other variables, the decline in the total accident rate persists, though to a lesser degree (figure 1). This figure depicts the relative effect of median width on total accident rates in Utah and Illinois when median width is represented both as a categorical and as a continuous variable relative to the rate for medians of zero width. The upper and lower values are the boundaries of the 95-percent confidence interval for median width as a categorical variable. Over the range of median widths, Utah accident rates drop about one-half and Illinois rates drop about one-third. The interpretation of these relative effects is that when all the other variables are the same and the only difference is the median width, the relative effect describes the proportional reduction in the total accident rate. For example, using the Illinois model shown in figure 1, the total accident rate for an average median width of 12.2 m (40 ft) is about 76 percent of the rate for median width zero (no median), and for an average median width of 19.5 m (64 ft), it is 62 percent of the zero width rate. If, in designing a new highway, the engineer wants to consider the safety benefits of increasing the median width from 12.2 to 19.5 m (40 to 64 ft), this is obtained as (0.62-0.76)/0.76 = -0.18. Therefore, you would expect an 18-percent reduction in the accident rate. Similarly, if you reduce an existing 19.5-m (64-ft) median to a 12.2-m (40-ft) one, you would expect a 23-percent increase in the total accident rate [(0.76-0.62)0.62 = 0.23]. Relative accident rates for more specific accident sevaities or types (such as serious accident or head-on/sideswipe opposite direction (HO) ) generally declined with increasing median width (figures 2 and 3). Figure 2 shows that in Utah, for instance, relative accident rates for both serious (AK) and injury accidents (CBAK) declined steadily as median width increased from 0 to 12.2 m (0 to 40 ft). These rates remained stable for median widths exceeding 12.2 m (40 ft). The relative accident rate for property-damage-only accidents (PDO) fell steadily as median width increased from 0 to 24.4 m (0 to 80 ft). In Illinois, the AK and CBAK relative accident rates fell until median width had increased to 21.3 m (70 ft). Although the data indicate a slight increase beyond 21.3 m (70 ft), it is believed this is an artifact of the small sample sizes available at this median width. The relative accident rates would be expected to remain constant beyond 21.3 m (70 ft). According to figure 3, relative accident rates for rollover accidents (Roll) in Utah fell to a minimum when median width had increased to 21.3 m (70 ft). The relative rates for multivehicle accidents (MVeh), single-vehicle accidents (SVeh), and head-on/sideswipe opposite direction accidents generally declined with increasing median width. For Illinois, the relative rate for head-on/sideswipe accidents dropped sharply, then stabilized around 0.12 at a median width of approximately 12.2 m (40 ft). For multivehicle accidents, the relative rates generally fell, though not as rapidly. Relative rates far single-vehicle accidents dropped slightly with increasing median width, while for rollover accidents the relative rates remained between 0.65 and 0.90 for median widths of 12.2 m (40 ft) or wider. State Databases Used Illinois and Utah were the only HSIS States with accident and roadway data sufficiently complete and reliable to permit an analysis of the effect of median width on accident rates for those medians without barriers. Study Implications The general findings indicate that accident rates do decrease with increasing median width for unprotected medians. On the other hand, there was very little decrease for the first 9.1 m (30 ft) of median width suggesting that when constructing new highways, medians need to be at least 9.1 m (30 ft) wide to have a positive safety effect. The data also indicates that the safety benefits of medians increase until widths of 18. 3 to 24.4 m (60 to 80 ft) are reached. While it is difficult to determine the exact accident width where the safety effect is lost, the data suggest that decreasing existing medians to less than 6.1 to 9.1 m (20 to 30 ft) wide to enhance capacity may decrease the level of safety on the roadway. Unfortunately, the HSIS data set could not be used to determine the median width at which a positive barrier should be used. At the current time, the HSIS States contain only a limited number of miles of roadway with barrier, and the variation in median width on these roadways is insufficient for a statistically valid study. Three to four additional States will be added to the HSIS by the end of 1994. It is anticipated that this will provide a sufficient sample size to conduct this type of analysis. |


 is a function of the accident rate, log denotes natural logarithm, and the X, are dummy variables for categorical roadway characteristics or actual values for quantitative roadway characteristics. The beta coefficients were estimated by the method of quasi-likelihood.