A Review of Pedestrian Safety Research in the United States and Abroad
Final Report
Part 2. Crashes Involving Pedestrians
Introduction
The sheer number of pedestrians killed or seriously injured in U.S. traffic collisions each year is an important consideration in the Nation's highway transportation system. The NHTSA estimated that 5,300 pedestrians were killed in the United States during 1997 (Traffic Safety Facts, 1997). NHTSA also reported 77,000 nonfatal injuries. Casualties of this magnitude take on even greater meaning in view of the national policy to encourage increased walking as a matter of both transportation and health.
Limitations of National Pedestrian Crash Data
Pedestrian crash statistics must be considered with two caveats: First, the numbers presented in this report are estimates, aggregated from information compiled in 50 States plus the District of Columbia, or taken from studies that sample pedestrian collisions. Predictably, there is some uncertainty in the reporting processes and expectable variations due to sampling differences. Second, definitions vary among agencies. Thus, fatality estimates from the National Safety Council (NSC) differ somewhat from those of the NHTSA due to their definitions of death. NSC counts a traffic fatality as any crash death that ensues within 1 year after the crash, whereas NHTSA only counts those deaths that occur within 30 days. Other totals would result if, for example, traffic death counts were confined to victims who died at the crash scene.
Another caution pertains to interpreting the following data tables, which may themselves be overly simplistic. A collision may be associated with several factors, therefore a table that displays only two or three factors leaves much unsaid. For example, a table depicting pedestrian crashes by time of occurrence will show that a certain proportion occurs at night. However, not all of the observed trends shown in such a table would be caused by reduced nighttime visibility. Although reduced visibility at night plays an important role in the likelihood of a crash, the nighttime figures are also influenced by the number of people who are exposed to risk at night as opposed to in the daytime, the ages of the pedestrians, and the role of alcohol. Thus,any table of crash data reflects the influence of variables not shown, as well as the influence of the variables that are depicted.
Moreover, many studies do not consider the number of people actually exposed to risk.
Reports reviewed here span the period during which standardized terminology was evolving. Thus, various authors use the term "accident", "collision", or "crash" to describe the phenomena under examination here. While the terms are sometimes used interchangeably, "crash" has become the term preferred by safety organizations.
The Number of Pedestrian Fatalities
The NSC annually publishes an estimate of U.S. pedestrian deaths for the most recent year
available, as well as for years as far back as 1927 (Accident Facts, 1995, 1996, 1997 editions). The estimated number of pedestrian fatalities for 1927 was 10,820, as shown in table 4. The pedestrian death count irregularly grew until 1937, when 15,500 pedestrian deaths were reported, the largest number in U.S. history. Thereafter, the number declined. The number of pedestrian fatalities exceeded 10,000 during 1969, 1972, and 1973, and since then decreased to 6,100 in 1996. It should be noted that the NSC estimating procedure was changed in 1987 and the annual number of deaths it reported became substantially lower beginning that year.
Table 4. Estimated national traffic fatalities by year.
| Year |
National Safety Council |
National Highway Traffic
Safety Administration (U.S. DOT)** |
| Total Fatalities |
Pedestrian Fatalities |
% Pedestrian |
Total Fatalities |
Pedestrian Fatalities |
% Pedestrian |
| 1927 |
25,800 |
10,820 |
41.9 |
|
|
|
| 1928 |
28,000 |
11,420 |
40.8 |
|
|
|
| 1929 |
31,200 |
12,250 |
39.3 |
|
|
|
| 1930 |
32,900 |
12,900 |
39.2 |
|
|
|
| 1931 |
33,700 |
13,370 |
39.7 |
|
|
|
| 1932 |
29,500 |
11,490 |
38.9 |
|
|
|
| 1933 |
31,363 |
12,840 |
40.9 |
|
|
|
| 1934 |
36,101 |
14,480 |
40.1 |
|
|
|
| 1935 |
36,369 |
14,350 |
39.5 |
|
|
|
| 1936 |
38,089 |
15,250 |
40.0 |
|
|
|
| 1937 |
39,643 |
15,500 |
39.1 |
|
|
|
| 1938 |
32,582 |
12,850 |
39.4 |
|
|
|
| 1939 |
32,386 |
12,400 |
38.3 |
|
|
|
| 1940 |
34,501 |
12,700 |
36.8 |
|
|
|
| 1941 |
39,969 |
13,550 |
33.9 |
|
|
|
| 1942 |
28,309 |
10,650 |
37.6 |
|
|
|
| 1943 |
23,823 |
9,900 |
41.6 |
|
|
|
| 1944 |
24,282 |
9,900 |
40.8 |
|
|
|
| 1945 |
28,076 |
11,000 |
39.2 |
|
|
|
| 1946 |
33,411 |
11,600 |
34.7 |
|
|
|
| 1947 |
32,697 |
10,450 |
32.0 |
|
|
|
| 1948 |
32,259 |
9,950 |
30.8 |
|
|
|
| 1949 |
31,701 |
8,800 |
27.8 |
|
|
|
| 1950 |
34,763 |
9,000 |
25.9 |
|
|
|
| 1951 |
36,996 |
9,150 |
24.7 |
|
|
|
| 1952 |
37,794 |
8,900 |
23.5 |
|
|
|
| 1953 |
37,956 |
8,750 |
23.1 |
|
|
|
| 1954 |
35,586 |
8,000 |
22.5 |
|
|
|
| 1955 |
38,426 |
8,200 |
21.3 |
|
|
|
| 1956 |
39,628 |
7,900 |
19.9 |
|
|
|
| 1957 |
38,702 |
7,850 |
20.3 |
|
|
|
| 1958 |
36,981 |
7,650 |
20.7 |
|
|
|
| 1959 |
37,910 |
7,850 |
20.7 |
|
|
|
| 1960 |
38,137 |
7,850 |
20.6 |
|
|
|
| 1961 |
38,091 |
7,650 |
20.1 |
|
|
|
| 1962 |
40,804 |
7,900 |
19.4 |
|
|
|
| 1963 |
43,564 |
8,200 |
18.8 |
|
|
|
| 1964 |
47,700 |
9,000 |
18.9 |
|
|
|
| 1965 |
49,163 |
8,900 |
18.1 |
|
|
|
| 1966 |
53,041 |
9,400 |
17.7 |
|
|
|
| 1967 |
52,924 |
9,400 |
17.8 |
|
|
|
| 1968 |
54,862 |
9,900 |
18.0 |
|
|
|
| 1969 |
55,791 |
10,100 |
18.1 |
|
|
|
| 1970 |
54,633 |
9,900 |
18.1 |
|
|
|
| 1971 |
54,381 |
9,900 |
18.2 |
|
|
|
| 1972 |
56,278 |
10,300 |
18.3 |
|
|
|
| 1973 |
55,511 |
10,200 |
18.4 |
44,525 |
7,516 |
16.9 |
| 1974 |
46,402 |
8,500 |
18.3 |
45,523 |
7,427 |
16.3 |
| 1975 |
45,853 |
8,400 |
18.3 |
47,878 |
7,732 |
16.1 |
| 1976 |
47,038 |
8,600 |
18.3 |
50,331 |
7,795 |
15.5 |
| 1977 |
49,510 |
9,100 |
18.4 |
51,093 |
8,096 |
15.8 |
| 1978 |
52,411 |
9,600 |
18.3 |
51,091 |
8,070 |
15.8 |
| 1979 |
53,524 |
9,800 |
18.3 |
49,301 |
7,837 |
15.9 |
| 1980 |
53,172 |
9,700 |
18.2 |
43,945 |
7,331 |
16.7 |
| 1981 |
51,385 |
9,400 |
18.3 |
42,589 |
6,826 |
16.0 |
| 1982 |
45,779 |
8,400 |
18.3 |
44,257 |
7,025 |
15.9 |
| 1983 |
44,452 |
8,200 |
18.4 |
43,825 |
6,808 |
15.5 |
| 1984 |
46,263 |
8,500 |
18.4 |
46,087 |
6,779 |
14.7 |
| 1985 |
45,901 |
8,500 |
18.5 |
46,390 |
6,745 |
14.5 |
| 1986 |
47,865 |
8,900 |
18.6 |
47,087 |
6,870 |
14.6 |
| 1987 |
48,290 |
7,500* |
15.5* |
45,582 |
6,556 |
14.4 |
| 1988 |
49,078 |
7,700 |
15.7 |
44,599 |
6,482 |
14.5 |
| 1989 |
47,575 |
7,800 |
16.4 |
41,508 |
5,801 |
14.0 |
*Estimation procedure changed effective 1987 figures.
**Published information not available from NHTSA prior to 1973.
Sources: 1. Accident Facts, 1995 and 1997 editions, National Safety Council, Chicago, IL, |
It is also of interest to consider pedestrian fatalities as a percentage of total traffic fatalities. During 1927, pedestrian deaths accounted for 41.9 percent of total traffic deaths. That percentage has declined and was 14.1 percent of the total in 1996, a substantial decline from 1927 (figure 5). Increased travel by car is one factor in that change. Evans (1991), among others, has reported that the higher the degree of motorization in a country, the number of motor vehicles per 100,000 population, the lower the proportion of pedestrian deaths to total traffic deaths. The proportion of pedestrian deaths declined as the United States progressively became more motorized. This trend also is seen in less motorized countries (Choueiri et al., 1993).
This influence of car travel was highlighted by the U.S. experience during World War II when there was an interruption in the steady decline in pedestrian fatalities as a percentage of total traffic fatalities. The pedestrian fatalities were 33.9 percent in 1941. During the war years (1942-1945) the total abruptly jumped to values between 38 and 41 percent. In 1947, the figure reversed again to a new low of 32 percent, and after 1949 did not again reach 30 percent (See table 4). The increase during World War II probably reflected the fact that motor vehicle mileage fell during those years because civilian vehicle production gave way to military needs, and the existing civilian motor vehicle fleet amassed drastically fewer miles because of gasoline and tire (that is, rubber) rationing. It is also likely that the characteristics of highway users changed during that period, what with millions of young men away in the military, plus unprecedented numbers of women in the work force. It should be noted that Choueiri et al. (1993) show a greater pedestrian death decline in Europe during recent years than in the United States.
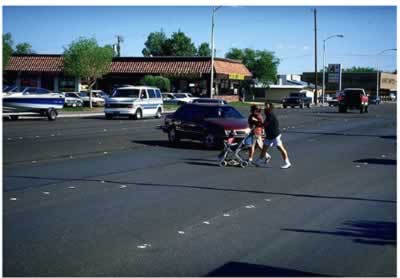
Table 5 shows a comparison of States (and Puerto Rico), using NHTSA data (Traffic Safety Facts, 1995) from highest rank to lowest according to pedestrian deaths per 100,000 population. The table is reproduced here to suggest some of the complexities that underlie pedestrian crash and death figures. The 10 States with the highest pedestrian death rate per 100,000 population vary significantly: two are urban and densely populated (DC and Puerto Rico), 3 are sparsely populated desert states, and 3 are among the 11 most populous states (California, Florida, and North Carolina). This suggests that the complex of factors producing high pedestrian death rates may differ from one State to another. Also, none of these rates consider pedestrian exposure or vehicle exposure, the proportion of pedestrians by age, or many other possible contributing factors.
At the other end of the spectrum, the 10 States with the lowest pedestrian death rate per 100,000 population also differ. The lowest 10 include rural States, cold weather States, industrial heartland states, and the agricultural midwest. This may be indicative of lower amounts of walking by pedestrians and/or less pedestrian interaction with high volumes of motor vehicles.
When Do Pedestrian Collisions Occur?
A. TIME OF DAY
Collisions can and do occur at any time, but there are trends involving the time of occurrence. Table 6 shows how pedestrian crashes, injuries, and fatalities vary by time of day.
|
| Figure 5. Pedestrian as a percentage of total traffic fatalities, 1927-1996 |
Table 5. Ranking of State pedestrian fatality rates per 100,000 residents, 1994.
| Rank |
State |
Pedestrians Killed |
Population (Thousands) |
Pedestrian Fatality Rate per 100,000 Population |
| 1 |
New Mexico |
72 |
1,654 |
4.35 |
| 2 |
District of Columbia |
23 |
570 |
4.04 |
| 3 |
Florida |
531 |
13,953 |
3.81 |
| 4 |
Nevada |
54 |
1,457 |
3.71 |
| 5 |
Arizona |
148 |
4,075 |
3.63 |
| 6 |
South Dakota |
23 |
721 |
3.19 |
| 7 |
South Carolina |
108 |
3,664 |
2.95 |
| 8 |
California |
843 |
31,431 |
2.68 |
| 9 |
North Carolina |
184 |
7,070 |
2.60 |
| 10 |
Maryland |
129 |
5,006 |
2.58 |
| 11 |
Delaware |
18 |
706 |
2.55 |
| 12 |
Louisiana |
103 |
4,315 |
2.39 |
| 13 |
Texas |
436 |
18,378 |
2.37 |
| 14 |
Georgia |
163 |
7,055 |
2.31 |
| 15 |
Arkansas |
55 |
2,453 |
2.24 |
| 16 |
Oregon |
69 |
3,086 |
2.24 |
| 17 |
Hawaii |
26 |
1,179 |
2.21 |
| 18 |
New York |
397 |
18,169 |
2.19 |
| 19 |
Utah |
40 |
1,908 |
2.10 |
| 20 |
New Jersey |
165 |
7,904 |
2.09 |
| 21 |
Mississippi |
54 |
2,669 |
2.02 |
| 22 | Alaska |
12 |
606 |
1.98 |
| 23 | Illinois |
232 |
11,752 |
1.97 |
| 24 | Alabama |
81 |
4,219 |
1.92 |
| 25 | Connecticut |
63 |
3,275 |
1.92 |
| 26 | Michigan |
182 |
9,496 |
1.92 |
| 27 | Tennessee |
97 |
5,175 |
1.87 |
| 28 | Maine |
20 |
1,240 |
1.61 |
| 29 | Missouri |
85 |
5,278 |
1.61 |
| 30 | Oklahoma |
52 |
3,258 |
1.60 |
| 31 | Rhode Island |
16 |
997 |
1.60 |
| 32 | West Virginia |
29 |
1,822 |
1.59 |
| 33 | Virginia |
102 |
6,552 |
1.56 |
| 34 | Washington |
83 |
5,343 |
1.55 |
| 35 | Pennsylvania |
171 |
12,052 |
1.42 |
| 36 | Kentucky |
54 |
3,827 |
1.41 |
| 37 | Massachusetts |
85 |
6,041 |
1.41 |
| 38 | Colorado |
51 |
3,656 |
1.39 |
| 39 | Indiana |
80 |
5,752 |
1.39 |
| 40 | Montana |
11 |
856 |
1.29 |
| 41 | North Dakota |
8 |
638 |
1.25 |
| 42 | Minnesota |
53 |
4,567 |
1.16 |
| 43 | Ohio |
127 |
11,102 |
1.14 |
| 44 | Nebraska |
17 |
1,623 |
1.05 |
| 45 | New Hampshire |
11 |
1,137 |
0.97 |
| 46 | Wisconsin |
49 |
5,082 |
0.96 |
| 47 | Kansas |
22 |
2,554 |
0.86 |
| 48 | Iowa |
24 |
2,829 |
0.85 |
| 49 | Wyoming |
4 |
476 |
0.84 |
| 50 | Idaho |
8 |
1,133 |
0.71 |
| 51 | Vermont |
2 |
580 |
0.34 |
| | USA |
5,472 |
260,341 |
2.10 |
| |
Puerto Rico |
205 |
3,700 |
5.54 |
| Source: Traffic Safety Facts, 1994: 1994 Motor Vehicle Crash Data from FARS and GES National Highway Traffic Safety Administration,
US DOT, Washington, D.C., 1995. |
Table 6. Pedestrian collisions by time of day.
| |
National Fatalities1 |
National Injuries1 |
Sample of Crashes2 |
| |
% |
N |
% |
N |
% |
N |
6-9 AM |
7.5 |
409 |
9.5 |
9,000 |
8.9 |
420 |
9 AM-Noon |
6.9 |
377 |
9.3 |
8,000 |
9.3 |
440 |
Noon-3 PM |
8.8 |
480 |
18.4 |
16,000 |
32.20 |
735 |
3-6 PM |
13.9 |
760 |
25.5 |
23,000 |
20.2 |
1271 |
6-9 PM |
24.8 |
1359 |
21.2 |
19,000 |
11.3 |
954 |
9 PM-Midnight |
19.4 |
1062 |
10.7 |
10,000 |
6.0 |
536 |
Midnight-3 AM |
11.7 |
638 |
4.3 |
4,000 |
1.9 |
283 |
3-6 AM |
6.5 |
353 |
1.1 |
1,000 |
9.2 |
92 |
| |
100% |
5472 |
100% |
90,000 |
100% |
4,731 |
1Estimates of national figures. Source: Traffic Safety Facts, 1994: 1994 Motor
Vehicle Crash Data from FARS and GES, National Highway Traffic Safety Administration, USDOT, Washington, D.C., August 1995.
2Sample data from
six states. Source:Derived from database used in Pedestrian and Bicycle Crash Types of the Early 1990s, Hunter, W., Stutts, J., Pein, W., Cox, C.,
UNC HSRC, FHWA-RD-95-163, 1996. The sample noted crashes of all severities ranging from fatal to no injury, and was drawn from California, Florida, Maryland,
Minnesota, North Carolina, and Utah, covering collisions that occurred in 1991 or 1992. |
Table 6 can be used to contrast the time of occurrence for "all" pedestrian crashes, fatally injured pedestrians, and pedestrians injured but not killed.
|
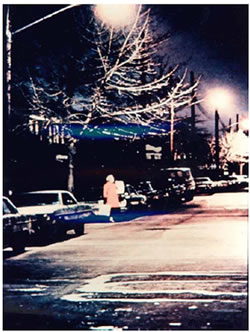
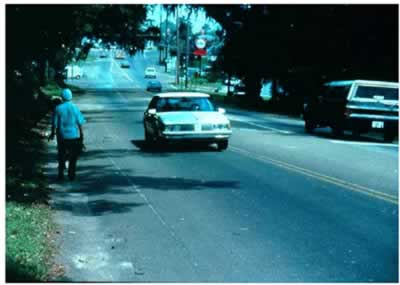
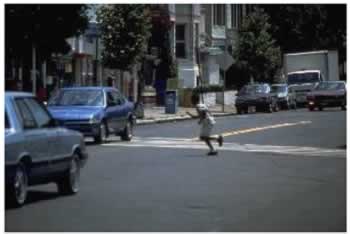
| Figure 6. A disproportionately high percentage of pedestrian deaths occur at night. |
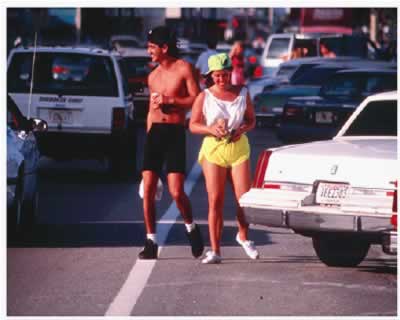
Among the sample of pedestrian collisions (Hunter et al., 1996), 62 percent happened during the day between 6:00 a.m. and 6:00 p.m. Consistent with those daytime numbers are other findings, based on data from urban areas. These show general agreement that the peak time for pedestrian crashes is between 3 p.m. and 6 p.m. This peak represents about 30 to 40 percent of the collisions (Fatal Accident Reporting System, 1990; Knoblauch, 1977; Davis and Huelke, 1969; Cove, 1990) and the proportion decreases on either side of this period. Smaller secondary peaks from 7 a.m. to 9 a.m. and Noon to 1 p.m. were reported by Smeed (1968).
NHTSA figures (Traffic Safety Facts, 1995) show that the distribution by time of occurrence for pedestrian injuriesis somewhat similar to that of all collisions (about 63 percent of injuries concentrated from 6:00 a.m. to 6:00 p.m., compared with 61 percent for all collisions). This was also reported by Cove (1990), showing pedestrian injury crashes to have a major peak between 3 p.m. and 7 p.m. and a minor peak between 7 a.m. and 9 a.m., based on data from the National Accident Sampling System (see figure 7).
 |
| Figure 7. Pedestrian injuries by time of day for urban and rural land use. |
The time distribution of pedestrian fatalities stands in sharp contrast to the above. Among pedestrian fatalities, 62 percent happened at night (table 6). Fatal pedestrian crashes peak in the evening hours (Cove, 1990), between 5 and 11 p.m., including one minor peak from midnight to 2 a.m. (See figure 8).
This trend in fatalities could be partly associated with rural pedestrian crashes involving high-speed vehicles and pedestrians walking along a dark road or in some cases lying unconscious (sleeping) in the road. In fact, in North Carolina, 10 percent of all pedestrian fatalities involve a pedestrian lying in the road (North Carolina Traffic Accident Facts, 1990). Thus, the role of alcohol among adults is thought to be involved in nighttime pedestrian fatalities. Fatality figures suggest that the victim profile would vary by time of day. Alcohol is a greater factor at night, but children are less likely to be involved at night.
Both the severity of pedestrian injury and the type of pedestrian crash vary by time of day. Data
from six states, reported by Hunter et al. (1996), illustrate this point. Based on a sample of all pedestrian crashes, table 7 shows a breakdown of pedestrian crash types according to four different light conditions (i.e., related to time of day), distributed as follows:
| Crashes occurred during |
Percent of sample |
Daylight hours |
60.6 |
Dawn or dusk |
4.6 |
Dark, street lighted |
23.3 |
Dark, street not lighted |
11.6 |
These four categories create a rough scale from the greatest amount of light (daylight) to the least (dark, street not lighted), thus partly related to time of day, and table 7 shows the crash types that are most frequent under each light condition. Though daylight hours account for about 61 percent of all crashes in Hunter's study, more than 70 percent of some types of crashes occur in the daytime (e.g., 73 percent of pedestrian crashes related to buses occur in daylight).
Although unlit rural streets and roads might be considered a considerable hazard for pedestrians, the data in table 7 show that these conditions account for a much smaller percent of all crashes than, for example, walking along a roadway in daylight.
 |
Figure 8. Pedestrian fatalities by time of day for urban and rural land use.
Source: Cove, 1990. |
Table 7. Fatal and non-fatal pedestrian crash types by light condition.
| |
Light Condition*/Percent of All Crashes |
| Pedestrian Crash Type |
Daylight |
Dawn/Dusk |
Dark, Street Light |
Dark, No Street Light |
Bus related |
72.7 |
4.5 |
20.5 |
2.3 |
Other vehicle specific |
74.2 |
2.2 |
13.5 |
10.1 |
Driverless vehicle |
82.4 |
4.1 |
4.1 |
9.5 |
Backing vehicle |
72.0 |
3.2 |
19.1 |
5.7 |
Disabled vehicle |
40.0 |
6.7 |
16.7 |
36.7 |
Working/playing in road |
74.7 |
8.2 |
11.6 |
5.5 |
Walking along roadway |
33.5 |
5.5 |
19.4 |
41.6 |
Not in road |
67.8 |
4.2 |
22.6 |
5.4 |
Vehicle turning at intersection |
72.0 |
5.3 |
20.5 |
2.2 |
Intersection dash |
70.9 |
4.5 |
20.4 |
4.2 |
Driver violation at intersection |
63.1 |
2.7 |
32.9 |
1.2 |
Other intersection |
53.8 |
4.4 |
34.8 |
7.0 |
Midblock dart/dash |
73.4 |
5.7 |
14.7 |
6.2 |
Other midblock |
46.8 |
3.4 |
32.1 |
17.7 |
Miscellaneous |
49.5 |
3.8 |
28.6 |
18.1 |
ALL CRASHES |
60.6 |
4.6 |
23.3 |
11.6 |
*Cases with unknown light condition excluded.
Source: Pedestrian and Bicycle Crash Types of the Early 1990s Hunter, W., Stutts, J.,Pein, W., Cox, C., UNC HSRC, FHWA-RD-95-163, 1996. |
The nighttime association with fatal crashes is emphasized in a study of the effects of daylight savings time (DST) (Ferguson et al., 1995). This study asserts that if DST were retained year-round, approximately 900 additional traffic deaths would be avoided (727 pedestrians and 174 motor vehicle occupants, say the authors) because the DST clock setting results in more daylight at the end of the day, when fatal crashes are more likely, an advantage that is apparently not fully offset by the comparably less daylight during the morning hours.
B. DAY OF WEEK
Pedestrian crashes also vary by day of week. Available data indicate that pedestrian crashes are overrepresented on Friday and Saturday and are underrepresented on Sunday. These trends may be related to such factors as: the amount of walking by day of week; less pedestrian interaction with rush-hour traffic; and/or less late-night drinking and walking. A Wayne County, MI, study (Davis and Huelke, 1969) reported that 35 percent of the crashes there occurred on Friday and Saturday. This was especially true for children, with Friday being the highest crash day. Similar patterns were found for urban, suburban, and rural data samples from a number of U.S. cities and counties (Knoblauch, 1977). The highest overrepresentation of pedestrian crashes was on Friday.
Data dealing with pedestrian fatalities also reveal that Friday and Saturday have the greatest percentages of such crashes for both rural and urban areas, with pedestrian fatalities nearly constant for Sunday through Wednesday (see figure 9). Pedestrian crashes resulting in non-fatal injuries were most prevalent on Fridays and lowest on Sundays (Cove, 1990).
|
Figure 9. Pedestrian fatalities by day of week for urban and rural land use.
Source: Cove, 1990. |
C. MONTH OF YEAR
Beyond the trends by hour of day and day of week, there are also differences in U.S. pedestrian crashes by season of year, mediated in part by factors related to pedestrian age. Figure 10 shows that among older pedestrians, more crashes occur during the fall and winter months, whereas among younger pedestrians more occur during the spring and summer (Zegeer et al., 1993).
Consistent with the above, a study conducted in Wayne County, MI (Davis and Huelke, 1969) showed that more pedestrians (13 percent) were killed during December than in any other month. A study of rural and urban data samples of U.S. areas (Knoblauch, 1977) showed December to be the month having the greatest overrepresentation. Nationwide pedestrian fatalities in 1989 were found to be highest in September through January (Figure 11), months with fewer daylight hours and more inclement weather.
|
Figure 10. Pedestrian crashes by age and occurring in fall or winter months. (September-February).
Source: Cove, 1990.
|
|
Figure 11. Pedestrian fatalities by month.
Source: Cove, 1990. |
D. SUMMARY: WHEN DO PEDESTRIAN COLLISIONS OCCUR?
- Fatal pedestrian crashes tend to occur during nighttime hours.
- Non-fatal pedestrian crashes tend to occur during daytime hours.
- Pedestrian crashes are more frequent on Friday and Saturday and less frequent on Sunday.
- Child-pedestrian crashes occur more often during summer.
- Adult pedestrian crashes occur more often in the winter.
- Type of pedestrian crashes also varies with time of day, day of week, and season.
Who Is Involved in Pedestrian Crashes?
A. AGE
Table 8 shows that the largest percentage of pedestrian deaths is seen for the two age groups that span the 25-44 year age range. A total of 31.8 percent (15.4 percent + 16.4 percent) of pedestrian fatalities occur in this age range, a greater percentage than for the 5 preceding age groups combined. (Note the varying age intervals used in this table prepared by NHTSA [Traffic Accident Facts, 1995.] The 25-34 age category spans 10 years while the next lower category (21-24) only covers 4 years. Thus, the 15.4 percent of fatalities that falls in the 25-34 year category is not as much greater as might appear when compared with the next younger category, since the latter includes data from less than half as many years. Note also that 13.9 percent of fatalities fall in the oldest category [greater than 75 years old]; however, the open-ended age span of this category includes data from more years than the immediately preceding category. Overall, more than twice as many male pedestrians (3742) are killed as female (1727) pedestrians.
The final column shows fatalities expressed as deaths per 100,000 persons in a given age category. The oldest age category stands in greatest contrast to the rest.
The oldest age category does not contrast as sharply to the next younger age groups in terms of injury statistics (non-fatal). This may stem in part from the fact that older pedestrians are more likely to succumb to their injuries than younger adults. Children may be more likely to survive collisions on lower speed neighborhood streets. The difference in injuries between male and female pedestrians is less than that for fatalities. The ratio of male/female pedestrian injuries is 1.4 while the ratio of male/female pedestrian deaths is 2.2.
For "all" pedestrian crashes (Hunter et al., 1996), the distribution by age is more similar to injury crashes than to fatal crashes. Also, the ratio of male to female differs. In fatal crashes, there are more males in every age category, but in "all" crashes, males make up fewer than half of the cases in several age categories, including the 10-20 year age range and the categories that include persons 55 years old and older. In this database, 61 percent of the pedestrians involved in a collision were males. In short, samples of fatal pedestrian crashes are more likely to involve males and ages 25-54 compared to nonfatal pedestrian crashes.
Table 8. Pedestrian deaths, injuries, and total collisions by gender of victim.
|
Killed1 |
| Male |
Female |
Total |
M/F |
Deaths/00,000 pop. |
| N |
% |
N |
% |
N |
% |
| Age <5 |
148 |
3.9 |
86 |
5.0 |
234 |
4.3 |
1.7 |
1.2 |
| 5-9 |
196 |
5.2 |
96 |
5.6 |
292 |
5.3 |
2.0 |
1.6 |
| 10-15 |
179 |
4.8 |
101 |
5.8 |
280 |
5.1 |
1.8 |
1.2 |
| 16-20 |
188 |
5.0 |
82 |
4.7 |
270 |
4.9 |
2.3 |
1.5 |
| 21-24 |
221 |
5.9 |
61 |
3.5 |
282 |
5.2 |
3.6 |
1.9 |
| 25-34 |
637 |
17.0 |
207 |
12.0 |
844 |
15.4 |
3.1 |
2.0 |
| 35-44 |
670 |
17.9 |
227 |
13.1 |
897 |
16.4 |
3.0 |
2.2 |
| 45-54 |
439 |
11.7 |
172 |
10.0 |
611 |
11.2 |
2.6 |
2.0 |
| 55-64 |
305 |
8.2 |
152 |
8.8 |
457 |
8.4 |
2.0 |
2.2 |
| 65-74 |
288 |
7.7 |
200 |
11.6 |
488 |
8.9 |
1.4 |
2.6 |
| 75+ |
427 |
11.4 |
334 |
19.3 |
761 |
13.9 |
1.3 |
5.3 |
| Unknown |
44 |
|
9 |
|
56 |
|
|
|
| Total |
3742 |
|
1727 |
|
5472 |
|
2.2 |
|
| Injured1 |
| Age <5 |
2229 |
4.3 |
1810 |
4.8 |
4039 |
4.5 |
1.2 |
|
| 5-9 |
7523 |
14.6 |
4629 |
12.2 |
12152 |
13.6 |
1.6 |
|
| 10-15 |
8007 |
15.5 |
6637 |
17.4 |
14642 |
16.3 |
1.2 |
|
| 16-20 |
5030 |
9.8 |
5038 |
13.2 |
10068 |
11.2 |
1.0 |
|
| 21-24 |
2357 |
4.6 |
3778 |
9.9 |
6135 |
6.8 |
0.6 |
|
| 25-34 |
7456 |
14.5 |
3733 |
9.8 |
11188 |
12.5 |
2.0 |
|
| 35-44 |
7307 |
14.2 |
4818 |
12.6 |
12124 |
13.5 |
1.5 |
|
| 45-54 |
4355 |
8.5 |
3024 |
7.9 |
7379 |
8.2 |
1.4 |
|
| 55-64 |
3764 |
7.3 |
1266 |
3.3 |
5030 |
5.6 |
3.0 |
|
| 65-74 |
1374 |
2.7 |
1719 |
4.5 |
3093 |
3.5 |
0.8 |
|
| 75+ |
2121 |
4.1 |
1636 |
4.3 |
3757 |
4.2 |
1.3 |
|
| Total |
51520 |
|
38088 |
|
89608 |
|
1.4 |
|
| Total Collisions2 |
| Age <5 |
173 |
6.1 |
96 |
5.3 |
269 |
5.8 |
1.2 |
|
| 5-9 |
390 |
13.7 |
207 |
11.5 |
597 |
12.9 |
1.2 |
|
| 10-15 |
341 |
12.0 |
292 |
16.2 |
633 |
13.6 |
0.74 |
|
| 16-20 |
265 |
9.3 |
202 |
11.2 |
467 |
10.1 |
0.83 |
|
| 21-24 |
213 |
7.5 |
124 |
6.9 |
337 |
7.3 |
1.1 |
|
| 25-34 |
556 |
19.6 |
286 |
15.9 |
842 |
18.2 |
1.2 |
|
| 35-44 |
346 |
12.2 |
193 |
10.7 |
539 |
11.6 |
1.1 |
|
| 45-54 |
189 |
6.6 |
104 |
5.8 |
293 |
6.3 |
1.1 |
|
| 55-64 |
140 |
4.9 |
95 |
5.3 |
235 |
5.1 |
0.92 |
|
| 65-74 |
109 |
3.8 |
83 |
4.6 |
192 |
4.1 |
0.83 |
|
| 75+ |
120 |
4.2 |
115 |
6.4 |
235 |
5.1 |
0.66 |
|
| Total |
2842 |
|
1797 |
|
4639 |
|
1.6 |
|
1Source: Traffic Safety Facts 1994: Motor Vehicle Crash Data from FARS and GES National Highway Traffic Safety
Administration, US DOT, Washington, D.C., 1995.
2Source: Pedestrian and Bicycle Crash Types of the Early 1990s, Hunter, W., J. Stutts, W. Pein, C. Cox, UNC HSRC, FHWA-RD-95-163,
1996. |
|
| Figure 12. Pedestrian groups overrepresented in pedestrian crashes include males and children. Older adults are more
at risk for serious injury or death than younger pedestrians if struck by a motor vehicle. |
Table 9 shows a relationship of crash type to age of the collision-involved pedestrian. Certain crash types are overrepresented in certain age groups. Among the youngest age group shown here, 0-9 years old, the intersection dash and the midblock dash account for 41 and 55 percent, respectively, even though only 19 percent of all crashes affect children in this age group. For the 10-14-year-old category, the crash types most overrepresented are bus related (24 percent) and the intersection dash (23 percent), compared with 11 percent overall. For the oldest age group, backing vehicles seem to constitute the greatest risk (19 percent).
Special mention should be made of children in pedestrian crashes because of their particular vulnerability. One study (Dunne et al., 1992) asserts that parents overestimate their children's ability to handle street crossings. They overestimate what the children know and how well they will perform. The discrepancy between expectations and performance is greatest for the younger children (5 years old).
A German study reported that a significant portion of pedestrians younger than 6 years old and involved in a collision on the way to a playground were not accompanied by an adult (Kloeckner, et al., 1989). Injury severity was also greater in crashes involving unaccompanied children. Another study showed that children struck in a pedestrian collision that caused injury showed slightly poorer performance on a laboratory vigilance test than did a closely matched control group who were not in a collision (Pless et al., 1995).
Other factors of a more global, societal nature also are associated with a higher likelihood of a child's involvement in a pedestrian collision. One study reports that children are four-to-five times more likely to be in a pedestrian collision in poor neighborhoods compared with well-to-do neighborhoods (Cagley, 1992). Another study reported the statistical association of lower family cohesion with a higher risk of a child pedestrian crash (Christoffel, 1996).
Children's risk for a pedestrian collision reflect a number of factors, some of which can be addressed by a traffic engineer, while others are more properly addressed by various disciplines.
Table 9. Pedestrian crash types by age of pedestrian.
| |
PEDESTRIAN AGE* |
| Pedestrian Crash Type Subgroup |
0-9 |
10-14 |
15-19 |
20-24 |
25-44 |
45-64 |
65+ |
Bus related |
23.8 |
23.8 |
|
2.4 |
9.5 |
2.4 |
2.4 |
Other vehicle-specific |
37.5 |
13.6 |
3.4 |
4.6 |
21.6 |
8.0 |
11.4 |
Driverless vehicle |
13.7 |
1.4 |
6.8 |
9.6 |
37.0 |
16.4 |
15.1 |
Backing vehicle |
15.4 |
3.2 |
7.5 |
12.5 |
30.1 |
12.5 |
18.6 |
Disabled vehicle related |
2.5 |
1.7 |
7.6 |
14.4 |
53.4 |
15.3 |
5.1 |
Working/playing in road |
31.7 |
14.8 |
6.3 |
7.0 |
25.4 |
12.0 |
2.8 |
Walking along roadway |
1.3 |
6.9 |
17.4 |
14.3 |
43.7 |
11.5 |
4.9 |
Not in road |
14.3 |
10.0 |
13.4 |
9.4 |
30.6 |
12.0 |
10.3 |
Vehicle turning at intersection |
4.4 |
8.3 |
9.8 |
9.1 |
33.3 |
21.2 |
13.9 |
Intersection dash |
40.6 |
23.1 |
13.2 |
2.9 |
13.5 |
4.1 |
2.6 |
Driver violation at intersection |
7.9 |
13.0 |
11.1 |
9.1 |
33.6 |
11.1 |
14.2 |
Other intersection |
8.5 |
14.9 |
9.5 |
8.9 |
31.0 |
12.6 |
14.7 |
Midblock dart/dash |
55.2 |
16.2 |
6.0 |
4.1 |
12.5 |
2.9 |
3.2 |
Other midblock |
14.1 |
7.8 |
9.7 |
8.9 |
33.3 |
15.3 |
10.9 |
Miscellaneous |
4.1 |
7.5 |
18.5 |
14.6 |
40.3 |
9.4 |
5.5 |
ALL CRASHES |
18.7 |
11.1 |
10.9 |
9.0 |
29.7 |
11.4 |
9.2 |
*Row percnets. Cases with unknown age excluded.
Source: Pedestrian and Bicycle Crash Types of the Early 1990s Hunter, W., J. Stutts, W. Pein, C. Cox, UNC HSRC, FHWA-RD-95-163, 1996. |
B. GENDER
More males than females are seen in every single age category for fatal crashes (table 8). The ratio of male to female deaths varies from 3.6 to 1 in the 21 to 24 age group, down to 1.3 to 1 in the oldest age group. Despite the greater numbers of females compared to males in the 65+ age group, males slightly outnumber females in pedestrian fatalities; indicating that if the male and female populations in this age group were equal, the ratio of male to female fatalities would be even higher. Even in the youngest age group, pedestrians less than 5 years of age, the ratio of deaths among boys compared with girls is 1.7 to 1. In one study, boys were found to be involved in about twice as many pedestrian crashes as girls from 5 to 7 (AAA Pedestrian Safety Report 1984, 1977). Such differences between males and females have been observed for pedestrians as young as 2 years old. In an analysis of all pedestrian collisions in North Carolina for 1993, 1994, and 1995, crash records of 1,336 pedestrians were reviewed for those 12 years old or younger (Campbell, 1996). In this group, 61 percent were male. Even among 3-year-olds in pedestrian crashes, 62 percent were male; among 2-year-olds, 66 percent were males. Only for the 2-year-old and younger category (54 percent male) did the proportion approach the baseline proportion of males seen in birth statistics. This indicates the possibility of fundamental differences between the behavior of young boys and girls, and/or in the way they are supervised, even as toddlers.
The trends for pedestrian crashes by gender are somewhat different when looking at non-fatal injuries (table 8). The heavy preponderance of males is not seen in each and every category. Also, the 5-to-9 and 10-to-15 age categories account for a larger proportion of total injuries than any other age
categories, contrary to the trends seen when only fatalities are considered. For the sample of all crashes, female involvement is relatively greater. Males are overrepresented, and the degree of overrepresentation is greater in fatal crashes than in non-fatal crashes.
C. ALCOHOL
Studies have reported that alcohol impairment is a major problem for pedestrians and drivers. Most states have a statutory definition of driver impairment of 0.08 or 0.10 blood-alcohol concentration (BAC). While it is illegal to drive a motor vehicle with BACs of 0.10, there is no such prohibition for walking.
One study reported that from 1980 and 1989, between 37 and 44 percent of fatally injured pedestrians had BACs of 0.10 percent or greater (Alcohol Fatality Facts, 1990). These percentages were slightly lower than for fatalities involving passengers, vehicle operators, and motorcycle operators. Among adults pedestrians killed in 1989 nighttime collisions with motor vehicles, 59 percent had BACs of 0.10 percent or greater, while only 31 percent had no alcohol in their blood.
One Phoenix study showed that 29 percent of all pedestrians involved in collisions had been drinking, while only 4.4 percent of the drivers had been drinking before the collision (another 13 percent of these drivers had an "unknown" physical condition, likely due to "Hit and Run" [Cynecki, 1998]. Considering that many pedestrians are younger than legal drinking age, but most of the drivers are of legal drinking age, this difference is substantial.
The percentage of fatally injured pedestrians with high BACs (0.10 percent or more) did not decline during the 1980s. This contrasts a 20-percent decrease in high BACs for drivers during that period (Alcohol Fatality Facts, 1990; Williams and Lund, 1990).
A study of motor vehicle fatalities in North Carolina between 1972 and 1989 (figure 13) showed that between 42 and 61 percent of pedestrian fatalities involved pedestrians under the influence of alcohol (i.e., BAC of 0.10 percent or greater). This compared with the range of 53 to 64 percent of drivers of single-vehicle collisions who were under the influence. Among 176 fatally injured pedestrians tested in 1989 (Rehabilitation Alcohol Test, 1990), the following distribution was reported:
| Pedestrian fatalities |
Number of cases |
Percentage of total cases |
BACs of 0.10% or above |
81 |
46 |
BAC less than 0.10% but had been drinking |
5 |
3 |
No alcohol |
90 |
51 |
| Total |
176 |
100 |
|
| Figure 13. Studies have found that approximately half of pedestrian fatalities in motor vehicle crashes involve pedestrians under
the influence of alcohol. |
Alcohol and age are associated in pedestrian crashes (Zegeer et al., 1993). The North Carolina data shown in figure 14 are the distribution by age of pedestrians in all reported crashes involving use of alcohol.
The FARS data address alcohol use among fatally injured pedestrians, broken down by pedestrian age. Alcohol is most often present for pedestrians 25-44 years old, with the proportion declining for older pedestrian age categories. These findings indicate that part of the overall age distribution in pedestrian crashes is related to alcohol use, although the involvement of the elderly in fatal pedestrian crashes seems likely to be attributable to factors other than alcohol.
As might be expected, pedestrian sobriety is also related to crash type (Hunter, et al., 1996). As
seen in Table 10, 15.4 percent of all pedestrians in a collision were reported to be using alcohol or drugs before the collision. For certain crash types, however, the proportion is higher. For the crash type of walking along the roadway, the alcohol percentage for pedestrians is nearly double (29.6 percent). Adding to the significance of that figure is the fact that for drivers, the "walking along the road" crash type is likewise more frequent for drivers using alcohol or drugs (Hunter, et al., 1996).
|
Figure 14. Percent of crashes involving pedestrians drinking alcohol.
Source: Zegeer et al., 1993. |
Table 10. Pedestrian crash types by pedestrian sobriety.
| SOBRIETY* |
| Pedestrian Crash Type Subgroup |
No Alcohol or Drugs |
Alcohol or Drugs |
Other |
Bus-related |
97.1 |
2.9 |
0.0 |
Other vehicle-specific |
87.2 |
5.1 |
7.7 |
Driverless vehicle |
96.7 |
1.7 |
1.7 |
Backing vehicle |
85.6 |
10.8 |
3.6 |
Disabled vehicle related |
84.8 |
7.1 |
8.1 |
Working/playing in road |
97.5 |
0.8 |
1.7 |
Walking along roadway |
62.4 |
29.6 |
8.0 |
Not in road |
85.0 |
10.6 |
4.4 |
Vehicle turning at intersection |
91.1 |
5.3 |
3.6 |
Intersection dash |
86.0 |
9.0 |
5.0 |
Driver violation at intersection |
88.0 |
8.3 |
3.7 |
Other intersection |
70.5 |
23.0 |
6.5 |
Midblock dart/dash |
89.4 |
7.8 |
2.8 |
Other midblock |
61.9 |
30.6 |
7.5 |
Miscellaneous |
71.3 |
22.0 |
6.7 |
ALL CRASHES |
79.4 |
15.4 |
5.2 |
*Cases with unknown sobriety excluded.
Source: Pedestrian and Bicycle Crash Types of the Early 1990s, Hunter, W., J. Stutts, W. Pein, C. Cox, UNC HSRC, FHWA-RD-95-163, 1996. |
A 1992 study by Dickman and Cope (1992) reported on 4,329 injured pedestrians, of whom 2,109 (49 percent) had been drinking. The blood alcohol levels were:
| BAC level |
Number |
Percent of total |
0 |
2,220 |
51.2 |
0.01 - 0.099% |
586 |
13.6 |
0.10 - 0.199% |
486 |
11.2 |
0.20 - 0.299 |
686 |
15.9 |
0.30 or higher |
351 |
8.1 |
A substantial proportion of those who had been drinking had seriously elevated BACs. Not only is alcohol use by pedestrians a significant factor associated with involvement in a crash, but it is also reported that excessive amounts of alcohol significantly increased the likelihood that death will result from the collision (Miles-Doan, 1996).
D. VEHICLE TYPE
Another factor related to the "who" of pedestrian crashes is vehicle type. In a NHTSA report (Traffic Safety Facts, 1995, table 93), pedestrian collision percentages with regard to vehicle type are:
| Vehicle Type |
Pedestrians Killed |
Pedestrians Injured |
Passenger car |
55.8% |
76.5% |
Light truck |
29.2% |
20.0% |
Other (including motor-cycles & heavy trucks) |
15.0% |
3.5% |
| |
100% |
100% |
Light trucks as well as the "other" vehicle classes are more often represented in fatal pedestrian crashes than in injury crashes.
E. SUMMARY: WHO IS INVOLVED IN PEDESTRIAN COLLISIONS?
- The largest percentage of pedestrian fatalities falls into the 25-44 age category
- However, when fatalities per 100,000 population is calculated, the oldest age category stands
out higher than the rest.
- Nevertheless, compared with their proportion in the U.S. population, children and young adults
ages 2-22 are overrepresented in terms of pedestrian deaths and injuries.
- More male than female fatalities are seen in every age category.
- Even in the youngest age group, pedestrians less than 5 years of age, the population pedestrian
death rate for males is 1.7 times greater than females, and males outnumber females in pedestrian collisions at the age of 2.
- Alcohol is an important factor in pedestrian crashes. A North Carolina study showed that between 42 and 61 percent of fatally-injured pedestrians had BAC
levels of 0.10 or greater. There is some indication that pedestrians who have been drinking pose a greater threat to pedestrian safety than do drinking drivers.
- Light trucks and "other" vehicles (e.g., heavy trucks) are overrepresented in pedestrian
fatalities.
Where Do Pedestrian Collisions Occur?
A. RURAL VERSUS URBAN
The rural/urban distribution of pedestrian crashes is given in table 11, based on estimates by the NSC (Accident Facts, 1994). Of the estimated 71,200 pedestrian collisions in the United States in 1993, 75 percent occurred in urban areas, where pedestrian traffic is much higher than in rural areas. The table also shows that rural areas account for only 23.1 percent of nonfatal injury pedestrian crashes, but 45.2 percent of fatal pedestrian crashes. The overrepresentation of fatalities in rural areas is most likely because of the higher speeds and more severe crash types in rural areas.
Table 11. Pedestrian injuries and fatalities by area type.
| Area Type |
Non-fatal Injury |
Fatal |
Totals |
| Number |
Percent (Raw %) |
Number |
Percent (Raw %) |
Number |
Percent (Raw %) |
| Rural Urban |
15,000 50,000 |
23.1 76.9 |
2,800 3,400 |
45.2 54.8 |
17,800 53,400 |
25.0 75.0 |
| Totals |
65,000 |
100.0 |
6,200 |
100.0 |
71,200 |
100.0 |
| Source: Crash Facts, 1994 |
|
|
Figure 15. Rural areas account for 23.1 percent of non-fatal injury pedestrian crashes, but 45.2 percent of pedestrian deaths.
|
B. LAND USE
Several studies that categorized pedestrian crashes by land use are summarized below:
Thirteen major cities (Snyder and Knoblauch, 1971)
Sample - 2,100 pedestrian crashes
| Place |
Perecent of Crashes |
Central business district |
1 |
Residential area |
50 |
Mixed commercial |
7 |
Commercial area |
40 |
School area |
2 |
Wayne County, MI (Davis and Huelke, 1969) Sample - 268 Fatal pedestrian crashes
| Place |
Perecent of Crashes |
Shopping business area |
58 |
Residential area |
29 |
School area |
2 |
Expressway area |
2 |
Other |
9 |
Rural and suburban area sample (Knoblauch, 1977)
| Place |
Perecent of Crashes |
Residential area |
50 |
Commercial area |
24 |
Open area |
16 |
School area |
7 |
Other |
3 |
Tucson, AZ (Nizlek, 1984)
| Place |
Perecent of Crashes |
Business area |
60 |
Residential area |
37 |
School crossing |
1 |
Other |
1 |
The four studies vary in definition of categories and outcome, but they are similar in the prominence of pedestrian crashes in residential and commercial areas where most pedestrian exposure
occurs.
C. TRAFFIC CONTROL BY CRASH TYPE
Another way of describing pedestrian crashes is by the nature of any traffic control present at the
pedestrian crash site. Table 12 is based on the aforementioned 1992 sample of 4,329 pedestrian crashes of all kinds (Diekman and Cope, 1992), and the following overall distribution is seen with respect to traffic controls:
| Traffic Control Type |
Percent of Pedestrian Collisions |
No traffic control |
74.4 |
Stop sign |
7.0 |
Traffic signal |
17.3 |
Other |
1.4 |
| |
100 |
Specific types of crashes markedly depart from the above distribution. Thus, whereas 74 percent of pedestrian crashes happen where there is no traffic control, the value is 96 percent for crashes involving walking along the roadway. On the other hand, only 15.5 percent of pedestrian crashes that involve turning at an intersection occur where there is no traffic control (as compared with 74 percent overall). Overall, 7 percent of pedestrian crashes occur where a stop sign is the traffic control, but for vehicles turning at an intersection, the value is higher at 20 percent. As a final example, 17.3 percent of all pedestrian crashes occur at signalized locations, but the value is 63 percent for crashes involving vehicles turning at an intersection. Thus, a strong association with crash type accompanies the overall distribution of pedestrian crashes with respect to traffic control types.
Table 12. Pedestrian crash types by traffic control.
| |
TRAFFIC CONTROL* |
|---|
| Pedestrian crash type |
No control |
Stop sign |
Traffic signal |
Other traffic control** |
Bus-related |
79.1 |
11.6 |
9.3 |
0.0 |
Other vehicle specific |
90.6 |
4.7 |
4.7 |
0.0 |
Driverless vehicle |
97.6 |
1.2 |
1.2 |
0.0 |
Backing vehicle |
96.1 |
1.1 |
2.2 |
0.7 |
Disabled vehicle related |
87.3 |
2.5 |
7.6 |
2.5 |
Working/playing in road |
77.9 |
8.6 |
5.0 |
8.6 |
Walking along roadway |
96.1 |
2.1 |
1.3 |
0.5 |
Not in road |
94.3 |
3.1 |
0.9 |
1.7 |
Vehicle turning at intersection |
15.5 |
20.0 |
63.3 |
1.2 |
Intersection dash |
66.0 |
9.8 |
24.0 |
0.3 |
Driver violation at intersection |
38.8 |
24.7 |
34.1 |
2.4 |
Other intersection |
47.5 |
9.6 |
42.2 |
0.6 |
Midblock dart/dash |
94.4 |
1.9 |
2.9 |
0.8 |
Other midblock |
91.1 |
1.0 |
6.6 |
1.4 |
Miscellaneous |
85.0 |
5.3 |
7.2 |
2.5 |
ALL CRASHES |
74.4 |
7.0 |
17.3 |
1.4 |
*Cases with unknown traffic control excluded.
**Flashing signal, yield sign, railroad crossing, official flagger.
Source: Pedestrian and Bicycle Crash Types of the Early 1990s, Hunter,
W., J. Stutts, W. Pein, C. Cox, UNC HSRC, FHWA-RD-95-163, 1996. |
SPEED LIMIT BY CRASH TYPE
Table 13 shows pedestrian crashes according to the speed limit posted where the collision took place. The posted speed limit is certainly not a perfect indication of the actual speed at which a collision may occur. The overall distribution is:
| Speed Limit |
Percent Pedestrian Crashes |
Speed limit to 40 km/h |
27.0 |
48-56 km/h |
46.9 |
64-73 km/h |
14.3 |
81 km/h or greater |
118.0 |
| |
100 |
Table 13. Pedestrian crash types by speed limit.
|
SPEED LIMIT* |
|---|
| Pedestrian Crash Type |
< 40 km/h |
48 to 56 km/h |
64 to 73 km/h |
81+ km/h |
Bus related |
23.7 |
68.4 |
5.3 |
2.6 |
Other vehicle specific |
44.9 |
38.5 |
6.4 |
10.3 |
Driverless vehicle* |
45.7 |
30.4 |
0.0 |
23.9 |
Backing vehicle** |
50.0 |
38.7 |
2.8 |
8.5 |
Disabled vehicle related |
4.7 |
24.3 |
16.8 |
54.2 |
Working/playing in road |
39.2 |
36.8 |
8.0 |
16.0 |
Walking along roadway |
14.3 |
32.7 |
16.2 |
36.8 |
Vehicle turning at intersection |
20.8 |
65.8 |
11.9 |
1.6 |
Intersection dash |
24.0 |
54.8 |
17.4 |
3.7 |
Driver violation at intersection |
32.1 |
56.7 |
10.3 |
0.9 |
Other intersection |
18.0 |
56.4 |
20.4 |
5.2 |
Midblock dart/dash |
34.7 |
41.8 |
14.7 |
8.8 |
Other midblock |
21.7 |
47.4 |
19.2 |
11.8 |
Miscellaneous |
30.1 |
40.6 |
12.0 |
17.4 |
ALL CRASHES |
27.0 |
46.9 |
14.3 |
11.8 |
*Cases with unknown speed limit excluded.
Source: Pedestrian and Bicycle Crash Types of the Early 1990s Hunter, W., J. Stutts. W. Pein, C. Cox, UNC HSRC, FHWA-RD-95-163, 1996. |
Some specific crash types markedly differ from this breakdown. Pedestrian crashes involving a backing vehicle are higher on roads with low speed limits than overall (50 percent versus 27 percent). In contrast, for pedestrian crashes involving walking in the roadway, sites with higher speed limits account for more than expected (37 percent versus 12 percent), with a correspondingly smaller proportion at the lower speed limit sites (14 percent versus 27 percent).
|
Figure 16. Pedestrian crashes (fatal and nonfatal) by age and intersection vs. nonintersection.
Source: General Estimates
System, NHTSA, 1990. |
|
| Figure 17. In U.S. cities, most pedestrian crashes occur at places other than intersections. |
E. INTERSECTION VERSUS NON-INTERSECTION
Almost 60 percent of U.S. urban pedestrian crashes occur at places other than intersections. In rural areas, the figure is closer to 67 percent. When considering fatalities, the proportion remains essentially the same in urban areas. In rural areas, approximately 85 percent of the deaths occur at places other than intersections (Accident Facts, 1988).
A 1977 survey of child pedestrian crashes in more than 1,900 cities indicated that approximately 75 percent occurred at non-intersection locations. This increases to between 80 and 90 percent for the 5-year-old-and-under age group (AAA Pedestrian Safety Report, 1984). This high percentage is likely associated in part with the high incidence of young children running into the street at midblock locations.
A 1989 summary of pedestrian injuries and deaths by age was estimated by NHTSA for intersections and nonintersections. As illustrated in figure 16, a majority of crashes involving pedestrians up to age 44 occurs at nonintersections. For ages 45-64, there almost is an equal number of pedestrian crashes at intersections and nonintersections. For pedestrians age 65 and older, the trend reverses, and more are struck at intersections than at nonintersections. Although only limited pedestrian behavioral and survey data are available concerning choice of crossing locations, older pedestrians generally are more likely to cross at intersections than are younger ones (General Estimates System, 1990).
F. SUMMARY: WHERE DO PEDESTRIAN COLLISIONS OCCUR?
One study showed that about 85 percent of pedestrian collisions occur in urban areas and about 15
percent in rural areas. However, 25 percent of fatal pedestrian crashes occur in rural areas,
reflecting the generally more severe character of pedestrian collisions outside urban areas. Another study of pedestrian crashes showed a breakdown of 68 percent urban and 32 percent
rural. In this study, certain crash types were overrepresented in some categories. In rural areas,
pedestrians walking along the road were overrepresented. In urban areas, pedestrian crashes
associated with driver violations at an intersection were overrepresented. Overall, 74 percent of pedestrian crashes occur where there is no traffic control, 7 percent where there is a stop sign, and 17 percent in the presence of a traffic signal. However, this breakdown greatly varies by crash type. When pedestrian crashes involve a vehicle turning at an intersection,
63 percent occur where there is a traffic light, versus 17 percent overall. With respect to speed limits, most pedestrian crashes occur where speed limits are low or
moderate. Though most pedestrian crashes occur in urban areas, 60 percent of all pedestrian crashes in urban
areas do not occur at intersections. This compares to 75 percent of child pedestrian crashes which
occur not at an intersection. The percentage that do occur at intersections varies by crash type.
Age is also a variable of importance, with 75 percent of child pedestrian crashes not at
intersections, contrasting with the majority of the elderly that do occur at intersections.
How Do Pedestrian Collisions Occur?
A. CONTRIBUTING FACTORS
A considerable number of factors, singly or in combination, increase the likelihood of a pedestrian collision. Table 14 shows the breakdown of a series of contributing factors related to 5,073 pedestrians involved in crashes (Hunter, et al., 1996). These are shown in four groups:
Pedestrian contributing factors
Roadway/environment factors
Driver contributing factors
Vehicle factors.
It is noteworthy that for each of the four major data groupings, the largest single category is "None indicated." Thus, despite numerous categories for assigning crashes, an appreciable portion of crashes defy such categorization. (This is all the more noteworthy because a main purpose of Hunter's study was to categorize pedestrian crashes.)
With respect to "Pedestrian Factors", the largest single category is "ran into road." Yet this category accounts for only 15 percent of collisions. Many other contributing factors are cited, but each is identified in only a small percent of cases. The largest specific "Roadway Factor" is "vision obstruction" (11 percent). For drivers, the largest category is "failure to yield right-of-way."
"Hit and run" is a somewhat larger category in the driver group, but such a classification tells nothing about the driver's actions that contributed to the crash, only that unlawful flight took place afterwards. Some characteristics of the hit-and-run situation are presented for fatal crashes in a 1995 study (Solnick and Hemenway, 1995). The authors examined the FARS database for 1989-1991 and listed factors that were over- or underrepresented in fatal hit-and-run situations. Overall, 20 percent of drivers left the scene:
| Hit and run was less likely when: victim was a child or was elderly |
| Hit and run was more likely when: crash was in an urban area |
| |
crash was outside of southern U.S.
crash was at night or on a weekend
driver was male
driver was drunk
driver had a
bad past driving record |
Vehicle factors are cited in only 12 percent of the cases. Because numerous factors can contribute to pedestrian collisions, and because each individual factor accounts for only a small portion of the crash total, a successful pedestrian collision prevention program must pursue many different countermeasures. Only a small portion of total collisions will be reduced by any given countermeasure.
Table 14. Factors contributing to pedestrian collisions.
| Pedestrian Contributing Factors |
N |
%1 |
Driver Contributing Factors |
N |
% |
| None indicated |
1719 |
33.9 |
None indicated |
2263 |
44.6 |
| Jaywalking (near intersection) |
157 |
3.1 |
Hit and run |
824 |
16.2 |
| Ran into road |
763 |
15.0 |
Exceeding safe speed |
225 |
4.4 |
| Stepped into road |
207 |
4.1 |
Exceeding speed limit |
87 |
1.7 |
| Stepped from between parked vehicles |
360 |
7.1 |
Reckless driving
Failure to yield to ped. |
171
762 |
3.4
15.0 |
| Failed to yield |
599 |
11.8 |
Failure to signal |
4 |
0.1 |
| Failed to obey signal |
151 |
3.0 |
Ignored traffic sign |
26 |
0.5 |
| Unsafe movement |
127 |
2.5 |
Ignored traffic signal |
50 |
0.1 |
| Alcohol impaired |
524 |
10.3 |
Avoiding veh./ped./obj. |
25 |
0.5 |
| Drug impaired |
20 |
0.4 |
Safe movement |
243 |
4.8 |
| Vision/hearing impaired |
32 |
0.4 |
Improper backing |
285 |
5.6 |
| Other physical disability |
13 |
0.3 |
Improper passing |
36 |
0.7 |
| Other mental disability |
19 |
0.4 |
Improper turning |
40 |
0.8 |
| Walk/run wrong direction |
267 |
5.3 |
Right turn on red |
84 |
1.7 |
| Talking/standing in road |
158 |
3.1 |
Wrong direction |
24 |
0.5 |
| Lying in road |
32 |
0.6 |
Improper lane use |
35 |
0.7 |
| Playing in road |
78 |
1.5 |
Changing lanes |
6 |
0.1 |
| Jogging in road |
15 |
0.3 |
Pass stopped school bus |
9 |
0.2 |
| Unsafe skateboard maneuver |
13 |
0.3 |
Improper parking |
6 |
0.1 |
| Unsafe rollerblade maneuver |
6 |
0.1 |
Fail to secure gear in park |
93 |
1.8 |
| Lack of conspicuity |
147 |
2.9 |
Left engine running |
12 |
0.2 |
| Unsafe enter/exit of vehicle |
37 |
0.7 |
Alcohol impairment |
157 |
3.1 |
| Fell from truck bed |
1 |
0.0 |
Drug impairment |
3 |
0.1 |
| Working on parked car |
50 |
1.0 |
Illness |
5 |
0.1 |
| Leaning/clinging to vehicle |
82 |
1.6 |
Drowsy/fell asleep |
4 |
0.1 |
| Pushing disabled vehicle |
6 |
0.1 |
Other physical
impairment |
14 |
0.3 |
| Other |
72 |
1.4 |
Inattention/distraction |
213 |
4.2 |
| Unknown |
113 |
2.2 |
No driver's license
Inexperience |
70
21 |
1.4
0.4 |
| Roadway/Environment Factors |
|
|
Restriction non-compliance |
3 |
0.1 |
| None indicated |
3801 |
74.9 |
Improper vehicle equipment |
9 |
0.2 |
| Sun glare |
53 |
1.0 |
Assault by vehicle |
63 |
1.2 |
| Other glare |
25 |
0.5 |
No lights |
5 |
0.1 |
| Dusk/darkness |
162 |
3.2 |
Police pursuit |
5 |
0.1 |
| Vision blockage |
539 |
10.6 |
Failed to secure cargo
|
2 |
0.0 |
| Construction zone |
56 |
1.1 |
Other |
72 |
1.4 |
| Glass/debris/etc. |
7 |
0.1 |
Unknown |
96 |
1.9 |
| Pothole/grate/etc. |
8 |
0.2 |
|
|
|
| Narrow roadway |
2 |
0.0 |
Vehicle Factors |
|
|
| Other |
330 |
8.5 |
None indicated |
4507 |
88.8 |
| Unknown |
36 |
0.7 |
No inspection sticker
Oversized vehicle/load
Extended mirror
Defective brakes
Defective lights
Defective tires
Foggy/dirty windshield
Other
Unknown |
2
4
19
15
4
12
16
42
457 |
0.0
0.1
0.4
0.3
0.1
0.2
0.3
0.8
9.0 |
1N = 5073 (total number pedestrian cases with contributing factors). Since up to 3 factors could be coded in each category,
the percentages add to more than 100.
Source: Pedestrian and Bicycle Crash Types of the Early 1990s, Hunter, W., J. Stutts, W. Pein, C.
Cox, C. UNC HSRC, FHWA-RD-95-163, 1996. |
Table 15 shows a breakdown of who was primarily responsible for causing a pedestrian collision according to a study that reported that police ascribe fault to the pedestrian in 43 percent of cases and to drivers in 35 percent (Hunter et al., 1996). These are only the overall values, however. In specific circumstances the results vary, as shown in table 16. For example, though drivers are at fault in about 35 percent of the situations overall, the figure is 88 percent for driver violations at intersections, and 79 percent in situations involving vehicles turning at an intersection. Drivers alone are at fault in as few as 18 percent of crashes involving pedestrians walking along the roadway, but are at least partially at fault in another 35 percent of these collisions.
Table 15. Pedestrian crash fault.
| |
N |
Percent |
| Pedestrian only |
2189 |
43.2 |
| Ped. (Driver fault unknown) |
170 |
3.4 |
| Driver only |
1764 |
34.8 |
| Driver (Ped fault unknown) |
104 |
2.1 |
| Both ped. and driver |
633 |
12.5 |
| Neither ped. nor driver |
50 |
1.0 |
| Both unknown, unable to determine |
163 |
3.2 |
| Total |
5,073 |
100.2 |
| Source: Pedestrian and Bicycle Crash Types of the Early 1990s, Hunter, W. J. Stutts, W. Pein, C. Cox,UNC HSRC, FHWA-RD-95-163,1996. |
|
|
Figure 18. Pedestrian running into the road without looking are a factor in approximately 15 percent of pedestrians collisions.
|
When the pedestrian alone is at fault (43 percent of cases overall), the situation varies by crash type. When a vehicle is backing, the pedestrian is adjudged at fault only 10 percent of the time, but in an intersection or midblock dash, the pedestrian is adjudged at fault 91 percent of the time.
Table 16. Pedestrian crash types by party at fault (N=5,073).
| |
FAULT* |
|---|
| Pedestrian Crash Type Subgroup |
Driver Only |
Driver; Pedestrian Unknown |
Pedestrian Only |
Pedestrian; Driver Unknown |
Both |
Neither |
Unknown |
| Bus-related |
34.1 |
0.0 |
50.0 |
2.3 |
9.1 |
2.3 |
2.3 |
| Other vehicle specific |
21.3 |
4.3 |
45.7 |
6.4 |
20.2 |
0.0 |
2.1 |
| Backing vehicle |
67.8 |
3.7 |
10.3 |
0.3 |
13.4 |
0.6 |
4.0 |
| Disabled vehicle related |
62.9 |
0.8 |
8.9 |
3.2 |
21.0 |
1.6 |
1.6 |
| Working/playing in road |
36.8 |
0.7 |
50.7 |
2.6 |
6.6 |
0.0 |
2.6 |
| Walking along roadway |
18.0 |
2.8 |
28.8 |
12.8 |
34.5 |
0.2 |
3.0 |
| Ped. not in road |
61.0 |
3.2 |
22.0 |
0.7 |
8.3 |
0.9 |
3.9 |
| Vehicle turning at intersection |
79.1 |
1.8 |
9.3 |
0.6 |
6.8 |
0.2 |
2.2 |
| Intersection dash |
0.6 |
0.0 |
90.6 |
2.2 |
6.6 |
0.0 |
0.0 |
| Driver violation at intersection |
87.6 |
3.9 |
0.4 |
0.4 |
6.6 |
0.0 |
1.2 |
| Other intersection |
12.6 |
3.3 |
59.5 |
5.5 |
11.4 |
0.4 |
7.3 |
| Midblock dart/dash |
1.0 |
0.2 |
91.8 |
1.8 |
5.0 |
0.2 |
0.0 |
| Other midblock |
11.5 |
2.2 |
60.4 |
5.3 |
16.0 |
0.5 |
4.1 |
| Miscellaneous |
39.3 |
2.0 |
21.7 |
3.3 |
18.9 |
7.1 |
7.8 |
| ALL CRASHES |
34.8 |
2.1 |
43.2 |
3.4 |
12.5 |
1.0 |
3.2 |
*Cases with unknown fault excluded.
Source: Pedestrian and Bicycle Crash Types of the Early 1990s, Hunter, W. J. Stutts, W. Pein, C. Cox, UNC HSRC, FHWA-RD-95-163, 1996. |
B. CRASH TYPES AND CAUSAL BEHAVIOR
Several major U.S. studies of pedestrian behavior were based on field observations, on interviews with pedestrian safety professionals, and on data from collision reports (AAA Pedestrian Safety Report, 1984; Rehabilitation Alcohol, 1990; Accident Facts, 1988). These studies categorized crash types for urban, rural, and freeway locations as shown in Tables 17, 18, and 19 (Model Pedestrian User's Manual, 1987 edition, Knoblauch, 1975; Knoblauch, 1977; and Knoblauch, 1978). The objective of these studies was to identify crash causes and to develop countermeasures.
Another source of information is a study of freeway pedestrian crashes (Knoblauch et al., 1978), which examined driver and pedestrian activities leading to freeway pedestrian crashes. Table 20 gives the percentages of various driver activities preceding the crash, such as going straight, driving off the road, etc. The percentage distribution of pedestrian activities, such as running across the freeway, standing next to a disabled vehicle, etc., is in table 21.
Table 17. Urban pedestrian collision types and critical behavior descriptors (N=2,044).
| Collision Type |
Percent of Collisions Studied |
Location and/or Critical Behavioral Descriptors |
| Dart out (first half) |
23 |
Midblock (not at intersection).
Pedestrian sudden appearance and short time exposure.
Driver has no time to react to avoid collision.
Pedestrian crossed less than halfway. |
| Dart out (second half) |
9 |
Same as above except pedestrian gets more than halfway across before being struck. |
| Midblock dash |
7 |
Midblock (not at intersection).
Pedestrian running but not sudden appearance or short-term exposure as above. |
| Intersection dash |
12 |
Intersection.
Short time exposure or running.
Same as “dart out” except occurs at intersection. |
| Vehicle turn merge with attention conflict |
4 |
Intersection or vehicle merge location.
Vehicle turning or merging into traffic.
Driver attending to auto traffic in one direction collides with pedestrian located in direction different from driver's attention. |
| Turning vehicle |
5 |
Intersection or vehicle merge location.
Vehicle turning or merging into traffic.
Driver attention not documented.
Pedestrian not running. |
| Multiple threat |
3 |
One or more vehicles stop in traffic lane (e.g., lane 1) for pedestrian. Pedestrian hit stepping into parallel same directiontraffic lane (e.g.,
Lane 2) by vehicle moving in same direction as stopped vehicle.
Collision vehicle driver's vision of pedestrian obstructed by stopped vehicle. |
| Bus stop related |
2 |
At bus stop.
Pedestrian steps out from in front of bus at bus stop and is struck by vehicle moving in same direction as bus while passing bus.
Same as "
multiple threat" except stopped vehicle is bus at bus stop. |
| Vendor, ice cream truck |
2 |
Pedestrian struck while going to or from vendor in vehicle on street. |
| Disabled vehicle
related |
2 |
Pedestrian struck while working on or next to disabled vehicle. |
| Result of vehicle- vehicle crash |
3 |
Pedestrian hit by vehicle(s) as result of vehicle-vehicle collision |
| Trapped |
1 |
Signalized intersection.
Pedestrian hit when traffic light turned red (for pedestrian) and cross-traffic vehicles started moving. |
| Source: Knoblauch, 1975 and Model Pedestrian User's Manual, 1987 edition. |
Table 18. Rural pedestrian collision types and critical behavior descriptors (N=1,750).
| Collision Type |
Percent of Collisions Studied |
Location and/or Critical Behavioral Descriptors |
| Dart out (first half) |
11 |
Pedestrian sudden appearance, short time exposure.
Driver does not have time to react to avoid collision.
Pedestrian crossed less than halfway. |
| Dart out (second half) |
10 |
Same as above except pedestrian more than halfway across before being struck. |
| Midblock dash |
10 |
Midblock (not at intersection).
Pedestrian running but not sudden appearance or short-term exposure as above. |
| Intersection dash |
10 |
Intersection.
Short time exposure or running.
Same as "dart out" except occurs at intersection. |
| Vehicle turn merge with attention conflict |
1 |
Intersection or vehicle merge location.
Vehicle is turning or merging into traffic.
Driver attending to auto traffic in one direction
collides with pedestrian located in different direction than that of driver's attention. |
| Turning vehicle |
2 |
Intersection or vehicle merge location.
Vehicle turning or merging into traffic.
Driver attention not documented.
Pedestrian not running. |
| Multiple threat |
2 |
One or more vehicles stop in traffic lane (e.g., Lane 1) for pedestrian.
Pedestrian hit stepping into next parallel same direction traffic lane (e.g., Lane 2) by vehicle going in same
direction as stopped vehicle.
Collision vehicle driver's vision of pedestrian obstructed by stopped vehicle. |
| School bus related |
3 |
Pedestrian hit while going to or from school bus or
school bus stop. |
| Vendor, ice cream truck |
1 |
Pedestrian struck while going to or from vendor in vehicle on street. |
| Disabled vehicle related |
6 |
Pedestrian struck while working on or next to disabled vehicle. |
| Result of vehicle-vehicle crash |
1 |
Pedestrian hit by vehicle(s) as result of vehicle-vehicle collision |
| Backing up |
2 |
Pedestrian hit by vehicle backing up. |
| Walking along roadway |
12 |
Pedestrian struck while walking along edge of highway
or on shoulder.
Can be walking facing or in same direction as traffic. |
| Hitchhiking |
2 |
Pedestrian hit while attempting to thumb ride. |
| Weird |
8 |
Unusual circumstances.
Not countermeasure corrective. |
| Source: Knoblauch, 1977 and Model Pedestrian User's Manual, 1987 edition. |
Table 19. Freeway pedestrian collision types and critical behavior descriptors (N=236).
| Collision Type |
Percent of Collisions Studied |
Location and/or Critical Behavioral Descriptors |
| Disabled vehicle related |
20 |
Pedestrian struck while working on or next to disabled vehicle. |
| Result of vehicle-vehicle crash |
10 |
Pedestrian hit by vehicle(s) as result of vehicle-vehicle collision. |
| Weird |
10 |
Unusual circumstances.
Not countermeasure corrective. |
| Hitchhiking |
9 |
Pedestrian hit while attempting to thumb ride. |
| Walking to/from disabled vehicle |
8 |
Pedestrian struck while walking along edge or
shoulder of highway.
Reason for walking because of disabled vehicle.
Can be walking facing or in same direction as traffic. |
| Dart out |
5 |
Not at interchange.
Pedestrian sudden appearance and short time exposure.
Driver does not have time to react to avoid collision. |
| Walking along roadway |
5 |
Pedestrian struck while walking along edge of
highway or on shoulder.
Can be walking facing or in same direction as traffic. |
| Working on roadway |
3 |
Pedestrian (flagperson or other construction worker)
struck while working on roadway or shoulder. |
| Midblock dash |
* |
Not at interchange.
Pedestrian running but not sudden appearance or short
time exposure. |
| Vehicle turn-merge with attention conflict |
* |
Vehicle merge location.
Vehicle merging into traffic.
Driver attending to auto traffic in one direction
collides with pedestrian located in different direction than that of driver's attention. |
| Turning vehicle |
* |
Vehicle merge location.
Vehicle merging into traffic.
Driver attention notdocumented.
Pedestrian notrunning. |
*Less than 1 percent.
Source: Knoblauch, 1978 and Model Pedestrian User's Manual, 1987 Edition.
|
A 1980 study by Habib identified causal factors related to pedestrian crashes at intersection crosswalks and recommended possible solutions. While 51.4 percent of such pedestrian crashes in Habib's study involved a through vehicle, left-turn vehicle maneuvers were involved twice as often as right-turn crash maneuvers (24.8 percent vs. 13.1 percent). The left-turn maneuver was nearly four times as hazardous as the through-movement in terms of collisions and exposure. Also, driver error was found to increase when the left-turn movement was made as compared with right-turn maneuvers. Factors identified as contributing to the left-turn crashes with pedestrians include driver visibility problems, poor driver habits, and signal location.
Table 20. Driver activity leading to pedestrian collisions on freeways (N=236).
| Percent of Pedestrian Collisions |
Driver Activity |
| 51 |
Going straight and/or sustaining speed |
| 15 |
Driving off traveled way or out of control |
| 9 |
Decelerating |
| 8 |
Unknown |
| 4 |
Other |
| 3 |
Changing lanes |
| 3 |
Speeding |
| 1 |
Negotiating curve |
| 1 |
Starting from stopped position |
| 1 |
Backing up |
| 1 |
Passing |
| 1 |
Merging |
| Source: Knoblauch et al., 1978. |
Table 21. Pedestrian activity leading to pedestrian collisions on freeways (N=236).
| Percent of Pedestrian Collisions |
Pedestrian Activity |
| 21 |
Crossing, running |
| 11 |
Standing next to a disabled vehicle |
| 10 |
Crossing, walking |
| 10 |
Working on a vehicle |
| 10 |
Other |
| 8 |
Walking with traffic |
| 6 |
Standing |
| 5 |
Flagging vehicle |
| 4 |
Crossing, not further specified |
| 3 |
Entering or exiting vehicle |
| 3 |
Pushing vehicle |
| 3 |
Unknown |
| 2 |
Sitting or lying down |
| 2 |
Walking against traffic |
| 1 |
Working on roadway |
| Source: Knoblauch et al., 1978. |
Obviously, a left-turning driver has a complex task. Oncoming traffic must be monitored to identify a safe gap to permit the turn. Traffic coming up from behind is also factor in the safety of the left-turning driver (risk of turning vehicle's being struck from rear). Add to this the necessity to monitor pedestrian traffic at the left of the driver's field of view and it is easy to realize that the left turn is a high demand situation for the driver. Solutions proposed by Habib include changes in vehicle design to improve driver visibility, location of an additional signal mounted on the left far-side of the sidewalk, improved crosswalk illumination, and driver education concerning the problem.
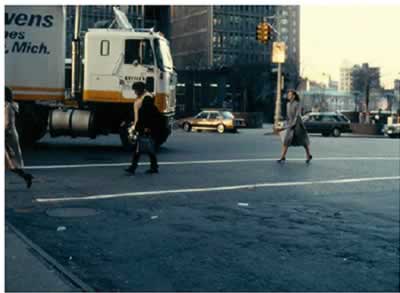
|
| Figure 19. Turning vehicles pose a particular threat to pedestrians at intersections. |
A study of the causes of pedestrian collisions in Arizona by Matthias and Stonex (1985) found that urban pedestrian collisions and fatalities tended to occur on wide, high-speed arterial streets. Causes of approximately half of the pedestrian collisions were failure to yield by the driver or pedestrian and failure to use the crosswalk. The authors concluded that there was little in the way of engineering countermeasures that would be useful. They indicated that public education, particularly for children under 14 years of age, appeared to be the most useful countermeasure.
Many factors characterize pedestrian crashes. Some lend themselves to traffic engineering intervention to improve safety, but others are associated with general societal characteristics and generally beyond the traffic engineer's influence. For example, the 1990 Nationwide Personal Transportation Survey (Antonakos, 1995) characterized pedestrians as: slightly lower in socioeconomic status; less likely to be employed; less likely to own a motor vehicle; and less likely to be licensed to drive a motor vehicle.
Still, almost no one can avoid occasional pedestrian status.
C. SUMMARY: HOW DO PEDESTRIAN CRASHES OCCUR?
Many factors contribute to a pedestrian crash, but each contributes only a small portion to the
crash totals. Any given crash-prevention measure, targeted to any one crash factor, is likely
to produce only a small improvement overall. It is reported that pedestrians are solely responsible for causing 43 percent of collisions and
drivers solely responsible for 35 percent of collisions. The remainder have multiple causes or
are caused by unknown factors. Culpability varies by crash type, as would be expected. For crashes involving a midblock
dash, pedestrians are judged at fault most of the time. Driver culpability is rated high for
pedestrian crashes involving vehicles turning at an intersection.
How Severe Are Pedestrian Collisions?
A. FINDINGS
Although many pedestrians are killed in motor vehicle collisions, most pedestrian collisions do not result in fatal injuries, in spite of pedestrians' vulnerability in a collision with a 908-kg or 2000-lb rigid motor vehicle. Data from NHTSA (Traffic Safety Facts, 1995) show that in 1994 there were:
| Pedestrian deaths |
5,472 |
| Incapacitating injuries |
22,000 |
| Not incapacitating injuries |
30,000 |
| Other injuries |
38,000 |
Other data sources indicate that, in some pedestrian crashes, the police report indicates that the pedestrian is not injured. The injury scale shown here is one used by many police departments. The five-category scale is shown below along with the injury distribution reported by Hunter et al., 1996, who reported on 5,073 pedestrian crashes.
| |
Percent |
| No injury |
3 |
| "C" Injury (minor) |
29 |
| "B" Injury (moderate) |
35 |
| "A" Injury (severe) |
27 |
| Fatal |
6 |
Table 22 shows how this injury distribution differs according to type of crash. Note the crash type categories that indicate most and least severe injuries. As to the fatal category, the greatest risk is “Walking along the roadway” (13.3 percent versus 6.1 percent fatal overall). At the other end of the scale, the crash types in which the largest number of pedestrians who escape with minor injuries or no injuries (that is, “C” injuries plus “No injuries”) are those involving a backing vehicle, 42 percent compared with 31 percent overall. Speed is a likely factor in these differences. Pedestrian crashes resulting in little or no injury are more likely to go unreported than those in which the pedestrian was seriously injured or killed.
Table 22. Pedestrian crash types by pedestrian injury severity (N=5,073).
| INJURY SEVERITY* |
| Pedestrian Crash Type Subgroup |
No Injury |
Minor(C) |
Moderate (B) |
Severe (A) |
Fatal |
| Bus related |
2.3 |
25.0 |
45.5 |
22.7 |
4.5 |
| Other vehicle specific |
0.0 |
24.7 |
43.8 |
25.8 |
5.6 |
| Driverless vehicle |
1.4 |
24.3 |
36.5 |
35.1 |
2.7 |
| Backing vehicle |
2.4 |
39.2 |
35.8 |
20.8 |
1.7 |
| Disabled vehicle related |
2.5 |
24.2 |
31.7 |
32.5 |
9.2 |
| Working/playing in road |
3.5 |
32.2 |
37.1 |
25.9 |
1.4 |
| Walking along roadway |
1.5 |
23.9 |
34.3 |
27.2 |
13.2 |
| Not in road |
3.3 |
31.9 |
36.4 |
24.7 |
3.6 |
| Vehicle turning at intersection |
2.4 |
44.6 |
34.5 |
16.6 |
1.8 |
| Intersection dash |
3.4 |
25.4 |
37.6 |
29.4 |
4.2 |
| Driver violation at intersection |
2.4 |
32.2 |
37.6 |
22.7 |
5.1 |
| Other intersection |
3.0 |
27.2 |
33.6 |
30.8 |
5.4 |
| Midblock dart/dash |
2.4 |
23.2 |
38.8 |
30.0 |
5.6 |
| Other midblock |
1.5 |
23.0 |
28.7 |
35.7 |
11.1 |
| Miscellaneous |
3.8 |
26.5 |
36.8 |
25.7 |
7.3 |
| ALL CRASHES |
2.5 |
28.7 |
35.3 |
27.4 |
6.1 |
*Cases with unknown injury severity excluded.
Source: Pedestrian and Bicycle Crash Types of the Early 1990s, Hunter, W., J. Stutts, W. Pein, C. Cox, UNC HSRC, FHWA-RD-95-163, 1996. |
Figure 20 shows that injury severity is also related to age (Zegeer et al., 1993). Older persons
succumb to injuries that a younger person might survive. Fatal injuries among the youngest age group also are elevated relative to the lowest point of the curve. Fatalities among those 0-4 years are greater than for the next two older age groups.
 |
Figure 20. Percentage of pedestrian/motor vehicle crashes resulting in death, by pedestrian age, 1980-1990, North Carolina data.
Source: Zegeer et al., 1993. |
B. SUMMARY: HOW SEVERE ARE PEDESTRIAN COLLISIONS?
- Although too many pedestrian crashes result in fatal injuries, the great majority of pedestrian collisions do not produce fatal injuries.
- Some crash types are overrepresented in fatal outcomes. The walking-along-the-roadway crash type is an example.
- Some crash types are overrepresented in less severe outcomes. This includes pedestrian crashes involving backing vehicles and those involving driver
violations at an intersection.
- Older pedestrians are more likely to die from injuries in a collision than are younger pedestrians.
Summary of Pedestrian Collision Statistics
- Fatal pedestrian crashes tend to occur at night.
- Nonfatal pedestrian crashes tend to occur during the day.
- Pedestrian crashes are more frequent on Friday and Saturday and less frequent on Sunday.
- Child pedestrian crashes occur more often in the summer.
- Adult pedestrian crashes occur more often in the winter.
- The largest percentage of fatal pedestrian crashes is in 25-44 age category.
- The oldest age category (75 years or older) shows higher percentages of collisions per unit population.
- Compared with their proportion in the U.S. population, children ages 21-22 are overrepresented in pedestrian deaths and injuries.
- More male than female pedestrian fatalities are seen in every age category.
- Some data show that even for children 2 and 3 years old, more males than females are struck.
- Alcohol use by pedestrians is an important factor in pedestrian crashes. A North Carolina study showed that between 42 and 61 percent of fatally
injured pedestrians were under the influence of alcohol (i.e., BAC of 0.10 or greater).
- As might be expected, pedestrian sobriety is also associated with crash type. For the crash type of walking along the roadway, alcohol involvement is
overrepresented for both drivers and pedestrians. While alcohol-related collisions are dropping in the driving population, there has been little change in
alcohol-related collisions involving drinking pedestrians.
- Vehicle types overrepresented in fatal pedestrian crashes include the light truck category as well as heavy trucks and motorcycles.
- One study shows that approximately 85 percent of pedestrian crashes occur in urban areas and approximately 15 percent in rural areas. However, 25
percent of fatal pedestrian crashes occur in rural areas, showing the disproportionately severe character of such pedestrian crashes.
- Another study of pedestrian collisions showed a breakdown of 68 percent urban and 32 percent rural. Certain crash types were overrepresented in each
category. In rural areas, pedestrian crashes involving walking along the road were overrepresented. In urban areas, pedestrian crashes involving driver
violations at an intersection were overrepresented.
- Three-quarters of pedestrian crashes occur where there are no traffic controls, 7 percent where there is a stop sign, and 17 percent where there is a
traffic signal. However, this varies by crash type. For the crash type of walking along the roadway, 96 percent occur where there is no traffic control
versus 74 percent overall. For the category of vehicle turning at an intersection, 63 percent occur where there is a traffic light, versus 17 percent
overall.
- With respect to speed limits, most pedestrian crashes occur where speed limits are low or moderate (consistent with the fact that most pedestrian
crashes occur in urban areas).
- Approximately 40 percent of pedestrian crashes occur at intersections, although 75 percent of child pedestrian crashes are not at intersections.
The majority of pedestrian crashes involving the elderly do occur at intersections.
- Many factors contribute to a pedestrian crash, but no single factor accounts for a sizable percentage of crashes. Thus, any given crash prevention
measure, targeted to address any one factor, can produce only a small overall improvement.
- Pedestrians are solely culpable in 43 percent of crashes and drivers in 35 percent of crashes.
- Culpability varies by crash type. For crashes involving a midblock dash, pedestrians are found at fault most of the time. Drivers are more often
categorized as culpable in crashes involving vehicles turning at an intersection.
- Some crash types are overrepresented in fatal outcomes. Walking along the road is an example.
- Some crash types are overrepresented in less severe outcomes. This includes pedestrian crashes involving backing vehicles.
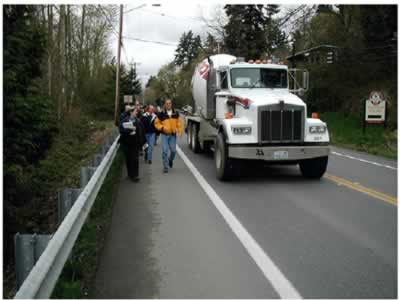 |
| Figure 21. Some pedestrian crash types are overrepresented in fatal outcomes, including walking along road. |
Exposure-Based Hazard Index
Several studies have addressed the need for a measure of the relative exposure to hazards based on pedestrian crash statistics (Knoblauch, 1977; Lea et al.,
1978; Goodwin and Hutchinson, 1977).
In 1977, Knoblauch developed a hazard index, defined as the ratio of the frequency with which any particular attribute was present in the crash sample to the frequency with which it was present in the general population at the site (base rate), at approximately the same time of day. Tables 23 and 24 show the relative hazards of pedestrian and vehicle actions derived in this manner. Table 23 shows that while crossing at a location other than an intersection was the most frequent action identified in the pedestrian crash sample, when compared with non-involved pedestrian actions at the site, it is a substantially less hazardous action than, for example, standing in the roadway. Similarly, out-of-control and backing vehicles are shown to be extremely hazardous to the pedestrian compared with turning vehicles. This procedure did not take collision severity into account when defining a hazard index (fortunately, these collisions are of low severity). The hazard index was computed based on the percent of pedestrian crashes divided by the relative exposure. Thus, for example, in table 24, the hazard index for "vehicle straight ahead" was relatively safe (hazard index of 0.9), even though 77.2 percent of pedestrian crashes involved a vehicle traveling straight ahead. This is because 85.1 percent of the vehicle exposure involved the straight ahead vehicle movements. Thus, the ratio of crash percentage divided by exposure percentage = (77.2) ÷ (85.1) = 0.9
Table 23. Pedestrian action and crash data with resulting hazard index.
| Pedestrian Action |
Crash Data Percent |
Base Rate Data Percent |
Hazard Index |
| Safer |
More Hazardous |
| Standing in roadway |
8.1 |
1.5 |
|
5.4 |
| Coming from behind parked vehicle |
5.3 |
1.1 |
|
4.8 |
| Working in roadway |
2.2 |
0.8 |
|
2.8 |
| Working on vehicle |
3.5 |
1.8 |
|
1.9 |
| Crossing, not at intersection |
39.4 |
27.0 |
|
1.5 |
| Walking in road with traffic |
10.8 |
12.3 |
0.9 |
|
| Playing in road |
3.6 |
4.9 |
0.7 |
|
| Walking in road against traffic |
4.8 |
8.0 |
0.6 |
|
| Crossing at intersection |
18.3 |
29.0 |
0.6 |
|
| Getting on/off school bus |
1.6 |
3.6 |
0.4 |
|
| Getting on/off other vehicle |
2.4 |
9.9 |
0.2 |
|
| Source: Knoblauch, 1977. |
Table 24. Vehicle action and pedestrian collision data with resulting hazard index.
| Vehicle Action |
Crash Data Percent |
Base Rate Data Percent |
Hazard Index |
| Safer |
More Hazardous |
| Out of control |
2.7 |
0.0 |
|
|
| Backing up |
3.0 |
0.1 |
|
3.0 |
| Passing |
2.5 |
0.1 |
|
2.5 |
| Other |
3.6 |
0.2 |
|
1.8 |
| Standing in roadway |
1.9 |
0.5 |
|
3.8 |
| Changing lanes |
1.2 |
0.4 |
|
3.0 |
| Going straight ahead |
77.2 |
85.1 |
0.9 |
|
| Turning right |
2.3 |
5.1 |
0.5 |
|
| Turning left |
2.2 |
5.2 |
0.4 |
|
| Source: Knoblauch, 1977. |
In a later study, additional hazard relationships were updated, as shown in figure 22 (Knoblauch et al., 1987). Samples of pedestrian crashes and exposure were used to develop hazard scores for various pedestrian and vehicle characteristics. Scores of +1 or higher represent higher-than-average and -l- or less, a safer-than-average level of hazard. Pedestrians aged 1 to 4 years old had the highest hazard scores (+8.3); pedestrians aged 5-9 (+4.0), 10-14 (+1.2), and 60 and older (+1.7) had higher-than-average hazard scores. Running is more hazardous for pedestrians than walking (+4.7 vs. -1.9). Walking against a traffic signal has a hazard score of 5.1 compared with a score of -1.8 for crossing with the signal, while a right-turn-on-red maneuver by a motor vehicle was the most hazardous (score of +3.2) vehicle maneuver. Motorcycles and buses are associated with higher hazards to pedestrians (+3.3 and +2.9, respectively) than other vehicle types.
Conflict Analysis Hazard Formula
Conflict analysis has been used in a number of pedestrian crash studies to determine the hazard level as a basis for developing countermeasures (Knoblauch, 1977; Petzold, 1977; Zegeer et al., 1980; Husband and Sobey, 1978; Cynecki, 1980).
In a Rochester, MI, study, pedestrian conflicts were defined for school zones, based on observations at 10 school sites (Zegeer et al., 1980). These conflicts and events are:
- Vehicle slows or stops for pedestrian
- Secondary vehicle conflict resulting from the first vehicle slowing for pedestrian
- Vehicle weaves for crossing pedestrian
- Vehicle brakes or weaves for standing pedestrian
- Vehicle brakes or weaves for pedestrian walking on shoulder
- Turn conflict
- Pedestrian runs across street
- Pedestrian stops in street
- Pedestrian violation of traffic signal
- False start across street
- Jaywalking
The number of pedestrians crossing the street within the school zone, where pedestrians could be exposed to approaching vehicles, was also counted. The authors selected five conflict variables:
S - Severe conflicts
M - Moderate conflicts
R - Routine conflicts
J - Jaywalkers
C - Legal street crossings
Their relative contributions to hazard was determined by establishing weightings for an index using a delphi procedure. The result was the following formula for a subjective danger index (DI):
DI = 7.4 S + 2.8 M + l.0 R + 0.7 J + 0.2 C
This model was then proposed for use as a ranking tool for identifying high hazard school-zone sites and for guiding the selection of countermeasures.
A conflict analysis technique was developed by Cynecki (1980) for use in identifying hazardous pedestrian crossing locations. A total of 13 types of pedestrian conflicts were defined with assigned severity levels. The technique was tested at five locations and used to select pedestrian crash countermeasures. The author recommended further investigation of relationships among pedestrian conflicts and vehicle-pedestrian crashes.
 |
Figure 22. Relative hazard of selected pedestrian characteristics
Source: Knocblauch et al., 1987 |
Another study that attempted to determine the relationship between pedestrian-vehicle conflicts and pedestrian crashes based on a predictive model used discriminate analysis to develop crash-group models for the cities of Washington, DC and Seattle, WA (Davis et al., 1989). These models were used to predict intersection groups expected to have, for example, 0, 1, 2, or 3 or more pedestrian crashes. The crash groups were defined based on conflicts, as well as such exposure measures as pedestrian volume, vehicle volume, number of lanes, and type of traffic control. The models were considered particularly useful in setting priorities for hazardous locations and for evaluating various traffic control strategies. The model was developed using a subset of the crash data, and then was at least partly validated by being applied to the remaining crash data.
FHWA-RD-03-042
|


