U.S. Department of Transportation
Federal Highway Administration
1200 New Jersey Avenue, SE
Washington, DC 20590
202-366-4000
Federal Highway Administration Research and Technology
Coordinating, Developing, and Delivering Highway Transportation Innovations
 |
| This report is an archived publication and may contain dated technical, contact, and link information |
|
Publication Number: FHWA-HRT-05-109
Date: July 2006 |
Federal Highway Administration University Course on Bicycle and Pedestrian TransportationPDF Version (355 KB) PDF files can be viewed with the Acrobat® Reader®
LESSON 13: SELECTING BICYCLE FACILITY TYPES AND EVALUATING ROADWAYS
13.1 IntroductionSeveral different types of facilities can be provided for bicyclists on roadways. The appropriate bicycle facility type is often determined by factors such as roadway cross-section elements, vehicle traffic characteristics, and bicyclist skill level. Some of these same factors used to determine appropriate bicycle facility type can also be used to evaluate the bicycle compatibility or bicycle friendliness (also called bicycle LOS) of roads with or without special bicycle facilities. This lesson describes several approaches to selecting appropriate bicycle facility types and summarizes several methods used to evaluate the bicycle compatibility of roads. The major sections of this lesson are as follows:
13.2 Overview of Bicycle Facility SelectionAs will be presented in lessons 14 and 15, there are several basic bicycle facility types:
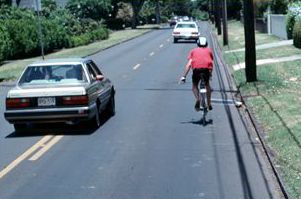
Figure 13-1. Photo. Bicyclist on a shared roadway.
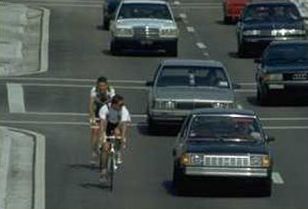
Figure 13-2. Photo. Bicyclists in a wide curb lane.
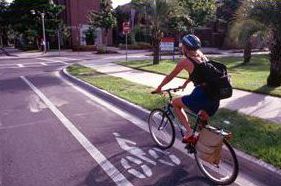
Figure 13-3. Photo. Bicyclist in a bike lane.
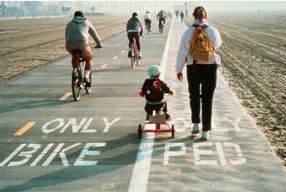
Figure 13-4. Photo. Bicyclists and pedestrians on a separated (shared-use) path.
Technical information on the design of these different bicycle facilities has dramatically improved in recent years. The 1999 AASHTO Guide for the Development of Bicycle Facilities is more than twice the size of previous editions and is based on considerably more research and practice than earlier versions.(2) Many State and local agencies have adopted their own design practices that exceed recommendations in the 1999 AASHTO Guide for such things as bike lane width, trail width, and intersection treatments. However, there is still considerable debate over the appropriate choice of bicycle facility type in any given set of circumstances. When is a striped bike lane the appropriate design solution rather than a simple shared lane or a multiuse path? At what traffic speed or volume does a shared lane cease to provide the level of comfort sought by most bicyclists? A review of bicycle facility selection approaches by King found many differences, particularly between guidelines in the United States versus those used in Europe.(3) The review did not find universal agreement among the U.S. guidelines, but it does point to some general ranges in which facility selection decisions can be made. The review concluded that engineering judgment and planning experience will continue to be vital elements in selecting appropriate bicycle facility types. Nearly all of the facility selection approaches in the King review were based on at least two common variables:
Many of the approaches had other variables that were considered but were not common among all other approaches. Despite the many differences between the facility selection guidelines, the King review did present an aggregate or composite chart that attempts to represent all guidelines from North America on a single chart (see figure 13-5). This composite chart points to clear trends among all guidelines:
13.3 AASHTO Guidance on Selecting Bicycle Facility TypeThe 1999 AASHTO Guide provides some qualitative guidance on choosing the appropriate facility type, but largely suggests that bicycle facility selection is a policy decision to be made by State and local agencies. The facility selection guidance is largely centered on the skill levels of bicyclists and what types of facilities they prefer. The 1999 AASHTO Guide defines three bicycle user types (these were first defined in a 1994 FHWA report):(2,4)
The following descriptions are from the 1999 AASHTO Guide:(2) Advanced or experienced riders are generally using their bicycles as they would a motor vehicle. They are riding for convenience and speed and want direct access to destinations with a minimum of detour or delay. They are typically comfortable riding with motor vehicle traffic; however, they need sufficient operating space on the traveled way or shoulder to eliminate the need for either themselves or a passing motor vehicle to shift position. Basic or less confident adult riders may also be using their bicycles for transportation purposes, e.g., to get to the store or to visit friends, but prefer to avoid roads with fast and busy motor vehicle traffic unless there is ample roadway width to allow easy overtaking by faster motor vehicles. Thus, basic riders are comfortable riding on neighborhood streets and shared-use paths and prefer designated facilities such as bike lanes or wide shoulder lanes on busier streets. Children, riding on their own or with their parents, may not travel as fast as their adult counterparts but still require access to key destinations in their community, such as schools, convenience stores and recreational facilities. Residential streets with low motor vehicle speeds, linked with shared-use paths and busier streets with well-defined pavement markings between bicycles and motor vehicles, can accommodate children without encouraging them to ride in the travel lane of major arterials. These definitions suggest that bicyclists with different skill levels will prefer certain facility types. Advanced bicyclists, because of their advanced skills, desire for speed, convenience, and direct access, prefer direct routes that may also carry significant vehicle traffic, without any dedicated space for bicyclists. Children, however, prefer shared residential roads with little traffic or separated paths. Because of these differing preferences, it may sometimes be difficult to accommodate all potential bicyclists’ preferences. The 1999 AASHTO Guide suggests that facility selection is dependent on many factors, including the bicyclist skill level, the specific corridor conditions, and facility cost. However, more specific information about balancing the preferences of bicyclists is not provided. The Guide does indicate that bicyclists may be provided with more than one option to meet the travel and access needs of all potential users. Further, the Guide indicates that continuity and consistency should be considered when providing bicycle facilities. For example, children bicyclists using a separated path to get to school should not have to cross a major arterial without some intersection controls. Similarly, shoulders and bike lanes should not end abruptly at difficult intersections or busy segments of highway.
13.4 Overview of Evaluating Roads for BicyclistsAn integral part of the planning process for bicycle facilities is an inventory of existing conditions. Most bicycle plans attempt to quantify how well the existing road network accommodates bicyclists. A variety of bicycle compatibility criteria have been developed since the early 1990s to quantify how compatible a roadway is for accommodating safe and efficient bicycle travel. Also included under the genre of bicycle compatibility criteria are bicycle stress levels, bicycle safety indices, bicycle suitability ratings, roadway condition indices, bicycle interaction hazard scores, and bicycle LOS. As the name indicates, bicycle compatibility criteria are somewhat analogous to the LOS criteria established in the Highway Capacity Manual, which engineers and planners commonly use to evaluate the quality of traffic flow on highways and streets.(5) Bicycle compatibility criteria, like the LOS criteria, can be used to evaluate existing conditions and identify facility improvement needs. Bicycle compatibility criteria also can be used to determine those streets or highways that are most amenable to bicycle travel. Many studies have shown, for example, that most bicyclists typically prefer to use streets with low traffic volumes, low vehicle speeds, and wide travel lanes. A number of other factors or variables can be used in addition to these to determine the roadways most compatible for bicycle use and, therefore, most likely to elicit positive traveler response. Several recent studies have identified roadway cross-section elements and traffic factors that affect bicyclists’ perceptions of safety, comfort, and convenience. These factors have been tested and calibrated in real-world conditions to develop models that attempt to quantify bicyclist comfort levels (based mostly on perceptions of safety). Numerous models have been developed, but the following two appear to be most commonly used in bicycle planning and facility selection:
13.5 Bicycle Compatibility IndexA team of researchers developed BCI in the late 1990s to quantify the "bicycle friendliness" of roadways.(6) BCI is calculated as shown in table 13-1. The significant variables include: the presence and width of a paved shoulder or bicycle lane; motor vehicle traffic volume and speed in adjacent lanes; the presence of motor vehicle parking; and the type of roadside development.
Table 13-1. Bicycle compatibility index model.
In developing BCI, the research team used the perspectives of more than 200 persons in 3 cities (Olympia, WA; Austin, TX; and Chapel Hill, NC) to subjectively evaluate the perceived bicycling comfort level in different roadway environments. The approach used in this study relied on participants viewing roadway segments on videotape; the videotape method was validated with an on-street pilot study using 24 participants and 13 different roadway segments. After viewing the videotape for a particular roadway segment, each of the 200+ participants in the larger study were asked to grade the segment viewed on a numerical scale of 1 to 6 (corresponding to LOS rankings of A to F). The BCI method has been developed to allow practitioners to evaluate existing facilities to determine what improvements may be required, as well as determine the geometric and operational requirements for new bicycle facilities.
13.6 Bicycle LOSLOS is an evaluation of bicyclists’ perceived safety and comfort with respect to motor vehicle traffic while traveling in a roadway corridor. It identifies the quality of service for bicyclists or pedestrians that currently exists within the roadway environment.(6,7) The bicycle LOS is also discussed in lesson 4 of this workbook in the section titled Using Models to Evaluate Roadway Conditions for Bicycling and Walking. To evaluate bicycle LOS, a statistically calibrated mathematical equation is used to estimate bicycling conditions in a shared roadway environment. It uses the same measurable traffic and roadway factors that transportation planners and engineers use for other travel modes. This modeling procedure clearly reflects the effect on bicycling suitability or compatibility because of factors such as roadway width, bike lane widths and striping combinations, traffic volume, pavement surface condition, motor vehicle speed and type, and on-street parking. The form of the bicycle LOS model is provided below (see figure 13-6). Figure 13-6. Equation. Bicycle LOS.
The bicycle LOS score resulting from the final equation is prestratified into service categories of A through F (A being the best and F, the worst), according to the ranges shown in table 13-2, which reflect users’ perception of the road segments’ LOS for bicycle travel. This stratification is in accordance with the linear scale established during the referenced research (i.e., the research project bicycle participants’ aggregate response to roadway and traffic stimuli). The model is particularly responsive to factors that are statistically significant. An example of its sensitivity to various roadway and traffic conditions is shown in figure 13-7. Table 13-2. Bicycle LOS categories.
Because the model represents the comfort level of a hypothetical typical bicyclist, some bicyclists may feel more or less comfortable than the bicycle LOS calculated for a roadway. A poor bicycle LOS grade does not mean that bikes should be prohibited on a roadway. The bicycle LOS model is used by planners, engineers, and designers throughout the United States and Canada in a variety of planning and design applications. Applications include:
13.7 Student ExerciseSelect a variety of local streets, and assemble their traffic and geometric data (you may estimate certain data if none are available). With the information at hand, evaluate LOS of the roadways, and make recommendations for additional bike facilities. 13.8 References and Additional ResourcesThe references for this lesson are:
FHWA-HRT-05-109 |
|||||||||||||||||||||||||||||||||||||||||||||||||||||||||||||||||||||||||||||||||||||||||||||||||||||||||||||||||||||||||||||||||||||||||||||||||||||||||||||||||||||||||||||||||