Lesson 2: Bicycling and Walking in the United States Today
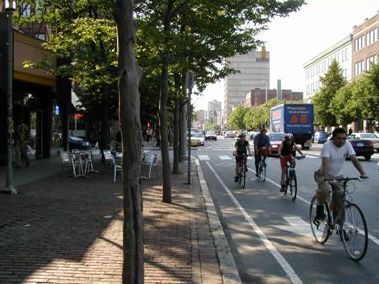
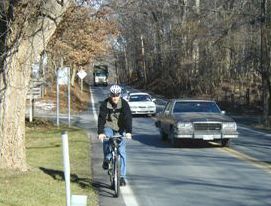
| (This picture shows bicyclists not wearing helmets. FHWA strongly recommends that all bicyclists wear helmets.) |
Lesson Outline
- How much biking and walking people actually do.
- Factors that influence walking or biking decisions.
- Strategies that can be used to encourage bicycling and walking.
2001 National Household Transportation Survey Data
Regional Variations in Mode Choice
Table 2-1. Regional variations in modal shares for transit, walking, and bicycling.
(percentage of trips by mode)
Source: Highlights of the 2001 NHTS(5)
| Mode of Transportation |
New England |
Middle Atlantic |
East North Central |
West North Central |
South Atlantic |
East South Central |
West South Central |
Mountain |
Pacific |
Total Transit |
1.8 |
5.8 |
1.3 |
0.6 |
1.6 |
0.4 |
0.7 |
0.8 |
2.2 |
| Bus and Light Rail |
0.7 |
3.0 |
0.9 |
0.5 |
1.2 |
0.4 |
0.7 |
0.8 |
2.0 |
Metro/Subway/Heavy
Rail |
0.9 |
2.3 |
0.2 |
0.0 |
0.3 |
0.0 |
0.0 |
0.0 |
0.1 |
| Commuter Rail |
0.3 |
0.5 |
0.2 |
0.0 |
0.1 |
0.0 |
0.0 |
0.0 |
0.1 |
Total Nonmotorized |
11.0 |
16.7 |
9.5 |
7.3 |
8.5 |
6.4 |
7.1 |
9.5 |
11.7 |
| Walk |
10.3 |
15.8 |
8.6 |
6.6 |
7.6 |
6.0 |
6.3 |
8.7 |
10.6 |
| Bicycle |
0.7 |
0.8 |
0.9 |
0.7 |
0.9 |
0.4 |
0.8 |
0.8 |
1.1 |
| Note: Values in table represent percent of total trips by mode indicated. |
| |
| Values in table are the % of trips by mode indicated. |
| Source: Pucher, J., and J.L. Renne, "Socioeconomics of Urban Travel: Evidence from the 2001 NHTS," Transportation Quarterly, vol. 57, no. 3, summer 2003. |
Factors Influencing Walking/Biking Decisions
- Distance/time.
- Attitude.
- Trip barriers.
- Destination barriers.
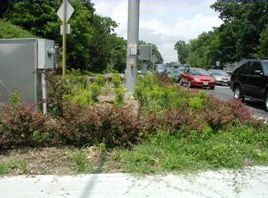
Distance/Time
Trip Barriers
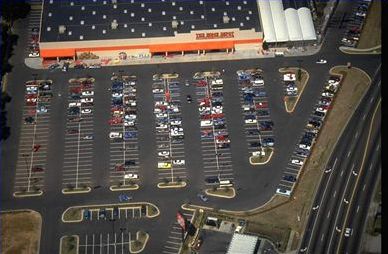
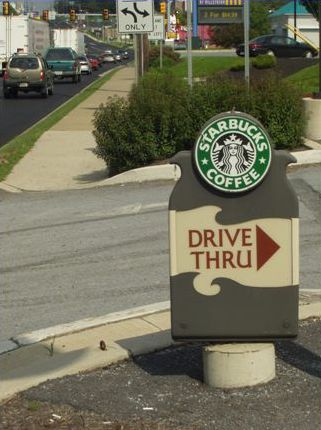
Destination Barriers
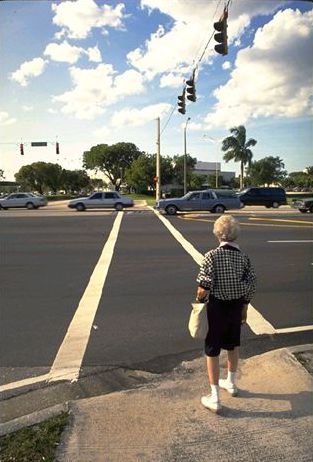
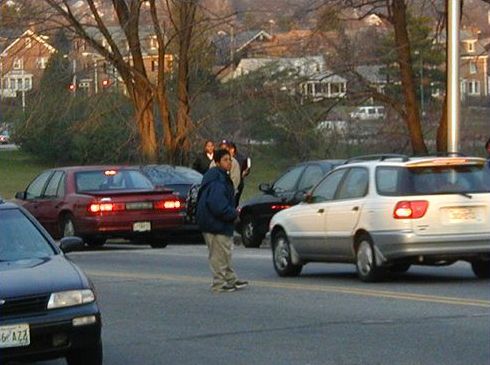
Safety Concerns
Strategies to Increase Bicycling and Walking
- Build on existing support.
- Press the transit connection.
- Increase opportunities for recreational walking and bicycling.
- Other strategies?
Lesson Summary
- People are already biking and walking.
- There are a variety of reasons why people choose whether or not to bike or walk.
- There are many ways to encourage bicycling and walking in the community.
- Bicycling and walking help to maintain independence and mobility for all people.
FHWA-HRT-05-088
|