U.S. Department of Transportation
Federal Highway Administration
1200 New Jersey Avenue, SE
Washington, DC 20590
202-366-4000
Federal Highway Administration Research and Technology
Coordinating, Developing, and Delivering Highway Transportation Innovations
 |
| This report is an archived publication and may contain dated technical, contact, and link information |
|
Publication Number: FHWA-HRT-06-125
Date: November 2006 |
Pedestrian and Bicyclist Intersection Safety IndicesFinal ReportPDF Version (2.25 MB) PDF files can be viewed with the Acrobat® Reader®
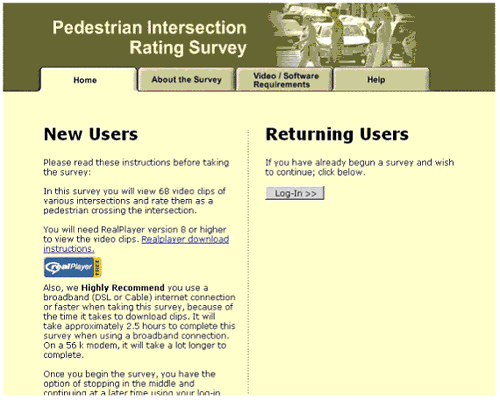
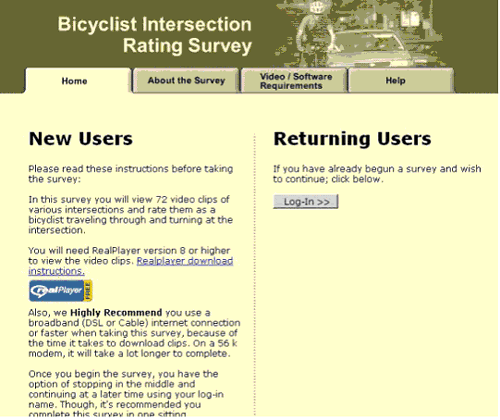
APPENDIX C. WEB SITES FOR SAFETY RATINGS SURVEYParticipants in the safety rating surveys were instructed to visit a particular Web address to begin the survey. The following figures show screenshots of the different sections of the survey Web sites. Figure 22 and Figure 23 shows screens from both the pedestrian and the bicyclist surveys (pedestrian image on left, bicyclist image on right). Even though similar, there were some differences in the type of information given and the information requested of the evaluator. The first page on the survey Web site was the introduction page (Figure 22 and Figure 23). This page allowed new participants to create a profile and begin the survey or returning users to log back in and pick up where they left off. Figure 22. Pedestrian survey introduction page.
Figure 23. Bicycle survey introduction page.
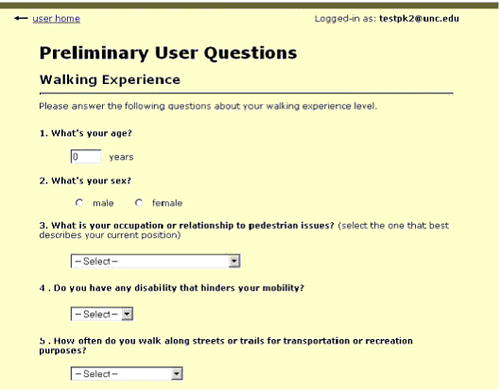
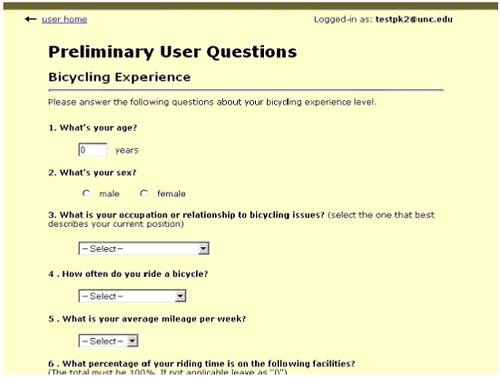
After creating a login profile, users were prompted for certain information regarding their demographics and experience (Figure 24 and Figure 25). These data were later used to ensure that survey ratings had been given by a perse group of evaluators.
Figure 24. Preliminary pedestrian user questions.
Figure 25. Preliminary bicyclist user questions.
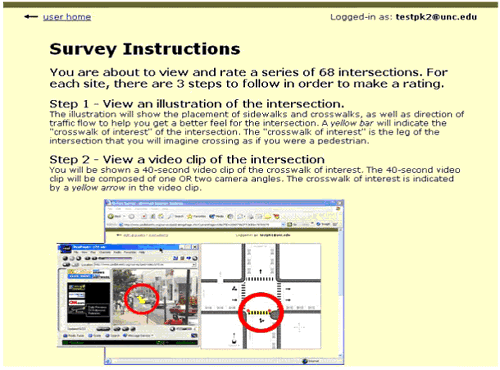
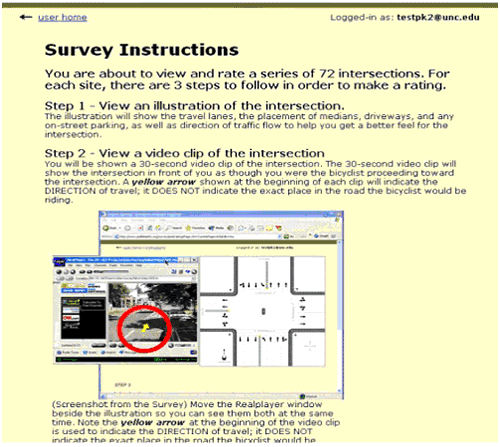
Survey instructions were provided to the user (Figure 26 and Figure 27). These instructions demonstrated the steps that would need to be followed to give a rating.
Figure 26. Pedestrian survey instructions.
Figure 27. Bicycle survey instructions.
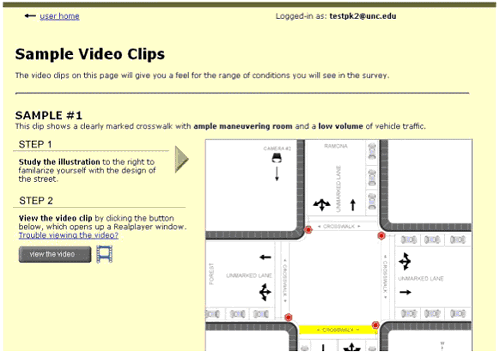
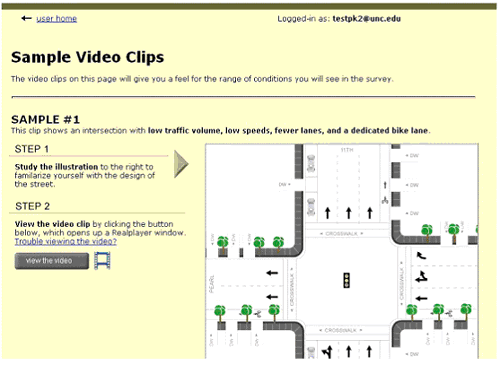
Before users began the actual survey, they were first shown a page with two sample intersections (Figure 28 and Figure 29). They were given the opportunity to familiarize themselves with the survey format by viewing the illustration and video clip. The two example sites also gave them an idea of the range of conditions they would see during the survey.
Figure 28. Sample pedestrian video clips page.
Figure 29. Sample bicycle video clips page.
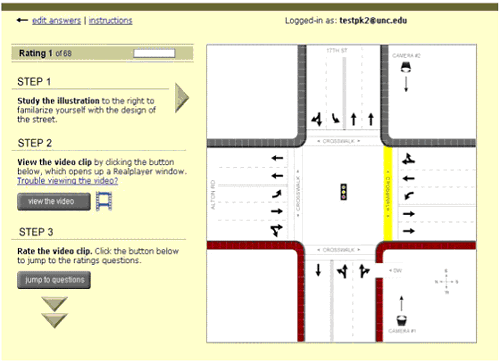
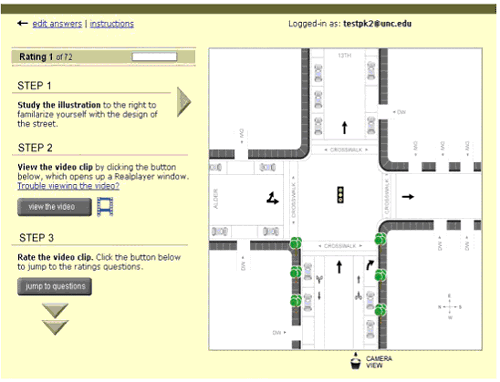
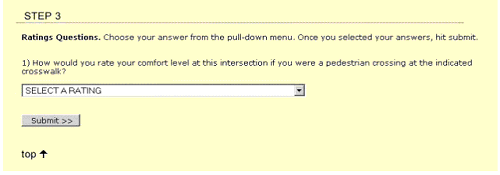
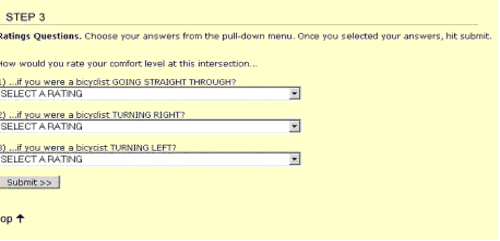
A rating page for a particular site consisted of top and bottom sections. The top section (Figure 30 and Figure 31) gave the necessary information through the illustration and video clip. The bottom section (Figure 32 and Figure 33) presented users with pull-down boxes by which they would select a safety rating for the site. There was only one rating given per crosswalk, but three ratings per bicyclist approach. Once selected and submitted, the survey would proceed to the next site.
Figure 30. Top of pedestrian rating page.
Figure 31. Top of bicycle rating page.
Figure 32. Bottom of pedestrian rating page.
Figure 33. Bottom of bicycle rating page.
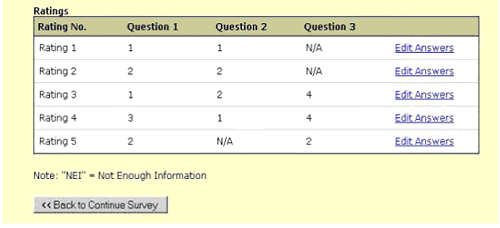
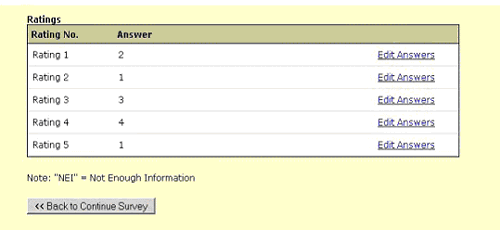
Users were also given the option to change any rating previously placed (Figure 34 and Figure 35). This option was available at any point during the survey.
Figure 34. Edit answers page for pedestrian survey.
Figure 35. Edit answers page for bicycle survey.
FHWA-HRT-06-125 |