Pedestrian and Bicyclist Traffic Control Device Evaluation Methods
APPENDIX C. EVALUATION METHODS
EXAMINING USERS
Roadway users include pedestrians, bicyclists, and motorists of all ages and experience. Traffic control devices and operations should serve all roadway users. The most comprehensive evaluations test the widest variety and greatest number of users.
Who to Test
Decisions about who to test need to be made in the context of the problems identified. For example, if the problem is that school children are not obeying a signal, then the school children should be tested, not adults. Members of the general public are typically recruited to participate in evaluation studies. Efforts should be made to recruit people with different reading abilities, education levels, and visual abilities. If pedestrian users are specifically being recruited, people with mobility or sensory disabilities should be included in the subject group.
Ethics
Professional ethics standards require protection of human research subjects. Academic institutions that conduct human-subject research typically must have their research approved by an Institutional Review Board. Even if an agency is not bound by Federal regulations, the following basic principles should be followed by any professional:
Voluntary participation (not coerced). Safety of research participants. Respect for participants. Equal treatment of all participants. Confidentiality of data. Privacy of personal information.
Free training that covers the basic principles of protecting research participants is available via the Internet (see chapter 6 of this report). Practitioners should consult with their risk management or health and safety officers about any applicable local or State regulations and policies concerning recruitment of general public participants for research studies. This is particularly true when minors are involved. Studies that receive Federal funding may be subject to human-subject protection regulations established by the Health and Human Services Department
(see chapter 6 of this report).
Recruitment Methods
If surveys or individual testing of road users is needed, research participants can be recruited from the general public in many ways. Regardless of the recruitment method, efforts should be made to recruit a variety of people of different ages, genders, educational backgrounds, and familiarity with the local transportation system. In keeping with the professional ethics standards concerning human subjects, participants should not be forced to participate through personal influence, peer pressures, or supervisory positions.
Participant recruiting method ideas for studies for which testing will be conducted by appointment or during a specific period at a specific location are as follows:
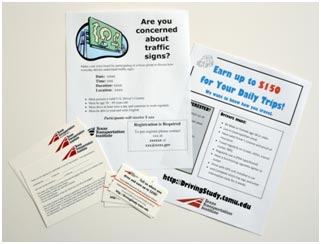
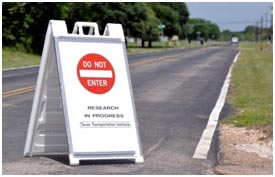
Posted flyers in study areas (see figure 19). Local businesses, libraries, churches, etc., are often willing to post flyers. This is a particularly effective method when seeking individuals who are familiar with a specific location. Ads in local media. Most local-access cable television and radio accept public service announcements free of charge if a public agency is performing the evaluation. Internet advertising through Craigslist® or through city/county/State social media outlets on Facebook®, Twitter®, MySpace®, etc. Direct email recruiting through friends, colleagues, community service groups (e.g., Lions Club or American Legion), etc. Special care must be taken to avoid coercion and to ensure diversity. Since these types of groups often are "birds of a feather," special efforts may be needed to reach out to a broad range of people in terms of age, race, and education level. By using email or the Internet, the subject sample is immediately biased toward those with access to a computer. This may eliminate lower income or lower education-level participants. Direct contact with groups representing a specific targeted demographic feature. Parent-teacher organizations, Girl and Boy Scout troops, YMCA/YWCA, church youth groups, and community recreation centers are ways to reach children. Permission should always be granted by a parent or guardian before a child participates in a study. Groups representing people with disabilities or offering services to those people may also be willing to advertise a study. Senior activity centers, church groups, and retired military groups often have a large contact list of older road users who would likely participate in a study.
 |
| © Texas Transportation Institute |
Figure 19. Photo. Example of flyers and cards used to recruit study participants.
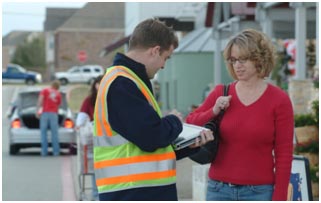
Research participants can also be recruited and tested immediately in the same location. These types of tests are often called intercept surveys because participants are intercepted in the course of their normal day and asked to participate in the evaluation (see figure 20). These types of intercepts may happen at transit stops, driver's license bureaus, hotel lobbies, and on streets. This type of recruitment method typically works best if the survey or other testing is very short in duration. People are generally unwilling to participate if completion of the survey or other test will be time consuming.
 |
| © Texas Transportation Institute |
Figure 20. Photo. Researcher and participant in an intercept survey.
Self-Selection Bias
Regardless of the recruitment method, there is always the concern that people who agree to participate in a survey are somehow different than those who refuse. Behavioral researchers use the term self-selection bias to describe this effect. For instance, if researchers are standing near a school asking passersby to participate in a survey about the crosswalk, people who think the crosswalk needs improvement may be more likely to agree to participate than those who think the crosswalk is good. Random selection of participants and random assignment of treatments to participants are the best ways to avoid this bias.
How and Where to Conduct the Test
The questions of how and where testing will occur is separate from the question of what to measure, which is addressed in the next section. This section describes the different ways and places to conduct testing, regardless of the test question content.
Interviews, surveys, and other types of testing that can be performed in an office-type setting are described in the following sections. The location of the testing is often a crucial factor in recruiting participants, particularly if they are not regular drivers. Often, an agency can contact local churches, senior centers, recreation centers, and public libraries to secure a meeting room for free. These types of settings offer a convenient, safe, and familiar location where people are willing to come even if they are a bit apprehensive about volunteering for a study. The location for office testing should be relatively quiet, have access to restrooms, and be compliant with the Americans with Disabilities Act.
Interactive Structured Interviews
Interviews involve give and take between the experimenter and the participant. An interview script should be prepared to assure consistency across successive interviews or across different interviewers. The advantage to interviews is that the interviewer can ask follow-up questions to assure that the participant understands the question or task correctly. Interviews can take place
as follows:
Telephone interviews can be conducted by trained interviewers working from a script to ensure consistency. Telephone interviews are generally quite expensive because of the low response rate. In addition, the sample of people available with land-line, directory-listed numbers may not be representative of the general population as more people are exclusively using mobile phones. - In-person interviews are most typical. Again, interviewers must be trained to remain impartial and consistent during the interview so as not to skew the results. In-person interviews can be conducted in a number of locations as follows:
On the street with pedestrians near the treatment. At other intercept locations, such as a driver's license office or shopping mall. In a laboratory or office setting. In a motor vehicle near the treatment.
Regardless of the location or setting, interviews can be prearranged by recruiting participants through the methods previously discussed or can be intercept surveys for which experimenters stop people. Care should be taken to avoid bias in selection in intercept surveys, as the experimenters may tend to stop people like themselves in appearance, race, or gender. The concern is that these unknown personality differences would also influence responses to traffic control devices while driving.
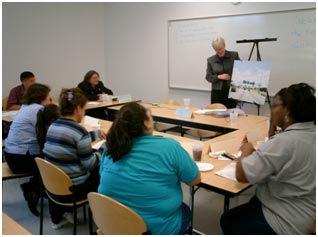
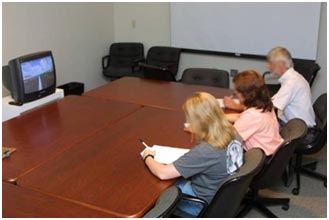
Focus Groups
Focus groups are small discussion groups of 8 to 10 people that are convened to discuss a particular topic (see figure 21). They can be held in offices, hotel conference rooms, or community centers. In a focus group, a trained facilitator presents photos or other examples of candidate treatments and asks a series of structured, open-ended questions to the group for discussion. Focus groups can be particularly useful at the start of a study when candidate treatments are being designed or a large group of candidates needs to be reduced to a smaller set that will be deployed in an observational study.
 |
| © Texas Transportation Institute |
Figure 21. Photo. Focus group discussing and providing feedback.
The results of focus groups are often difficult to summarize because the discussion can be quite unwieldy. An experienced facilitator knows techniques to keep the discussion on point and to avoid one vocal person from overtaking the discussion. One danger of focus groups is "group think" where the opinion of the group changes over time and throughout the discussion due to the reinforcing of each other's ideas. The opinion of a group may shift and, in the end, not be the same as if each individual was asked separately. Focus groups can be a cost-effective method to hear from ordinary people about their concerns and troubles with a particular pedestrian or bicycle area. They are best used in the problem identification phase of an evaluation.
Noninteractive Surveys
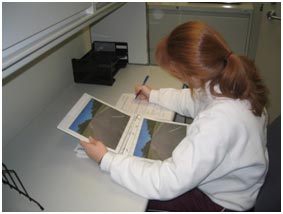
As opposed to interviews, surveys (as used in this report) are questionnaires that are filled out by the research participants without interaction with the experimenter. Again, there are multiple methods to deliver and receive surveys, and care needs to be taken to avoid biasing who responds to these surveys. Noninteractive surveys include the following:
Online or Web-based surveys offer a convenient and fast way to reach many potential survey respondents (see figure 22). The main drawback is that there is no way of knowing who is responding, particularly if the survey is anonymous. Another downside to the Internet survey is that the exposure time of the stimuli cannot be controlled. Computer technology varies so widely and transmittal times are so inconsistent that the researcher cannot guarantee that everyone sees each question, device, or illustration for the same amount of time. Email surveys are another convenient way of circulating a survey. Concerns about subject self-selection are high with this method. Preaddressed mail-back postcards handed to drivers or pedestrians in the area of a treatment is one way to solicit responses to a treatment in a specific location. Care must be taken to avoid bias in who does or does not receive or accept a postcard. Mailed surveys are also plagued with low response rates, sometimes as low as 5 percent or less. Coupling the mailing with other city services, such as utility bills, can save time and money and possibly increase the response rate. As with online surveys, it is not possible to guarantee that the person completing the survey was the addressee. In-person completion of the survey, either on paper or on a computer at any of the locations described above, is a common method. In-person completion can be coupled with Web-based surveys to balance the inequity of the subject sample introduced by requiring a computer. For instance, a Web-based survey may be advertised to the community, and then several additional in-person sessions may be offered at libraries, homeless shelters, or senior centers specifically to reach those without computer access. Staff should be available to assist those who are not comfortable with computers or who may not have sufficient reading skills to complete the survey alone. In-person surveys offer the benefit of being able to confirm demographic information about the person through observation.
 |
| © Texas Transportation Institute |
Figure 22. Photo. Research participant filling out a survey on paper.
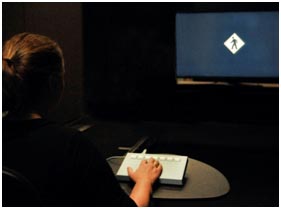
Controlled Experiments
Self-administered paper- and computer-based surveys often permit unlimited viewing time of the test device, which may inflate comprehension scores. Some surveys, using computer or slideshow presentations, may limit the amount of time the stimulus is viewed. One study directly compared these methods to driving simulation and found that a limited viewing time of sign images shown in roadway scenes produced comprehension scores equivalent to those seen in a driving simulator.(16)
The use of a laboratory to provide controlled conditions for evaluating a particular treatment can be beneficial (see figure 23). Laboratories can offer an approximation of real-world conditions without the risk of installing an unproven device at a location of interest. The following include some examples of studies for which laboratory-based evaluations may be appropriate:
Visibility or comprehension of signs, signals, and markings. Comprehension or reception of unique or novel traffic control devices. Nighttime conditions that may provide added risk if tested at actual study locations.
Figure 23. Photo. Participant evaluating signs in a laboratory.
There are a variety of laboratories, small and large, indoor and outdoor, but all are capable of controlling conditions to limit the effect of external influences to focus on the variable of interest and the treatment being considered. The following list includes some examples of laboratories, which are discussed further in this appendix:
It is important to remember that the location of the study does not necessarily dictate what is being measured. For instance, an evaluation may take place in a driving simulator, but if the evaluation only looks at preference ratings, the study is still qualitative (studying opinion), not quantitative (studying some objective measure of driving performance like speed).
Traditional Laboratory
A materials laboratory can be beneficial in evaluating certain characteristics of a treatment, such as retroreflectivity of a sign or durability of equipment under extreme weather conditions. These laboratories are typically outfitted with specialized equipment to conduct specific scientific tests, often to a set of testing standards developed by FHWA, American Society for Testing and Materials International, or the National Electrical Manufacturers Association. Other laboratories may be equipped with instruments and projection equipment to test human responses to various features of a treatment, such as the audibility of a chirping pedestrian signal or the visibility of a pedestrian signal head (see figure 24).
 |
| © Texas Transportation Institute |
Figure 24. Photo. Laboratory photometric measurement alley used for human factors studies.
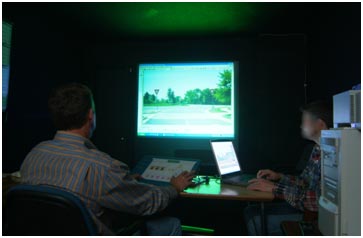
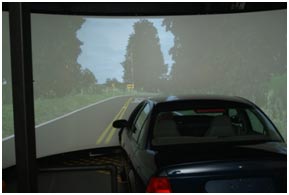
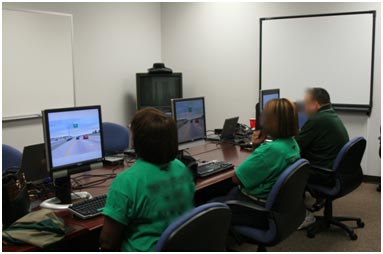
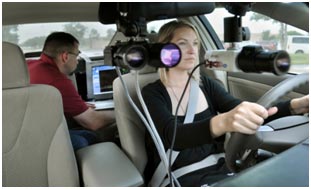
Driving Simulator
A driving simulator provides a safe and controlled environment to further explore comprehension and compliance in response to novel traffic control devices (see figure 25). In the driving simulator environment, it is possible to test multiple variations of the design and placement of a new device that may not be feasible in the field. In addition, a wider variety of roadway geometries and traffic conditions can be tested than are typically possible in a test track study or fiscally practical in a field evaluation. For instance, factors that limit sight distance can easily be introduced, and cross traffic density can be manipulated.
Figure 25. Photo. Driving simulator testing comprehension and compliance for traffic control devices.
Typically, a driving simulator offers a library of different roadway cross sections and interchanges. Using this library, simulator scenarios, or "worlds," are created to represent a typical roadway design. The worlds can be constructed such that traffic is programmed to interact with the research participant, and events can be initiated by hidden location or time-dependent triggers. Generally, the protocol is limited to 75 min to reduce the likelihood of simulator sickness and to avoid any effects of fatigue or boredom.
The following are examples of how driver performance can be assessed:
Distance from a stop bar when the final stop was executed. Distance from the intersection at which the throttle was released. Deceleration rate to the intersection. Gap acceptance. Verbal responses to questions concerning comprehension of the device.
A problem with driving simulator research is that the simulation facility is typically in a fixed location, often on a university campus. This limits the subject population to those who have the means to travel to the simulation lab, who are not intimidated by visiting a university, and who live in the same city as the simulation lab. In addition, many simulators induce motion sickness, particularly in older women. This may further limit the broadness of the subject sample. In general, due to the cost of using the equipment, the number of participants tested in a simulator study is much smaller than in a survey or field test.
Test Track
Also called a proving grounds or full-scale driving environment, a test track can provide a safe and controlled atmosphere to explore the comprehension and compliance of drivers, pedestrians, or bicyclists in response to novel traffic control devices (see figure 26). These facilities offer the ability to install treatments at full scale and test their effectiveness with real pedestrians, bicycles, and motor vehicles while minimizing the risk of crashes or other calamities that would be possible in a real-world scenario. Signs and beacons can be installed; crosswalks can be marked; and streets, curbs, and paths can be built or laid out to simulate the conditions at an actual site with minimal risk to the general public.
 |
| © Texas Transportation Institute |
Figure 26. Photo. Test track near Pecos, TX.
Evaluations using a test track typically have a sizeable cost for using the facility and purchasing and installing the treatment to be studied, but the results can be close to approximating the results expected in a real-world scenario.
Roads Closed to Public Travel
Public roads closed to travel can offer a less expensive alternative to test tracks (see figure 27). Proper road closures and notification to neighboring residences and businesses must be in place prior to testing. Full-scale test treatments can be installed, and drivers or pedestrians can evaluate them without concerns of interference of other traffic.
 |
| © Texas Transportation Institute |
| Note: Photo for illustration only, proper MUTCD temporary road closure signs should be used. |
Figure 27. Photo. Public road closed to travel.
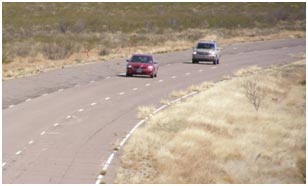
Roads Open to Public Travel
Driving performance and opinion studies can also be carried out on public roads in traffic. Full-scale test treatments can be installed at multiple locations, and a route can be developed that allows viewing of all of the treatments. The research subjects can be the driver or the passenger in a vehicle driving a prescribed course or could be a pedestrian observing the treatments. This method requires safety precautions, and there are liability concerns in the event that the experimental vehicle or the pedestrian subject is involved in a crash. When conducting visibility studies on the open road, the vehicle must be equipped with some sort of distance-measuring instrument to mark where participants could see the treatments. Also, the headlights of the test vehicle should be properly cleaned and aimed prior to the study, and the same vehicle should be used for all nighttime runs to provide the same illumination to the device.
One downside to conducting testing on open roads is that the other traffic (both pedestrian and vehicular) is beyond the control of the experimenters. Other extraneous factors such as weather and ambient light must also be considered.
What to Measure
Measurement techniques can be categorized as qualitative or quantitative. In qualitative tests, the responses are not numerical, nor can they be ranked. They are simply comments or feedback on some quality of the test stimulus. Qualitative research through interviews, focus groups, and surveys can give very detailed information on a subject. However, the generalizability, or the ability to generalize the findings of a study to other similar locations or subject populations, is limited in qualitative research. Generalizability demands inferential statistical tests, random selection of participants, and random assignment of treatments to participants. In many qualitative studies, none of these assumptions are met, and the results have limited generalizability. Quantitative research, on the other hand, uses objective measures and scales that are repeatable and reliable. The most robust quantitative methods use instruments that have an absolute zero, for example 0 s response time or 0 ft detection distance.
Opinion and Preference
The opinion or preference survey is among the most common methods used to evaluate the effectiveness of a pedestrian or bicycle traffic control device. The survey is intended to record the opinions of users or potential users of a countermeasure, which the practitioner can use in conjunction with other data (e.g., safety, operations, etc.) to estimate the countermeasure's effectiveness (see figure 28).
 |
| © Texas Transportation Institute |
Figure 28. Photo. Potential users of a countermeasure record opinions in a survey.
When creating a survey instrument, the practitioner must consider the following issues:
What do I want to learn (e.g., is the message on a sign understandable, do pedestrians tend to cross the street at this midblock location, etc.)? How am I going to conduct the survey to attain my objective?
Surveys can be very labor intensive to collect and process. If surveys are conducted in person, surveyors must be employed to conduct the survey, and appropriate locations must be identified. Staffing is also a critical component of a phone-based survey. Online, emailed, and mailed surveys are less labor intensive to administer but may not have as high a return rate because they are less personal and easier for the potential respondent to ignore. Regardless of the method used, the answers must be collected, processed, categorized, and analyzed to determine the key findings.
The length of the survey is important. While longer surveys are more thorough in asking questions the practitioner wants to answer, long or complex surveys may not be returned or completed. Shorter surveys provide more limited information but are more likely to be completed and returned. Similarly, questions are more likely to be answered if the responses are short. Multiple-choice questions, yes/no questions, scale questions (e.g., on a scale from 1 to 10), and other questions requiring one-word answers will probably yield more responses than essay or other open-ended questions. Also, while open-ended questions allow respondents to describe whatever comes to their mind regarding the subject, those answers are much more difficult to analyze, requiring the practitioner to make subjective evaluations of responses to categorize them.
The content of the questions must be considered for a number of reasons. Obviously, the questions should ask for the information that the practitioner wants to know, but there are some ways that are better than others for accomplishing that task. To that end, the practitioner should consider two issues: how questions should be asked and how responses should be scored.
As previously discussed, the manner in which a question is asked has a potential effect on its response rate and can also affect the answers received. The following are two principles to consider when asking survey questions:
Questions must be worded so as not to introduce a bias to the respondent. For example, if the surveyors want to know how well the message on a sign is understood, they could ask, "How can the wording on this sign be improved?" or they could ask, "Of the following four choices, what do you think this sign means?" Both ask for feedback on the sign's message, but the former could lead respondents into recommending changes they do not really need, while the latter may indicate that comprehension of the sign is reasonable. Questions should be worded so as not to be biased against certain groups of respondents. For example, if evaluating the perceived benefit of a separate bicycle trail, rather than asking, "Do you think that there are too many pedestrians on this street to ride your bicycle safely?" the surveyors could ask, "In your opinion, which of the following scenarios is likely if a separate bicycle trail is installed along this corridor: improved safety and/or mobility for pedestrians; improved safety and/or mobility for bicyclists; both of the above; or neither of the above?"
The way in which responses to a question are scored also has an effect on the usefulness of a survey. Some principles are as follows:
Just as the questions should not be biased, the survey administrator should also not be biased. Although a particular outcome may be desired when evaluating a given countermeasure, it is important to view the results objectively and neutrally. Otherwise, some key findings from the survey may be overlooked or dismissed because they do not fit the surveyor's predetermined desired outcome. The practitioner must have specific criteria to define what the results of the survey reveal. For example, is the survey intended to help determine whether a sign should be installed, or is it to help determine whether that sign should have a particular message? The way a survey will be scored should be determined before the survey is conducted so that the questions ask for the information needed to properly evaluate the required criteria. In many cases, a survey can be asked before and after a countermeasure is installed to compare actual results with anticipated results. In these cases, the surveyor should ask pedestrians for their opinion in the same way both before and after countermeasure installation. If the survey is changed, the results cannot be directly compared. The surveyor should consider the transferability of the results. That is, can the results of the survey at one location be applied to other locations, or are they site specific? Care should be taken before applying survey results to locations, countermeasures, or populations for which they were not originally evaluated. For instance, a study of the effectiveness of fluorescent yellow-green shared use trail crossing signs conducted through surveying the preference of school-age bicyclists may reveal a positive opinion. However, that survey finding does not suggest that engineering measures of slower automobile speeds on the roads that cross the trails will also result from the countermeasure. As it relates specifically to this category of treatments, the practitioner should consider the attitude toward pedestrians (or bicyclists) in the area in which the survey is conducted and in which the treatment is proposed. Related to generalizability, a particular treatment may show promise of improvement, but if the location in question is not amenable to pedestrian/bike treatments in general, a survey will likely reflect those attitudes in the responses it receives.
Larger sample sizes generally tend to improve statistical confidence in the results, but it is not the only consideration. Just because a large sample size can quickly be achieved with a survey does not necessarily make it the better study method. Experiences with previous traffic control device evaluations have identified the following concerns:
The survey needs to target the correct audience. It may be important to survey both pedestrians and motorists even if the treatment is for pedestrians. A survey instrument should make use of video clips, proposed signs or messages, computer animations, or other illustrations to further describe a situation and allow the respondent to more easily understand the questions that the practitioner is asking. Surveys should be performed with people in a similar situation to the one that the practitioner wishes to evaluate. Do not ask questions on paper illustrated only with pictures when the actual location, device, or scenario can be shown either from a recording in live action or in person.
An example of the principle in the last bullet is as follows: A survey is commissioned to determine how far a pedestrian would walk to take advantage of a device that could aid in crossing a busy street. The practitioner could ask a random sample of people in an office building, "Would you walk 100 ft to take advantage of the device?" or the practitioner could stop the same number of people at a midblock location on the street (100 ft away from the location of the proposed device) and ask if they would be willing to walk to the next intersection if that intersection had the device. The latter will produce more reliable and realistic answers because the respondent is making a decision in the same scenario that the practitioner wants to evaluate.
Comprehension
Survey methods can also be used to quantify actual comprehension of the meaning of a device rather than merely asking about an opinion or preference (see figure 29). Comprehension studies can be open-ended questions, (e.g., "What do you think this sign means?"), true/false, or multiple choice. For multiple-choice questions, care must be taken in the wording so that all options are plausible. Questions should be pretested by people with limited education to assess the readability of the questions by all people.
 |
| © Texas Transportation Institute |
Figure 29. Photo. Participants in a comprehension study provide their understanding of the meaning of a device.
Traffic control devices, in particular signs and marking patterns, are best tested by presenting them in a roadway context through illustrations, digitally edited photographs, or computer animations. Past research has shown that people respond better to sign testing in context as opposed to viewing a line drawing of a sign in isolation.(16) Care should be taken when developing illustrations and photographs to avoid including any extraneous information in the background that subjects may use to help them answer the question. For instance, a researcher may take an actual photograph of a location slated to receive a new pedestrian crossing sign. With digital editing software, the test sign can be inserted into the scene. Participants in comprehension tests will scour the photograph for clues, so if there is a speed limit sign visible in the scene, they may answer based on their experience with roads operating at that speed. Likewise, if there is a local business identifiable in the scene, the participants may recognize the location and answer based on their experience with that location.
Visibility
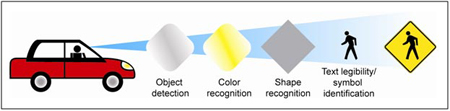
Visibility studies are often used to assess the effectiveness of traffic control devices for drivers and pedestrians. Visibility studies often measure the distance at which participants can identify some visual characteristic of a treatment. Most often, the order in which the different features of an object appear are as follows (see figure 30):
-
Detection: People can pick the treatment out of a busy scene or can detect its presence at a great distance. The treatment has attracted their attention. Conspicuity refers to how attention-grabbing a target is. The conspicuity of a target is dependent on its surroundings. For example, a red traffic signal is conspicuous against a blue sky but may be hard to see at night on a hill with red vehicle tail lights in the scene.
-
Color recognition: People can correctly identify the color of the target.
-
Shape recognition: People can correctly identify the shape of the target.
-
Text legibility/symbol identification: People can correctly identify the symbol or read the text. Legibility of a symbol or text does not necessarily mean that the person understands the intended message of the sign.
 |
| © Texas Transportation Institute |
Figure 30. Illustration. Distance at which drivers can discern characteristics of a traffic control device.
Visibility studies can be performed in a moving motor vehicle where the subject calls out his or her answer and an experimenter marks a distance on a distance measurement instrument. A natural lag occurs in this type of response between the time a subject speaks and the time an experimenter hits the button. Another approach is to have the subject perform the visibility test from a stopped motor vehicle at a number of preselected distances. The distribution of the number of people getting the correct answer at each of the preselected distances can then be derived. In either of these methods, research participants have a natural tendency to be conservative in their responses. In other words, they may have an idea as to what a sign says, but they will wait until they are absolutely certain before they respond. This response bias tends to decrease the absolute value of visibility responses. For this reason, it is best to interpret visibility responses as a comparison between two treatments tested rather than looking at the absolute values of the responses.
Driving Performance
Other measures of driving performance can be measured if the test vehicle is appropriately equipped (see figure 31). These types of instrumented vehicles are typically operated by larger research institutions. Sensors on throttle and brake pedals can measure pedal activation. When paired with global positioning system instrumentation, the location of the vehicle can be recorded. Cameras can be mounted on dashboards to record driver eye glances. Specialized equipment that minutely measures driver glances can be used. This type of eye-tracking equipment can also be either mounted on the dashboard or worn by the driver. This equipment is generally quite expensive and requires special calibration and labor-intensive data coding.
 |
| © Texas Transportation Institute |
Figure 31. Photo. Instrumented vehicle used for measurements during in-field evaluations.
EXAMINING TRAFFIC OPERATIONS
In contrast to using laboratories to evaluate treatments under controlled conditions, a number of in-field evaluations can be conducted to determine the effectiveness of a treatment using various MOEs. In-field evaluations are often used when a suitable laboratory environment cannot be created or when controlled evaluations have been satisfactorily completed and a real-world test is needed to confirm the results. The practitioner must remember that there are many ways to determine the effectiveness of a treatment, so specific MOEs must be defined prior to establishing the methodology of the in-field evaluation. Some MOEs (and examples of reportable results) are listed below. Sources of information on data collection techniques and procedures are listed in chapter 6 of this report.
Several techniques are available to collect noncrash traffic operational data, including manual and video methods. Each of these has advantages and disadvantages. The manual method is generally less costly because data collection and initial data reduction occur at the same time. Video requires staff resources to collect the data, and additional staff resources are required to watch the video and reduce the data. An advantage of video is that data reduction methods can be refined after initial data are collected since the video can be watched again to collect additional or different data. Also, questionable data can be validated using video, while the manual method may not provide that opportunity.
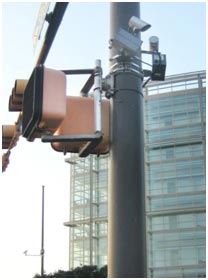
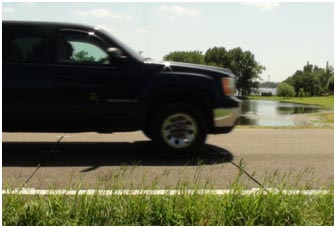
Volume
An evaluation may investigate changes in traffic or pedestrian volume to determine whether a new device affected the volume at a location (see figure 32). A new pedestrian treatment
(e.g., marked crosswalk, countdown signals, etc.) may increase pedestrian traffic at a location.
A warning device may also decrease traffic within a particular corridor.
 |
| © Texas Transportation Institute |
Figure 32. Photo. Pedestrian volume counters at the location of a new device.
Road User Behavior
Strictly speaking, measuring behavior is a difficult concept. However, specific types of behavior and their results can be evaluated through the use of well-defined MOEs. For example, to measure the acceptance of a new pedestrian pathway, an evaluation could examine changes in pedestrian travel paths before and after the treatment is installed. While the evaluation does not specifically ask pedestrians whether they like the new treatment, if use of the new pathway is high and pedestrian traffic on adjacent routes has decreased, one can reasonably infer that response to the new pathway is positive and the treatment is being accepted.
Evaluations of behavior should account for local conditions. As discussed previously, the evaluator should pay special attention to changes in conditions when using a before-after evaluation. For example, if the after evaluation of a new shared use trail is conducted during rainy weather, the resulting volume count may be too low to accurately reflect the true demand for the facility and would indicate a lower acceptance of the trail than is accurate. Similarly, extra attention should be considered to observed holidays. Counting pedestrian crossing maneuvers in front of a large office building on a holiday may produce counts that are lower than normal and would not provide an accurate representation of demand for the crossing.
It is also important to consider user profiles. That is, the evaluation should consider who uses the treatment and who avoids it. A treatment that works well in one location might not work as well in another location if the potential user group is substantially different.
The evaluation must also clearly define how the road user behavior is to be measured (see figure 33). For example, an operational definition of an aborted crossing might be "pedestrian returns to curb after having both feet in roadway." The definition selected may influence how the data are collected. Technicians may not be able to determine if both feet were in the roadway from the video. Therefore, on-site data collection may be required. An example of an operational definition of running might be "crossing an entire traffic lane in three or less frames of film" (or within a set amount of time). Such a concise statement of the elements used to define a behavior is invaluable for comparing the results between the before and after periods and between different studies. Good operational definitions also allow others to evaluate performance of a traffic control device in different regions of the country. To be able to verify the performance of the device, the MOE needs to be clearly defined.
 |
| © Texas Transportation Institute |
Figure 33. Photo. Pedestrian running through crosswalk to avoid oncoming vehicle.
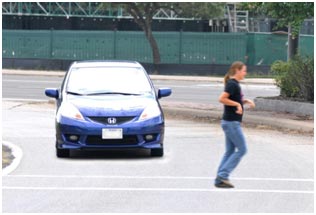
Erratic Maneuvers or Conflicts
A number of traffic-related measures can be evaluated to gain an appreciation for the comprehension or acceptance of a device. If a device is commonly violated or if the number of conflicts or erratic maneuvers increases at the treatment site, it is likely that the treatment is not well understood or is being disregarded (see figure 34).
 |
| © Texas Transportation Institute |
Figure 34. Photo. Pedestrians and driver experiencing a near miss.
For this type of evaluation, the study could record near misses, reversals, and conflicts near or as a result of the treatment. This directly reflects the comprehension of the treatment and provides an indication of users' confusion. If collisions are narrowly avoided or if users commonly and abruptly change their intended course through the treatment area, it is likely that the treatment is not well understood or is not providing useful information.
Compliance, Violations, and Risk Taking
Compliance or violation can be the measure for an evaluation of respect for a particular traffic control device. The user groups studied could be motorists, pedestrians, bicyclists, or any combination of the three, depending on the type of treatment. A compliance evaluation records violations (e.g., non-compliance with the treatment, violations of traffic law, etc.) and typically reports the results as the frequency of violation or the rate of violation as a percentage of the total number of opportunities to comply. For example, motorist compliance with a new pedestrian signal or beacon could be measured in terms of a compliance rate. This rate is expressed as the percentage of yielding vehicles, out of all approaching vehicles that should have yielded (e.g., a 90 percent compliance rate means that of 100 vehicles approaching an activated beacon, 90 of them yielded to the crossing pedestrian). Other examples include bicyclists stopping at a stop sign or pedestrian compliance with the intent of a device (e.g., whether pedestrians are pushing a call button).
One approach can also measure risk-taking behavior. This approach is related to behavioral evaluations previously discussed and attempts to measure users' willingness to travel through a treatment area under less-than-ideal conditions. This approach requires very specific definitions of what constitutes a risk at that location (e.g., crossing a street within 2 s of an oncoming vehicle). Risk-taking can be measured in terms of frequency (i.e., how often risky behavior is observed) or in terms of change (i.e., the difference in frequency before and after the treatment is installed).
Compliance and risk evaluations can be labor intensive and complex. It is therefore important to create detailed evaluation procedures for data collectors to follow. The means of observation (e.g., in-field real-time evaluation versus recorded video surveillance), the definition of the events of interest, and the ability of the data collectors to repeatedly follow the procedures are all critical components of this type of evaluation. If an event is qualitative, there must be specific scoring criteria that data collectors use for each event. Privacy concerns must also be considered, particularly if recorded video is to be used. Recorded images cannot be used to obtain personally identifiable information and cannot be used for purposes outside the evaluation without the permission of the subjects being recorded. Data collectors should be properly trained in procedures and protocols before commencing such a study.
Citations
If the data are available, examining traffic citations relevant to the countermeasure proposed and issued at the treatment site may be useful. Using citations as the sole evaluation method is not desirable because the number of citations is often heavily influenced by the enforcement levels used in a region.
Some of these citations can also be documented from crash reports if that is already part of the evaluation. Again, care must be taken in interpreting the citation record because the actual violation cited may vary depending on the severity of the crash. For citations that were not issued in the aftermath of a crash, obtaining details would probably require a separate request to the law enforcement agency of interest and would likely require a number of assurances to protect the privacy of those involved. Those assurances (e.g., that no one outside of the study would have access to the data, that no one is personally identified in the study results, etc.) are typically similar, if not identical, to those required to use crash data, but citation data may be even more sensitive.
Citation data can enable the practitioner to gain a perspective on operations at a site that would not be available during a typical in-field evaluation, or even through crash data, because citations are not necessarily associated with a condition, time of day, or crash. However, if there is an identifiable pattern of citations issued, that information may contribute to a more informed decision on the most appropriate countermeasure.
Speed
In a discussion on speed, it is important to accurately define speed. ITE's Manual of Transportation Engineering Studies describes a number of speed study methods.(17) It gives several definitions of speed, depending on the purpose of the study to be used, as follows:
-
Speed is the rate of movement of a vehicle in distance per unit of time. Common units are miles per hour (mi/h), feet per second (ft/s), kilometers per hour (km/h), and meters per second (m/s).
-
Spot speed is the instantaneous measure of vehicle speed at a specific location on a roadway.
-
Time-mean speed is the arithmetic mean or average of several spot-speed measurements. It is the sum of the measured spot speeds divided by the number of measurements.
-
Space-mean speed is another type of average speed. It is the length of a segment divided by the mean travel time of several vehicles or trips over the segment. Studies involving space-mean speed are less common than those using time-mean speed.
-
Median spot speed is the middle value in a series of spot speeds that have been ranked in order of magnitude. It is the midpoint of a range of speeds.
-
Modal spot speed is the value that occurs most frequently in a sample of spot-speed measurements. It is the most typical value in a range of speeds.
-
85th percentile speed is the speed at or below which 85 percent of the total observed values fall in a sample of measured spot speeds. Other values besides 85 percent can be used for an ith percentile spot speed—the value at or below which i percent of the spot speeds occur. Typical engineering practice is to use the 85th percentile.
-
Pace is the specified increment of spot speed, usually 10 mi/h, that includes the greatest number of speed measurements.
-
Standard deviation is a commonly used measure of the spread of individual speeds around the mean. It is the square root of the sum of squares of the deviations of the individual spot speeds from the mean speed divided by the number of measurements less one.
Speed data are collected by one of two general approaches: indirect and direct measurements. Indirect measurements provide an estimate of speed because they are actually measurements of time for a vehicle to travel a known distance between two points. The more commonly used method is direct measurement. LIDAR or radar guns measure speeds of selected target vehicles. On-pavement sensors record speeds of every vehicle traveling through the study site.
In a simple spot-speed study, speed values are collected and recorded at key locations (e.g., incremental locations on an approach to a new pedestrian signal). However, when those speed values are analyzed and results are reported, it is important to report more than just an average. The variability of the speed (e.g., 85th percentile, standard deviation, mode, minimum, and maximum) should also be reported. These statistics provide a better overall picture of speed characteristics at the study site. Another important speed value to report in pedestrian- or bike-related studies is the average speed +5 or +10 mi/h, an estimation of whether a collision at that speed is within the range of survivability for a pedestrian or cyclist can be an important measure of a treatment's effectiveness.
Another speed-related study involves identifying the location where braking is initiated by approaching vehicles. This measure produces an indication of how well drivers see (and comprehend) a treatment (such as a pedestrian signal) from a distance. Early, gradual braking means that approaching drivers are aware of and understand the treatment and are responding to it, as opposed to a pattern of later panic braking. This type of study typically requires the use of one or more video cameras and a study site that has a series of well-defined visual landmarks to aid the evaluator in determining the location at which each vehicle's brake lights are activated.
Related to braking location is a study that records the deceleration profile of approaching vehicles (see figure 35). This method helps the evaluator to understand whether the typical driver uses gradual or panic braking, in addition to determining the exact location where braking begins. This study requires the use of a radar or LIDAR gun to collect a series of closely spaced spot speeds and their corresponding locations to generate the target vehicles' speed-distance profiles, which can then be converted to deceleration profiles.
 |
| © Texas Transportation Institute |
Figure 35. Photo. Road tubes used to determine the deceleration profile
of approaching vehicle.
As with all types of field studies, safety is a paramount consideration when conducting spot-speed studies. The measurement of speeds often involves workers being in proximity to the roadway or within the actual travel lanes. Thus, workers must use care and vigilance at all times while working near the roadway. Workers should park their vehicles off the traveled way, wear appropriate protective clothing (e.g., reflective vests, hard hats, etc.), and act in a manner that does not distract motorists or adversely affect traffic speeds. Workers should conduct their in-roadway work under low-volume conditions when possible, and they should use lane-closure procedures, traffic control assistance, and warning devices appropriate for conditions.
Furthermore, workers utilizing LIDAR or radar guns to collect speeds should take extra precautions to be inconspicuous during the data collection in an effort to minimize any effects their presence may have on approaching drivers. If drivers are under the impression that the researchers are law enforcement officers and are conducting speed enforcement, the drivers will likely travel slower, brake earlier, or make other changes in their behavior, adversely affecting the study results.
Delay or Travel Time
Delay may be an appropriate MOE for evaluating treatments such as changes to signal timing or restrictions of movement (e.g., no left turn during selected hours). If, for example, a pedestrian-related treatment is to be installed with minimal impact on the adjacent vehicular traffic stream, an evaluation of delay can provide an indication of the treatment's effects on vehicular traffic. Delay or travel time can also be used to determine if a traffic control device reduces a pedestrian's trip time.
Delay can be determined through multiple methods, but the two most common are in-field evaluations and computer simulation. In-field evaluations require on-site staff to observe and record data, or conditions may be recorded and viewed off site. If a treatment site has high pedestrian volumes, it is likely that a procedure using video-recording will be necessary to document the delay for all road users passing through the site. There are a variety of computer modeling and microsimulation software packages, each with its own capabilities, strengths, and weaknesses. A computer-based delay study requires selecting an appropriate software package that can evaluate the treatment under consideration.
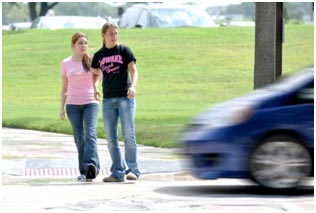
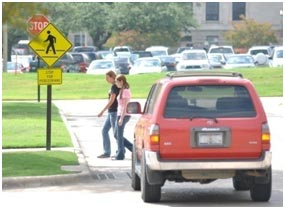
Gap
Gap-related studies are important when analyzing traffic movements that conflict with higher-priority movements, including movements controlled by stop signs, right turns on red, permissive left turns, and midblock pedestrian crossings (see figure 36). Gaps at school crossings are another application. The definitions related to gap studies are important and may include the following:
-
Gap is the time or distance between the back of one vehicle and the front of the trailing vehicle.
-
Headway is the time or distance between a point (front, center, or back) of one vehicle and the same point of the trailing vehicle.
-
Lag is the time or distance between the arrival of a vehicle or pedestrian at a minor street and the front of the next conflicting major-street vehicle arriving at that minor street.
 |
| © Texas Transportation Institute |
Figure 36. Photo. Pedestrians using a gap in traffic to cross the street.
Other Potential/Unique Measures
There may be other MOEs that are appropriate for a given location or treatment depending on the desired outcome of the treatment. These measures may be less common, but rarity should not automatically exclude a potential measure if it is appropriate for the conditions. Unique measures may be related to behavioral measures discussed previously, but they likely will have a distinctive characteristic related to the specific nature of a location or a treatment. Below are some examples of some less common measures that can apply to pedestrian or bicycle treatment evaluations:
-
Right turn on red: A study of a new marked crosswalk could evaluate the frequency of this maneuver before and after the treatment was installed, or it could determine the frequency of complete stops versus rolling stops.
-
Crossing maneuvers late in the pedestrian clearance interval: An evaluation of new countdown signals could record the amount of time prior to the onset of steady "DON'T WALK" when pedestrians begin crossing maneuvers.
-
Bicycle lane volume: Comprehension, effectiveness, and acceptance of a newly installed bicycle lane can be evaluated by comparing the number of bicyclists using the new bicycle lane to the number using the vehicle lane or sidewalk before and after its installation.
EXAMINING CRASHES
As mentioned previously, a study of the crash history at one or more treatment sites can be used to evaluate safety as long as certain steps are taken into account for variables that may change over time. There are several study approaches using this methodology in a before-after with comparison group study, and a few general principles are appropriate, as follows:
Counting only fatal or fatal/injury crashes frequently results in sample sizes that are too small to make conclusions from a statistical analysis. Unless a unique characteristic of the evaluation must consider the actual installation period, exclude a specified time immediately after the installation from the evaluation. It is prudent to begin the after period 30, 60, or 90 days following the conclusion of installation rather than on the day after installation is complete. This allows road users to adapt to the new treatment. Where possible, at least 3 years of crash data in each time period studied, before and after, should be included. The practitioner should identify the appropriate jurisdiction or authority that maintains the records for crashes at the study sites. In addition, how the records are stored can be of value. For example, if crashes are only located to the nearest 0.1 mi then a search of all crashes occurring at 0.45 mi may return zero crashes when the search should have been from 0.4 to 0.5 mi. The practitioner needs to determine the locations that should be included in the study. For an intersection, simply gathering the crashes that occurred at the specific point where the streets cross may be insufficient. Intersection treatments can affect crashes along the approach legs. A pedestrian treatment may also affect pedestrian crossings that occur at midblock. Therefore, the number of crashes occurring both at midblock and at the intersection should be examined.
The following are additional observations about crash studies that practitioners should consider for pedestrian treatments:
Typically, the severity of pedestrian crashes is so high compared to other motor vehicle crashes that the elimination of a few pedestrian crashes will result in a high safety dividend and a high benefit/cost ratio. Use these results appropriately for the treatment being evaluated. Pedestrian crash rates need to account for both pedestrian volumes and motor vehicle volumes. Percent reduction in crashes is a readily understandable measure of change in crashes for a given treatment. Accompanying the percent reduction with other data, such as the number of crashes (frequency) and crash rate (typically crashes per million vehicle miles or million entering vehicles with pedestrian volumes considered) will provide an increased understanding of a treatment's effectiveness. Research into how best to conduct crash evaluations has increased in recent years. The use of an EB method is an example of a technique developed to specifically address issues associated with examining road crashes. Understanding and appropriately employing these techniques is critical to identifying findings that are both accurate and defensible.
THE IMPORTANCE OF PEDESTRIAN VOLUMES
Unlike vehicle crashes, crash rates for pedestrians are typically not used since pedestrian volumes are usually not known. It is uncommon for agencies to invest resources to collect the systemwide pedestrian counts that are needed to develop pedestrian crash rates. This lack of exposure data emphasizes the need to collect pedestrian volumes both before and after treatment installation so that changes in crash rates can be accurately reported.
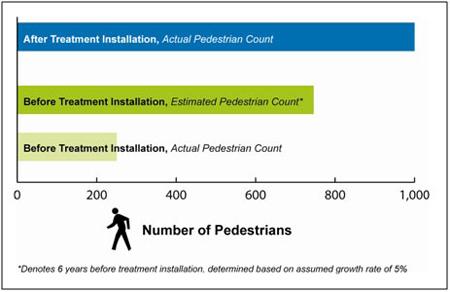
While an assumed growth rate has frequently been used to adjust traffic volumes from year to year, this approach has serious limitations with respect to treatments that could increase the pedestrian volume. A constant growth rate used to adjust a current pedestrian volume to a previous-year pedestrian volume could result in an inappropriately high pedestrian volume for the years prior to the installation of the treatment. Computed crash rates would therefore be unreliable.
For example, consider a pedestrian count conducted after a treatment was installed was 1,000 pedestrians per day, and the city had been seeing a 5 percent annual growth rate. The number of pedestrians that existed at that site 6 years previously would be 746 pedestrians (1,000×1.05-6). However, if the treatment resulted in additional pedestrians using the location, this cannot be accurately determined from the count. Any computation of previous site volumes would be inaccurate. So if there were really only 250 pedestrians in the before condition, then the rate should have been 1 crash in 250 rather than 1 crash in 746 pedestrians. Figure 37 shows a graphic representation of this example.
 |
| © Texas Transportation Institute |
Figure 37. Graph. Estimated versus actual number of pedestrians at a crossing.
|