Evaluation of Pedestrian and Bicycle Engineering Countermeasures: Rectangular Rapid-Flashing Beacons, HAWKs, Sharrows, Crosswalk Markings, and the Development of an Evaluation Methods Report
CHAPTER 4. SAFETY EFFECTIVENESS OF THE HAWK PEDESTRIAN CROSSING TREATMENT
This chapter summarizes the FHWA report, Safety Effectiveness of the HAWK Pedestrian Crossing Treatment, FHWA-HRT-10-042.(17)
OBJECTIVE
The city of Tucson, AZ, developed the HAWK pedestrian crossing beacon in the late 1990s to assist pedestrians in crossing major arterials.(18) Previous research found driver yielding percentages above 95 percent for the HAWK treatment even on major streets with multiple lanes or higher speeds.(10) Because of the limited number of promising treatments with high yielding rates on major arterials, FHWA sponsored this study to evaluate the safety effectiveness of the HAWK device.
BACKGROUND
Although several roadway treatments are available to address pedestrian concerns, only a few are appropriate for high-speed or wide roadway crossing conditions. The HAWK beacon was developed to address these conditions. At a HAWK crossing, drivers receive multiple cues emphasizing the potential presence of a pedestrian. These cues include the HAWK beacon
(two red lenses over a single yellow lens), high-visibility crosswalk markings (ladder-style markings as opposed to only two transverse white lines), a stop bar approximately 50 ft from the crosswalk, 8-inch solid lane lines between through travel lanes, signs which are in some cases illuminated that read "CROSSWALK," and school warning signs. When activated, the HAWK provides drivers with a red indication informing them to stop, allowing pedestrians to cross the major roadway. Figure 4 shows an example of the current head configuration for a HAWK. At the time of this study, HAWKs were being used at more than 60 locations in Tucson, AZ.
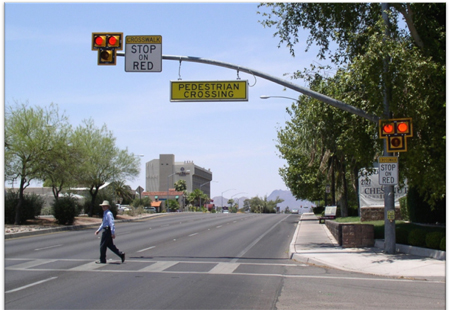
Figure 4. Photo. Example of a HAWK treatment in Tucson, AZ.
The HAWK beacon is dark until it is activated by a pedestrian. Activation triggers the warning flashing yellow lens on the major street. After a set time, the indication changes to a solid yellow light to inform drivers to prepare to stop. The beacon then displays a dual solid red light to drivers on the major street and a walking person symbol to pedestrians. At the conclusion of the walk phase, the beacon displays an alternating flashing red light, and pedestrians are shown an upraised hand symbol with a countdown display informing them of the time left to cross. During the alternating flashing red lights, drivers can proceed after coming to a full stop and checking that pedestrians have already crossed their lane of travel. Each successive driver is legally required to come to a full stop before proceeding during the alternating flashing red phase.
The alternating flashing red phase allows the delay to traffic to match the actual crossing needs of the pedestrians. Drivers can proceed with a stop-and-go operation during the flashing
red phase. If pedestrians need more time, then the drivers remain stopped until they finish crossing. The ability to balance the pedestrian needs with driver delay is a valuable component
of the HAWK treatment. Concerns have been expressed regarding driver behavior and understanding of the dark phase and the flashing red phase. Experiences in Tucson, AZ, have demonstrated that with proper education and experience, drivers understand when they should stop and when they should resume travel. The city of Tucson, AZ, has conducted public campaigns and increased enforcement to teach and encourage appropriate driver and pedestrian behavior at HAWK crossings as well as at all pedestrian crossings.
The city of Tucson, AZ, uses the following criteria when considering the installation of
a HAWK:
- Presence of a school crossing.
- Pedestrian crossing activity.
- Traffic speed.
- Gaps.
- Crash experience.
- Number of travel lanes and traffic volumes.
- Spacing of traffic control along the route.
Following the completion of this study but prior to its publication, the 2009 MUTCD was released.(2) It includes information about the pedestrian hybrid beacon, which is similar to the HAWK. The material on pedestrian hybrid beacons in the 2009 MUTCD differs from the HAWKs included in this safety study in the following ways:
- Section 4F.02 of the 2009 MUTCD states, "When an engineering study finds that installation of a pedestrian hybrid beacon is justified, then: A. the pedestrian hybrid beacon should be installed at least 100 feet from side streets or driveways that are controlled by STOP or YIELD signs."(2) All 21 HAWKs in this study were located either at a minor intersection (where the minor street was controlled by a STOP sign) or at a major driveway (where the driveway was controlled by a STOP sign).
- The 2009 MUTCD includes an R10-23 sign with the symbolic red circle and a white background for the crosswalk section of the sign (see figure 5).(2) The signs typically used at the HAWK locations in Tucson, AZ, do not have the symbolic red circle, and the crosswalk background is yellow.
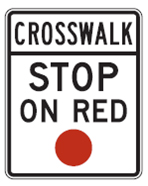
Figure 5. Photo. R10-23 sign from the 2009 MUTCD.(2)
METHODOLOGY
This section presents the safety benefits of the HAWK device. The before-after evaluation used an EB method to compare the observed crash frequency during the after period (with the treatment installed) to an estimate what the crash frequency would have been during the after period if the treatment had not been applied.(19)
Development of Safety Performance Functions
The first step in the before-after EB method was to develop and calibrate safety performance functions (SPFs) using data from a reference group. Development of the SPFs involved determining which predictor variables should be used in the model, how the variables should be grouped, and what model should be used. The major street and minor road ADT values are often the key variables in developing SPFs for intersections. In addition, pedestrian volumes are likely to play an important role in pedestrian crashes. To account for additional intersection-to-intersection variability (other than that caused by the differences in traffic volumes and pedestrian volumes), intersection type, median refuge presence, number of lanes, and major street speed limit were also considered in the SPF predictions.
Site Selection and Geometric Data
The city of Tucson, AZ, provided the research team with a list of all HAWKs that were
installed or planned. Sites planned or installed less than 18 months prior to this study were not evaluated. Only sites with the current head configuration (see figure 4) that were newly installed (21 locations) were included in the before-after study. The previous head configuration had a similar appearance as a vertical traffic signal.
Crash evaluations are beneficial when a reference group of similar sites without treatment is identified. Two potential reference groups were identified, and the safety effectiveness estimate for HAWKs were derived using each group. Reference group 1 included 36 signalized and
35 unsignalized intersections. Because of concerns with including signalized intersections, reference group 2 was developed and consisted of 102 unsignalized intersections.
Traffic Counts
Several sources were used to obtain vehicle counts including traffic counts (or historical maps) available on the Web and historical counts from the Pima Association of Governments.(20,21) Vehicle counts from existing sources were identified for most of the major streets in the intersections. None of the existing sources had pedestrian counts available. Therefore,
2-h pedestrian counts were collected during spring 2008 and spring 2009. The city of
Tucson, AZ, provided the research team with 24-h video surveillance of five HAWK sites. The number of pedestrian crossings for each hour was counted from the videos, and pedestrian crossing distributions were determined and used to adjust the 2-h count into 24-h counts. Appropriate seasonal variations were determined from Traffic Volumes Map, which noted that winter visitors and college students contributed to higher volumes during spring.(21)
Study Periods
For the before-after study, the goal was to have 36 months of before data and 36 months of
after data. The before period reflected month 38 to month 2 prior to the installation date of
the HAWK. The calculations assumed 2 months prior to the installation date as construction.
The 2 months following installation of the HAWK were assumed to be a learning period
for drivers to become familiar with the treatment. The after period occurred 2 to 38 months following the installation of the HAWK or until December 31, 2007, which was the limit of crash data available.
The number of months in the after period for the 21 HAWK sites varied depending on when the HAWK was installed. The majority of the sites had a 32-month or greater after period, with more than 80 percent of the sites having at least a 28-month after period. Reference group sites had the same time period in their before and after periods as their corresponding HAWK site.
Crash Data
Crash data were supplied by Tucson, AZ, and street names were used to match crashes with the geometric database. Identifying all crashes with matching street names should capture the crashes that could be influenced by the intersection's traffic control; however, it can also capture crashes that would not have been influenced. The intersection-related (IR) variable may provide insight into whether or not the crash is related to the intersection's traffic control. The permitted responses for IR crashes were "yes," "no," or blank, and about a third of the crashes left this field blank. A comparison of the number of IR crashes for a sample of intersections to information from a previous study indicated that the IR variable may be too restrictive. Therefore, the following two crash datasets were used in the evaluations:
- Intersecting street name (ISN) crashes: Identified by matching the street names for
the intersection.
- IR crashes: Identified as crashes in the ISN crash dataset with "yes" for the IR code.
The following types of crashes from each of the crash datasets were considered:
- Total crashes: Included all crashes identified.
- Severe crashes: Included all crashes with an injury severity code of possible injury, nonincapacitating injury, incapacitating injury, or fatal injury.
- Pedestrian crashes: Included all crashes with the type of collision coded as pedestrian.
Aggregating Crash Data
In developing the SPFs, the crash counts at the reference sites could be treated as aggregated data over the entire study period (including both the before and after periods) or as disaggregated data with two crash counts from each intersection—one for the before period and one for the after period. Aggregating the data is one way to account for the correlations that might be present in the crash counts when the intersections are included twice (once for the before period and once for the after period) in estimating the SPFs. Disaggregating the data allows researchers to account for general time trends (if any exist) within the two periods. For the disaggregated data, it is desirable to use the generalized estimating equation approach for estimating the SPF coefficients. This incorporates the potential correlation in the before and after crash counts from the same intersection. Both approaches were explored in this study.
OBSERVATIONS
Table 3 summarizes the number of crashes by traffic control type. HAWKs were installed to assist pedestrians in crossing the roadway; therefore, installing the device should have had an impact on pedestrian crashes. The impact on total or severe crashes was not as intuitive. Using IR crashes, the HAWK sites experienced a decrease of about 34 percent in the total crash rate after installation. The 102 unsignalized intersections in reference group 2 experienced a decrease of 9 percent, and the 36 signalized intersections in reference group 1 had a 17 percent decrease. These observations indicate that citywide conditions may be contributing to the reduction in crashes since all types of intersection controls showed reductions in total IR crashes.
The HAWK sites experienced a significantly large decrease of 86 percent in the pedestrian IR crash rate after installation. The 102 unsignalized intersections in reference group 2 experienced an increase of 143 percent in pedestrian crashes. Therefore, if citywide conditions are contributing to reductions in total crashes, these conditions do not have the same impact on pedestrian crashes. Other factors may be contributing to a rise in pedestrian crashes at unsignalized intersections but not signalized and HAWK intersections.
In table 3, it is observed that HAWK locations have crash rates higher than unsignalized intersections. For this dataset, the HAWK locations were associated with a slightly greater number of crashes per million entering vehicles and pedestrians as compared to the nearby unsignalized intersections. This observation does not imply that if the HAWK was removed, the crash rate for a given intersection would be similar to the crash rate identified for the neighboring unsignalized intersections. The crash rate at the HAWK sites when they were unsignalized intersections (i.e., before the HAWK was installed) exceeded the crash rate for nearby unsignalized intersections. Therefore, conditions at the HAWK locations before the treatment was installed were generating crashes in greater numbers than the unsignalized intersections. This indicates that those intersections were associated with conditions that resulted in a higher number of crashes. Addressing those conditions with a HAWK resulted in a decrease in total crashes and a large decrease in pedestrian crashes. The following section provides the findings from the statistical evaluation.
Table 3. Crash data for before-after study by groups.
Treatment
Group |
Measure |
ISN Crashes |
IR Crashes |
Before |
After |
Percent Change |
Before |
After |
Percent Change |
HAWK sites (21) |
Frequency |
11.0 |
9.2 |
-17 |
5.0 |
3.3 |
-34 |
Total crashes/MEV&P1 |
0.748 |
0.618 |
-17 |
0.341 |
0.223 |
-35 |
Severe crashes/MEV&P |
0.265 |
0.210 |
-21 |
0.138 |
0.094 |
-32 |
Pedestrian crashes/MEV&P |
0.029 |
0.005 |
-83 |
0.017 |
0.002 |
-86 |
Pedestrian crashes/MEP2 |
3.081 |
0.511 |
-83 |
1.826 |
0.255 |
-86 |
Reference group 1: signalized intersections (36) |
Frequency |
44.9 |
41.9 |
-7 |
19.6 |
16.8 |
-14 |
Total crashes/MEV&P |
1.953 |
1.788 |
-8 |
0.854 |
0.716 |
-16 |
Severe crashes/MEV&P |
0.549 |
0.503 |
-8 |
0.294 |
0.241 |
-18 |
Pedestrian crashes/MEV&P |
0.020 |
0.016 |
-23 |
0.010 |
0.008 |
-16 |
Pedestrian crashes/MEP |
2.051 |
1.546 |
-25 |
1.025 |
0.839 |
-18 |
Reference group 1: unsignalized intersections (35) |
Frequency |
4.2 |
4.3 |
3 |
1.6 |
1.3 |
-17 |
Total crashes/MEV&P |
0.285 |
0.292 |
2 |
0.108 |
0.090 |
-17 |
Severe crashes/MEV&P |
0.098 |
0.088 |
-10 |
0.043 |
0.038 |
-10 |
Pedestrian crashes/MEV&P |
0.006 |
0.009 |
52 |
0.003 |
0.004 |
42 |
Pedestrian crashes/MEP |
1.383 |
2.078 |
50 |
0.615 |
0.866 |
41 |
Reference group 2: unsignalized intersections (102) |
Frequency |
5.9 |
6.1 |
3 |
2.4 |
2.1 |
-9 |
Total crashes/MEV&P |
0.418 |
0.430 |
3 |
0.166 |
0.150 |
-9 |
Severe crashes/MEV&P |
0.140 |
0.141 |
0 |
0.060 |
0.056 |
-6 |
Pedestrian crashes/MEV&P |
0.006 |
0.011 |
93 |
0.001 |
0.003 |
143 |
Pedestrian crashes/MEP |
1.233 |
2.297 |
86 |
0.257 |
0.602 |
134 |
1Crashes/MEV&P = Type of given crash (total, severe, or pedestrian crashes) per million entering vehicles and pedestrians (MEV&P).
2Pedestrian crashes/MEP = Pedestrian crashes per million entering pedestrians (MEP).
Note: Frequency is expressed as the average annual number of total crashes for a site with the given intersection control and study period.
RESULTS
To account for the effects of variables in crash reduction as well as the potential regression-to-the-mean bias, an EB approach was employed to identify the safety effectiveness of the HAWK treatment. The main corresponding report includes the reasonable SPFs identified in this study.(17) Although the magnitude of the safety effectiveness estimate varies to some extent as different predictors are included in the SPFs, the results did not seem to change materially.
Table 4 summarizes the percent reduction and whether the findings were significant at the
95 percent level from the different approaches used in evaluating the HAWK beacon.
Table 4. Summary of results.
Reference Group (Aggregation) |
Percent Reduction
(Significant at the 95 Percent Confidence Level) |
Total Crashes |
Severe Crashes |
Pedestrian Crashes |
ISN Crashes |
1 (aggregated) |
15 (Yes) |
11 (No) |
57 (Yes) |
2 (aggregated) |
14 (Yes) |
13 (No) |
59 (Yes) |
2 (disaggregated) |
19 (Yes) |
14 (No) |
69 (Yes) |
IR Crashes |
1 (aggregated) |
29 (Yes) |
18 (No) |
56 (No) |
2 (aggregated) |
29 (Yes) |
15 (No) |
51 (No) |
2 (disaggregated) |
23 (Yes) |
8 (No) |
65 (Yes) |
The results for total crashes were similar regardless of the approach used to evaluate the data. The reduction was about 16 percent for ISN crashes (14 to 19 percent) and 27 percent for IR crashes (23 to 29 percent), which were all significant at the 95 percent confidence level.
There were similar results for pedestrian crashes, with the disaggregate approach resulting in higher reductions (65 or 69 percent) than the aggregate approaches (between 51 and 59 percent). As seen in several evaluations, severe crash results were not significant. The smaller sample size probably affected the results.
Although the safety effectiveness estimate did not change significantly with which reference group was used, reference group 2 was chosen as the more appropriate reference group because the HAWK was installed at a previously unsignalized intersection in most cases.
SUMMARY AND CONCLUSIONS
The objective of this study was to evaluate the safety effectiveness of the HAWK device. A before-after EB method was used, which accounts for possible regression-to-the-mean bias as well as traffic, weather, citywide public relations campaigns, and other factors that change over time. SPFs were developed using reference site data consisting of nearby intersections that did not have HAWK treatments. The study included 21 intersections where a HAWK had been installed and two reference groups. Evaluation approaches explored the following:
- Three types of crashes (total, severe, and pedestrian).
- Two methods for identifying crashes (ISN and IR).
- Two reference groups (reference group 1 with 36 signalized and 35 unsignalized intersection and reference group 2 with 102 unsignalized intersections).
- Two ways to combine the reference group before and after data (aggregated
and disaggregated).
The crash prediction during the before period was calculated from SPFs and combined with the observed crash count for the before period by using a weighted average to control for regression-to-the-mean bias. This weighted average was adjusted for differences in duration and traffic volumes (and general time trends if any existed) between the before and after periods to lead to a crash prediction for the after period had the treatment not been applied. EB then compared this predicted value to the observed crash frequency for the after period.
Two crash datasets were used in the before-after evaluation. In theory, the IR crash dataset should better represent crashes that would be affected by the traffic control at the intersection. A closer review revealed that the IR code was not used in over a third of the crashes; therefore, too many crashes may have been eliminated. The ISN crash dataset, however, may include crashes that are not related to the traffic control. Therefore, both datasets were considered. The IR crashes were considered as the more appropriate dataset for total and severe crashes. The ISN crash dataset may be more representative of the change in pedestrian crashes since the HAWK device could induce pedestrians to walk an additional distance to benefit from an activated traffic control device.
The before-after evaluation results were as follows:
- There was a 29 percent reduction in total crashes, which is statistically significant at the 95 percent confidence level.
- There was a 69 percent reduction in pedestrian crashes, which is statistically significant at the 95 percent confidence level.
- There was a 15 percent reduction in severe crashes, which is not statistically significant at the 95 percent confidence level.
The prime objective of a HAWK is to provide pedestrians with safe crossing opportunities. As such, a reduction in pedestrian crashes was expected to be associated with the HAWK, and a statistically significant reduction in pedestrian crashes was found. The installation of the HAWK was also associated with a statistically significant reduction in total crashes. It should be noted that the HAWK treatment, just like any other warning traffic control device, may not work as effectively if it is overused. In addition, the high crash reductions identified in this study may not be achieved at future locations if the site has different characteristics, such as reduced pedestrian activity.
|


