U.S. Department of Transportation
Federal Highway Administration
1200 New Jersey Avenue, SE
Washington, DC 20590
202-366-4000
Federal Highway Administration Research and Technology
Coordinating, Developing, and Delivering Highway Transportation Innovations
 |
| This report is an archived publication and may contain dated technical, contact, and link information |
|
Publication Number: FHWA-RD-98-165
Date: July 1999 |
Guidebook on Methods to Estimate Non-Motorized Travel: Overview of Methods3.0 Guide to Available Methods
3.1 Overview of MethodsThis section describes eleven types of quantitative methods that can be used to forecast non-motorized travel demand or that otherwise support the prioritization and analysis of non-motorized projects. These methods are categorized according to four major purposes, as shown and described in table 3.1. Figure 3.1 illustrates how these four purposes relate to each other to support demand estimation. Following the overview, section 3.2 summarizes key characteristics of the methods. Section 3.2 also suggests appropriate methods according to specific purpose such as forecasting the number of new users of a bicycle/pedestrian trail. Table 3.1 Categorization of Available Methods.
Table 3.1 Categorization of Available Methods (continued)
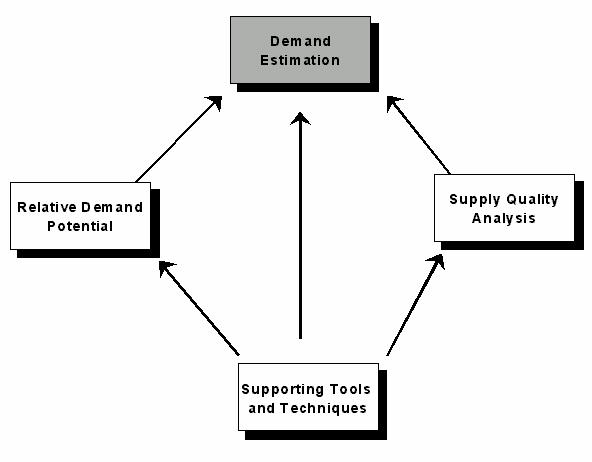 Figure 3.1: Relationship of Methods Supporting Demand Estimation
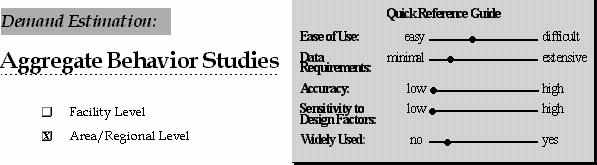
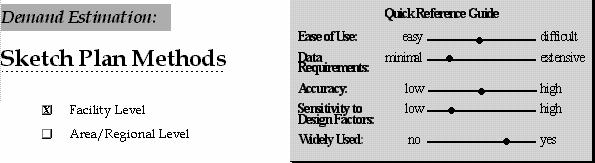
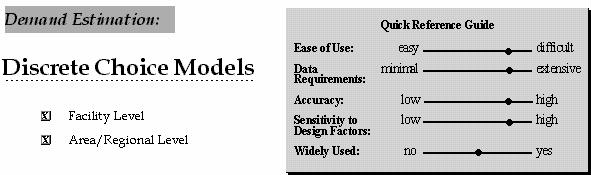
For each of the 11 methods, a one-page summary is provided which includes an overview of the method, typical applications, advantages and disadvantages, and one or two real-world examples. Each summary also includes a quick reference guide, which provides a subjective rating of the method for five factors as described below. The ratings are provided only as a general assessment of the method's capabilities, and the quality of specific applications of each of these methods may vary. More detail on the specific ratings for each method is given in table 3.2, which follows the individual method overviews. The five factors and criteria used to rate the factors are as follows:
Finally, the overview page indicates whether the method can be used to predict demand at the facility level, area/regional level, or both. Facility-level methods predict the number of users of a specific facility such as a non-motorized trail, bicycle lane, or pedestrian bridge. Area-level methods predict total bicycle or pedestrian trips for an entire area such as a city, census tract, or other geographic area. Section 2.0 of Supporting Documentation presents a more indepth, structured description of each method as well as specific variations and applications of the method. Section 3.0 contains bibliographic references for the real-world examples highlighted in this section. Section 4.0 identifies useful contacts, including individuals and organizations, in the area of non-motorized travel estimation. 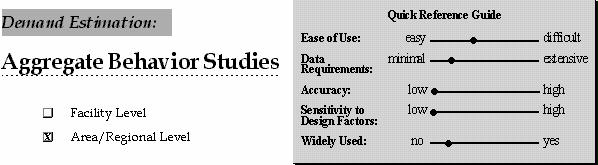
Overview Aggregate behavior studies involve the development of models to predict mode split and/or other travel behavior characteristics for an aggregate population, such as residents of a census tract or metropolitan area. Prediction is based on characteristics of the population and of the area. An example of an aggregate model is an equation to predict the percentage of trips taken by bicycle in individual census tracts in a metropolitan area, based on the average income of the tract and on the total length of bike- ways in the tract. Typical Applications Aggregate behavior studies have been conducted in the United States and the United Kingdom, primarily utilizing census data and other readily available data sources to predict work-trip mode split at a tract, city, or metropolitan-area level. Advantages Aggregate behavior models have isolated some factors that can be related to non- motorized travel and have developed quantitative relationships between these factors and modal split. Also, the results of these studies are potentially useful for the trip generation component of regional travel models which include non-motorized modes. Disadvantages Aggregate behavior models have generally had low explanatory power and have not been successful at predicting mode splits when applied to other areas. Predicting behavior at an aggregate level suffers from a number of significant difficulties, including: (1) aggregate level data can mask significant variances within a population which affect behavior, e.g., the average income of a census tract may be much less important than the distribution of income; (2) the method ignores the impact of factors which are not readily available, such as attitudinal factors; (3) the primary data source on trips at a zonal/aggregate level is the census, which looks only at work trips; and (4) the available data generally do not include environmental variables which describe the overall quality of the area for bicycling or walking, the overall quality of alternative modes, etc.
Overview Sketch plan methods can be defined as a series of simple calculations to estimate the number of bicyclists or pedestrians using a facility. These methods generally rely on data that already exist or can be collected with relative ease (such as census and land use data), and can be combined with behavioral assumptions derived from other studies. Sketch plan methods vary widely in their specific approaches and in their level of sophistication. Typical Applications A variety of pedestrian sketch-plan methods have been developed to estimate pedestrian volumes under existing and future conditions in a pedestrian activity area, such as a central business district or shopping center. These methods generally use pedestrian counts and regression analysis to predict pedestrian volumes as a function of adjacent land uses and/or indicators of transportation trip generation (parking capacity, transit volumes, traffic movements, etc.) Alternatively, data on surrounding population and employment may be combined with assumed trip generation and pedestrian mode shares to estimate levels of pedestrian traffic. At least one bicycle sketch plan method has also been applied to predict usage of a new bicycle lane in Seattle. This method relies on census data and simple travel survey data to estimate the travel impact of the project. Advantages Sketch plan methods tend to be relatively simple to understand and to apply. If the methods and data are selected carefully, they may give reasonable estimates of the number of users of a proposed facility. These methods are best for developing rough estimates for planning purposes and for comparing potential usage levels among facilities or areas to prioritize actions. Disadvantages Sketch plan methods tend to rely on limited local data and on general assumptions about behavior. Therefore, they can be imprecise and may not account well for specific local conditions such as characteristics of the facility, network, surrounding population, destinations, or competing modes of travel. In addition, methods and assumptions developed for specific applications may not always be relevant to applications in other geographical areas.
Overview A discrete choice model predicts a decision (choice of mode, choice of route, etc.) made by an individual as a function of any number of variables, including factors that describe a facility improvement or policy change. The model can be applied across a population to estimate the total number of people who change their behavior in response to an action. The model can also be used to derive elasticities, i.e., the percent change in bicycle or pedestrian travel in response to a given change in any particular variable. Typical Applications Discrete choice models are widely used by regional travel modelers to predict auto vs. transit mode choice. Mode choice models have also been developed that include bicycling and walking as options; a model was recently developed in Chicago to predict the impacts of pedestrian and bicycle improvements on transit access mode (see sidebar). Discrete route choice models have also been developed for bicyclists which model bicyclists preference for various facility design features when selecting a route. Advantages Discrete choice models based on local survey data are the most accurate tool available for predicting travel behavior impacts. These models can be a powerful tool for isolating and quantifying the effects of specific factors, both personal and environmental, on travel behavior. They can also be used to examine the interaction of each factor with other factors, e.g., whether age has an impact on the type of facility preferred. Disadvantages Development of a discrete choice model generally requires the collection of extensive survey data and requires expertise in discrete choice modeling techniques. Also, since the number of factors (facility design, personal, etc.) which can be considered in any particular modeling exercise is limited, it is not possible to identify or control for all factors which may influence behavior. Furthermore, a model developed for a specific situation may not be applicable to other situations if important factors not considered in the model differ between the two situations.
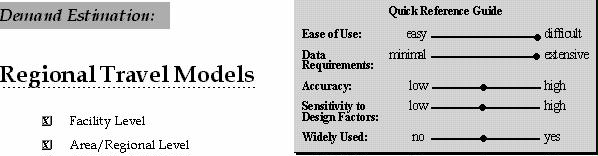
Overview Regional travel models, commonly referred to as four-step travel demand models, use existing and future land use conditions and transportation network characteristics, in conjunction with models of human behavior, to predict future travel patterns. These models are described in more detail in section 2.4 of this overview and section 2.8 of the supporting documentation. Typical Applications Traditionally, regional travel models have been oriented toward predicting trips by automobile and transit. However, a number of models in the United States, Canada, and Europe have recently been modified to estimate non-motorized mode splits based on ratings of the pedestrian friendliness or bicycle friendliness of individual zones. Some models have also been modified to include bicycle and/or pedestrian facility networks and to predict the route choice impacts of improving or adding facilities. Models have also been developed specifically for bicycle or pedestrian travel. For example, in the 1970s pedestrian demand models were developed for various commercial business districts in the United States. These models related pedestrian trips to land uses at a block level and assigned trips between blocks based on characteristics of the pedestrian network. Advantages Regional travel models have been developed for all major urban areas in the United States. The regional travel model structure provides an integrated framework for analyzing travelers choices between modes. Given sufficient data collection and enhancements to the model structure, regional travel models could serve as a powerful tool for analyzing bicycle and pedestrian travel. Regional travel models can also serve as a source of data, such as total trips generated in an area, which are useful for other bicycle or pedestrian modeling or sketch-planning efforts. Disadvantages The current generation of regional travel models was developed at a spatial scale appropriate for automobile rather than bicycle or pedestrian travel. Also, incorporation of non-motorized modes may require significant data collection to create a zone-level "environment factor" or develop a network of bicycle and pedestrian facilities. Current regional travel models also do not consider trips made for the sole purpose of recreation. Finally, the development and modification of travel models require considerable expertise and the use of specialized software packages.
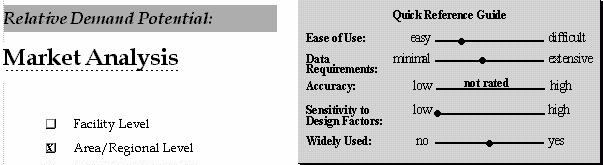
Overview This is a general approach which estimates the maximum potential number of trips by bicycle or walking in an area, based on (1) current trip length distributions, usually by trip purpose; (2) rules of thumb on the maximum percentage of bicycling or walking trips by trip distance and purpose; and/or (3) the percentage of the population likely to switch to bicycling or walking, based on identifying a target market of bicyclists or walkers according to commute distance, demographic characteristics, etc. An ideal network of facilities is assumed, i.e., this method estimates how many trips might take place if the quality of facilities was not an issue. Typical Applications Market analysis is a relatively common approach that can be applied in many different ways, with varying levels of detail. Some studies have taken aggregate data on trip lengths by purpose for an area and applied a rule of thumb about the maximum bicycle or walk trip length, in conjunction with a best guess as to the likely mode share diversion, to estimate the potential bicycle or walk mode share. Others have focused on defining the demographic characteristics of people most likely to walk or bicycle, and subsequently using demographic information for an area, in conjunction with trip length distributions, to obtain an overall maximum potential mode split under ideal conditions. Advantages Market analysis methods generally define an "upper bound" on the number of trips by cycling or walking and may therefore give municipalities a target to shoot for in developing plans to improve facilities city-wide. This type of analysis can also be helpful in identifying areas of greatest potential demand, as an aid to prioritizing projects. Disadvantages Market analysis methods are intended only to achieve rough estimates of the maximum number of trips that could be diverted to bicycling or walking. The methods are not useful for estimating changes in demand in response to an improvement, and they shed little light on factors affecting the decision to walk or bicycle.
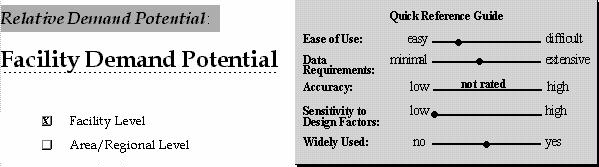
Overview Measures of potential demand have been developed for both bicycle and pedestrian facilities for the purpose of prioritizing facility improvements according to areas of highest potential demand. Demand potential is measured based on characteristics and levels of the surrounding population, trip generators, as well as other environmental factors such as topography and the quality of connecting facilities. Typical Applications Measures for both bicycle and pedestrian facility demand potential have been developed and applied to prioritize improvements (see sidebar). Advantages Measures of potential demand can be a useful aid to prioritizing locations for improvements, particularly when applied in conjunction with measures of supply or facility quality to identify areas of both high potential demand and significant deficiencies. In addition, these measures can frequently be constructed from readily available data sources such as the census and local land use data bases. Disadvantages Measures of potential demand only indicate relative levels of demand between areas, rather than predict the actual number of users of a facility. They do not indicate the extent to which usage is likely to increase as the result of a particular improvement, and they do not indicate which improvements to a specific facility or area should be given the highest priority. Also, the factors used in constructing the index may or may not be good indicators of the true potential demand for the facility.
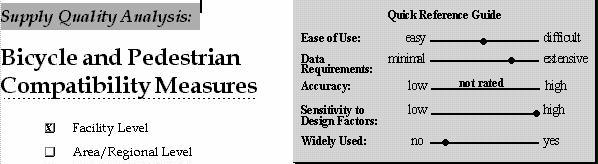
Overview A variety of compatibility measures have been developed to indicate the suitability of a particular facility for bicycle or pedestrian travel. These measures have been given names such as "Level of Service," "Stress Level," "Compatibility Index," and "Interaction Hazard Score." The measures combine factors such as motor vehicle traffic volume and speeds, lane or sidewalk width, pavement quality, and pedestrian amenities into an index of overall suitability for travel. The measures can be used alone or in conjunction with measures of potential demand to prioritize facilities for improvements. Typical Applications Compatibility measures have been used in a number of cities to rank facilities for purposes of prioritizing projects. For example, Orange County, NC, has applied the Bicycle Stress Level index to determine the suitability of their planned bicycle routes. Level-of- service measures have also been applied in conjunction with the Latent Demand Score to prioritize projects in various urban areas in Florida. Oregon has developed a Deficiency Index which it uses in conjunction with potential demand indicators to rank and prioritize pedestrian facilities. Advantages Compatibility measures can serve as a useful means of prioritizing facilities for improvement as well as determining which improvements will be most beneficial. Compatibility measures may also become a key component of non-motorized travel demand forecasting, if relationships can be developed between the indices and individuals' likelihood of making a bicycling or walking trip. Disadvantages Existing indices primarily rate individual segments rather than describing the overall compatibility of a route. They cannot account for the effects of intersections and other discontinuities, and they do not sufficiently describe the overall compatibility of a route made up of different segments with different ratings. Also, the indices may not include all relevant factors (or may require significant data collection to do so), and they may not properly reflect perceptions if not validated through surveys. In addition, they do not predict the actual number of trips on the segment.
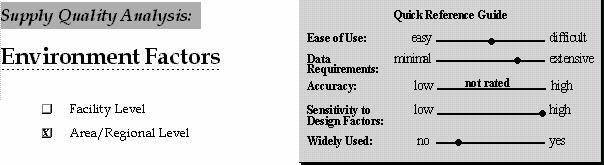
Overview Pedestrian and bicycle environment factors describe the friendliness of an area (such as a city block, census tract, or traffic analysis zone) for walking and/or bicycling. The factors are quantitative and may be a composite of a number of quantitative descriptors and subjective factors. Examples of factors considered include lane or sidewalk width, street continuity, topography, and the aesthetic quality of the environment. Typical Applications Pedestrian and bicycle environment factors have been developed primarily for use in regional travel models. A pedestrian environment factor has been developed and applied to the regional travel model in Portland, OR and modified versions have been applied in Sacramento, CA and Washington, DC. Montgomery County, MD, has developed a different pedestrian/bicycle environment factor for use in its travel model. A transit friendliness factor describing the quality of pedestrian access to transit has been developed in Washington State. Advantages Considerable research has been performed recently on factors that make areas inviting to pedestrians, and much of this knowledge has been incorporated in the current generation of environment factors. The factors have been found to enhance the performance of travel models in Portland, OR and Montgomery County, MD particularly for predicting vehicle trips from an area. These factors may also be useful in prioritizing areas for improvements, based on the relative ratings of individual areas. Disadvantages Environment factors are frequently based on subjective ratings and their performance at predicting actual variations in travel behavior has not yet been widely validated. Also, separate bicycle environment factors have not been developed; the ability of these or of combined pedestrian/bicycle factors to predict bicycle trip activity has not yet been tested. In addition, environment factors require considerable field data collection to develop for a specific area.
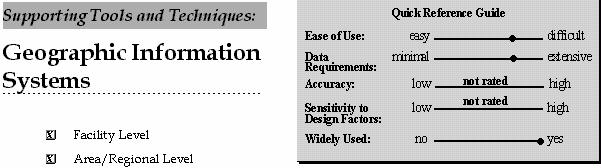
Overview Geographic Information Systems (GIS) relate environmental and population data in a spatial framework, using location points, lines (commonly roadway links and corridors), corridors), and polygons (surface areas and analysis zones). GIS are employed as a mechanism for the physical inventory of transportation facilities; as a planning tool to relate available environmental, personal transportation and household characteristics data; as a spatial analysis tool for calculating distances and areas; as a network performance monitor; and as a vehicle for the graphic display of data and analysis in a geographic context. Typical Applications GIS have been used in non-motorized planning to inventory and evaluate facilities such as roads and sidewalks; establish spatial relationships between roadway network links, features such as activity centers, and area population characteristics; compare and display current conditions with projected travel and conditions; assess total network performance and identify optimal routes; produce printed maps; and develop network measures (e.g. street density and connectivity) and land use measures (e.g., mix of residential, office, and retail) which can be related to the likelihood of walking or bicycling. Advantages GIS can greatly increase the ease of analyzing data relevant to non-motorized travel forecasting. For example, a corridor surrounding a facility can be defined and the characteristics of the population within the corridor easily identified. GIS allows development of spatial measures and analysis of data relationships which might otherwise be prohibitively time-consuming or impossible. The display capabilities of GIS are also valuable for conveying information to policymakers and the public. Disadvantages GIS require considerable user skill as well as specialized software to develop, although future developments will make them more accessible to laypersons. Also, since GIS can only manage and analyze data, the data must still be collected through other means.
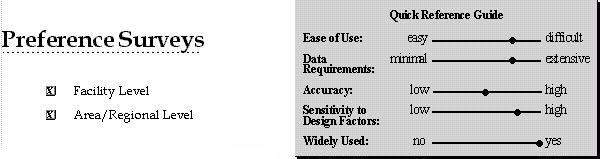
Overview Using survey research techniques, preference surveys (also known as stated preference surveys) focus on the choices that people would make given discrete alternatives. Respondents are asked to express an attitude or make a choice as to how they would act under certain conditions. Two basic types of preference surveys exist. Attitudinal surveys ask respondents directly how they would respond to various actions (e.g., would they bicycle if bike lanes were available), or ask them to rate their preferences for various improvements. Hypothetical choice surveys require respondents to make choices between hypothetical alternatives with varying attributes, and survey results are then used to develop models of behavior. Typical Applications Attitudinal surveys have been widely used to estimate the potential impacts of bicycle and pedestrian improvements and to determine relative preferences for such improvements. Hypothetical choice surveys are generally used to develop discrete choice models and to estimate the relative importance of each attribute (time, cost, presence of bike lanes, etc.) in common terms. Advantages Attitudinal surveys are relatively easy to design and implement. They can also be good tools for evaluating relative preferences and for estimating the maximum possible response to an action. Hypothetical choice surveys, if carefully designed, can be used to develop relatively accurate models of behavior and to give quantitative information on the relative importance which people place on various factors. Disadvantages Attitudinal surveys often significantly overestimate the response to a bicycle or pedestrian improvement, since people tend to be more likely to state that they will change their behavior than to actually do so (Goldsmith, 1992). Therefore, they are not well-suited for predicting actual shifts in travel demand. While hypothetical choice surveys overcome many of the limitations of attitudinal surveys, they must be designed carefully and require considerable time and expertise to implement. Both types of preference surveys suffer from the further drawback that people may not have any real-world experience with the choices they are asked to make, and may therefore be unable to indicate their preferences or actions with accuracy.
3.2 Key Characteristics and Uses of Each MethodThis section summarizes key characteristics of the methods and suggests appropriate methods according to specific purpose such as forecasting the number of new users of a bicycle/pedestrian trail. More specifically, table 3.2 summarizes key characteristics of each of the 11 methods, providing more detail on the factors (e.g., ease of use and data requirements) rated in the quick reference guide for each method. Tables 3.3 through 3.6 are intended as a guide for practitioners who need to choose the most appropriate method for a specific situation. Each table lists a specific purpose for which non-motorized demand forecasting methods may be applied and suggests which methods are most appropriate for that purpose. Generally the methods are ordered from simpler to more complex in Tables 3.3 - 3.5. For each of these methods, the table describes the specific way in which the method would be applied and identifies major advantages and disadvantages of using the method for the given purpose. These purposes include: Table 3.3 - estimating the number of users of a new facility; Table 3.4 - estimating the number of new bicycle or pedestrian trips area-wide, as a result of facility or network improvements; Table 3.5 - prioritizing design features for a specific facility; and Table 3.6 - prioritizing facilities for improvement. 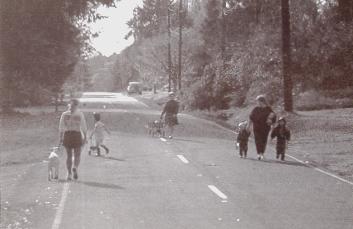 Figure 3.2: If Sidewalks Were Built Here, How Many People Would Use Them? How Far Up on the Priority List is This Project?
Table 3.2 - Key Characteristics of Available Methods.
Table 3.3 - Methods for Estimating the Number of Users of a New Facility.
Table 3.4 - Methods for Estimating the Number of New Bicycle or Pedestrian Trips Area-wide as a Result of Facility or Network Improvements.
Table 3.5 - Methods for Prioritizing Design Features for a Specific Facility.
Table 3.6 - Methods for Prioritizing Facilities for Improvement.
FHWA-RD-98-165 |
||||||||||||||||||||||||||||||||||||||||||||||||||||||||||||||||||||||||||||||||||||||||||||||||||||||||||||||||||||||||||||||||||||||||||||||||||||||||||||||||||||||||||||||||||||||||||||||||||||||||||||||||||||||||||||||||||||||||||||||||||